First, I have to say that when you get a clean bear flag like the SOX index down to $5600, which I called out Monday,
“Semis (SOX +0.4%) gained a little, but made no forward progress.
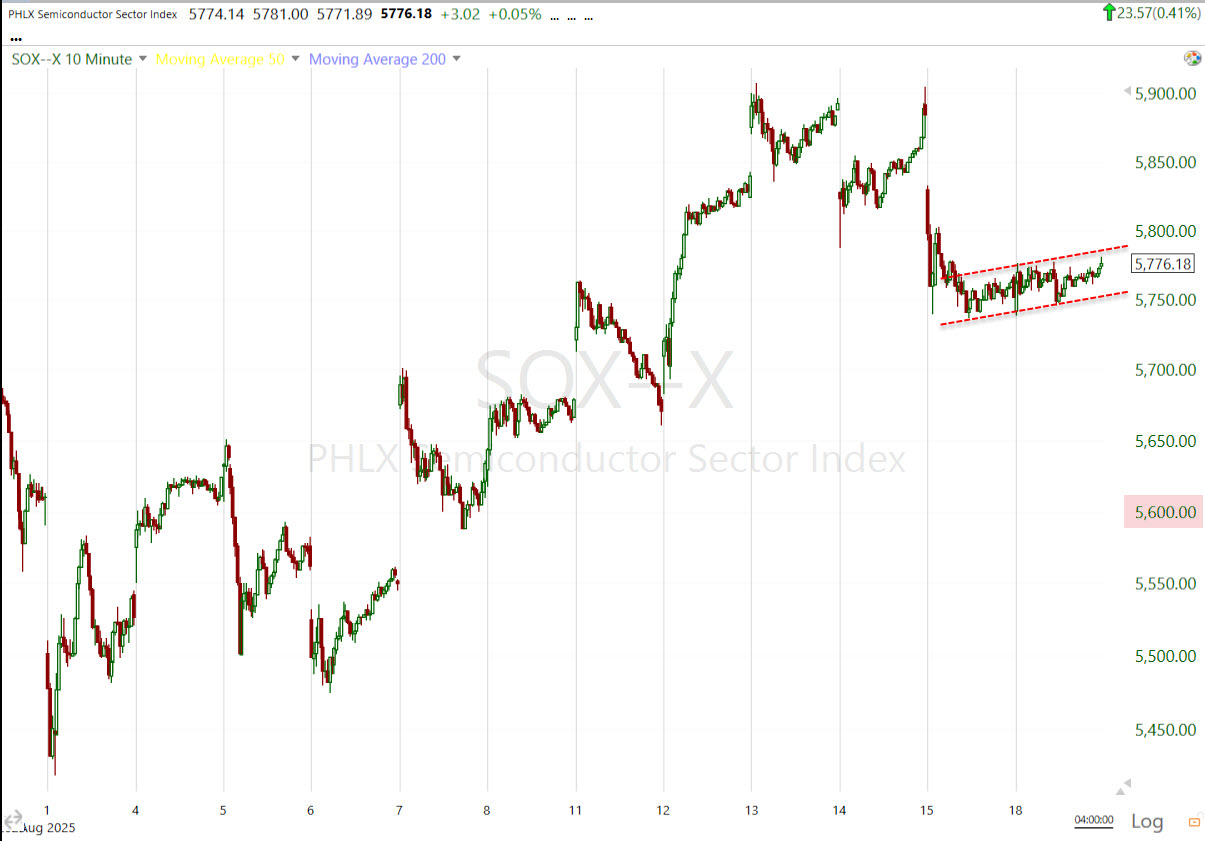
SOX (10m) has a small bear flag that has a measured move down toward $5600.”
Take the win at the measured move target. It’s usually pretty darn accurate. This morning SOX fell almost -3.4% down to $5480, an even bigger gift, but 80% of the time price is going to settle right around the measured move target.
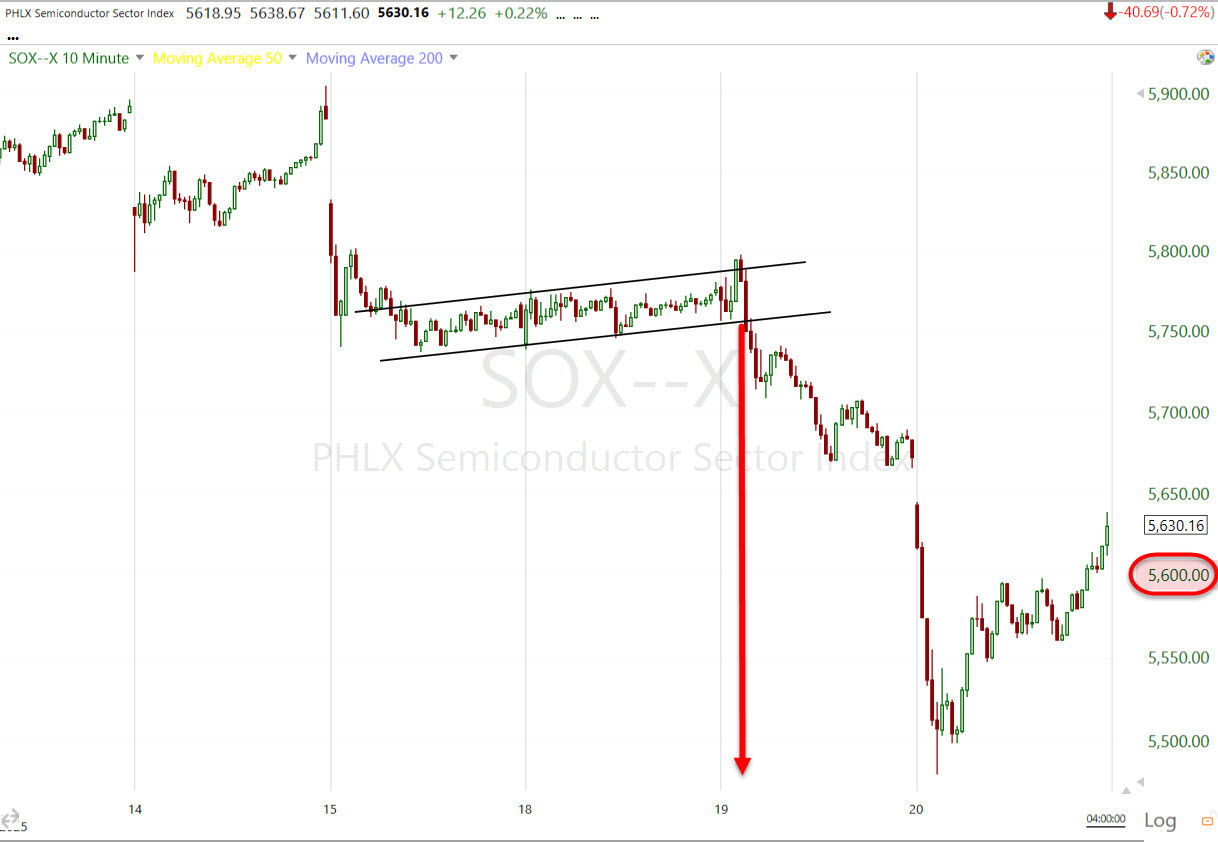
SOX (10m as of the close) – It may not be a huge move, but it was a worthwhile trade if it’s the type of trade you have the time to manage. More importantly is the concept of measured move targets and price settling in the area of the target range. I hope some of you were able to take advantage of this one. More broadly, it told us that the market had more downside to go after yesterday’s plunge. Semis aren’t coming down without the Tech sector, and as the Tech sector goes, so too does the market most of the time.
Tuesday I wasn’t quite sure what sparked the risk-off sentiment, although I had some ideas. It seems like it may have been a paper from MIT on AI published Monday. The gist of the paper? 95% of organizations are getting zero return from their investments in generative AI.
For another interesting perspective on AI that’s worth the quick read, check out Praetorian Capital’s, Harris Kupperman’s post on the blog, Kuppy’s Corner, Global Crossing Is Reborn…
The insights align with what I pointed out in January after DeepSeek upended the massive AI capex theme by doing much more with much less. While it wasn’t yesterday’s selling catalyst, META’s announcement that their downsizing and restructuring their AI division fits in nicely with the theme that’s likely behind much of the last two days of selling in the space.
The stock market opened with a continuation of yesterday’s mega-cap stocks and tech names seeing follow through selling. Dip buyers emerged around 11 a.m. ET, as anticipated yesterday, in expectation of a potentially dovish July FOMC Minutes release at 2 p.m. ET. The Momentum (+0.3%) & Growth (-0.6%) style factor dump of the last 2 days seems to be subsiding. Meanwhile, Value (+0.1%) retains modestly bid, but I don’t think this is rotation, it was derisking, at least partly a result of the MIT paper.
There was not much immediate reaction to the 14:00 ET release of the July FOMC minutes beyond a modest move lower in Treasuries. Given the two dissents in July, the Minutes showed broader than expected support for keeping the fed funds rate unchanged at 4.25% to 4.50%. Participants highlighted both inflation and employment risks, though most viewed upside inflation risk as more pressing. September rate cut expectations fell from 86.6% to 81.9%.
Today’s mixed Retail (-0.55%) earnings reports resulted in stock-specific moves, but had little effect on the broader market. TJX (TJX +2.7%) and Lowe’s (LOW +0.3%) traded higher, while Target (TGT-6.35%) disappointed investors after posting a modest EPS beat but naming an in-house candidate, COO Michael Fiddelke, as the new CEO.
Data remained light. The weekly MBA Mortgage Index fell 1.4% to follow last week’s 10.9% jump. The Refinance Index fell 3.2% while the Purchase Index ticked up 0.1%.
Averages
The tech-heavy Nasdaq-100 spent the entirety of the session in negative territory and closed with the biggest loss, but did find support at the $23,000 level and just above its 50-day SMA, while the influential Tech sector helped support the Nasdaq with a tag of its 50-day SMA.
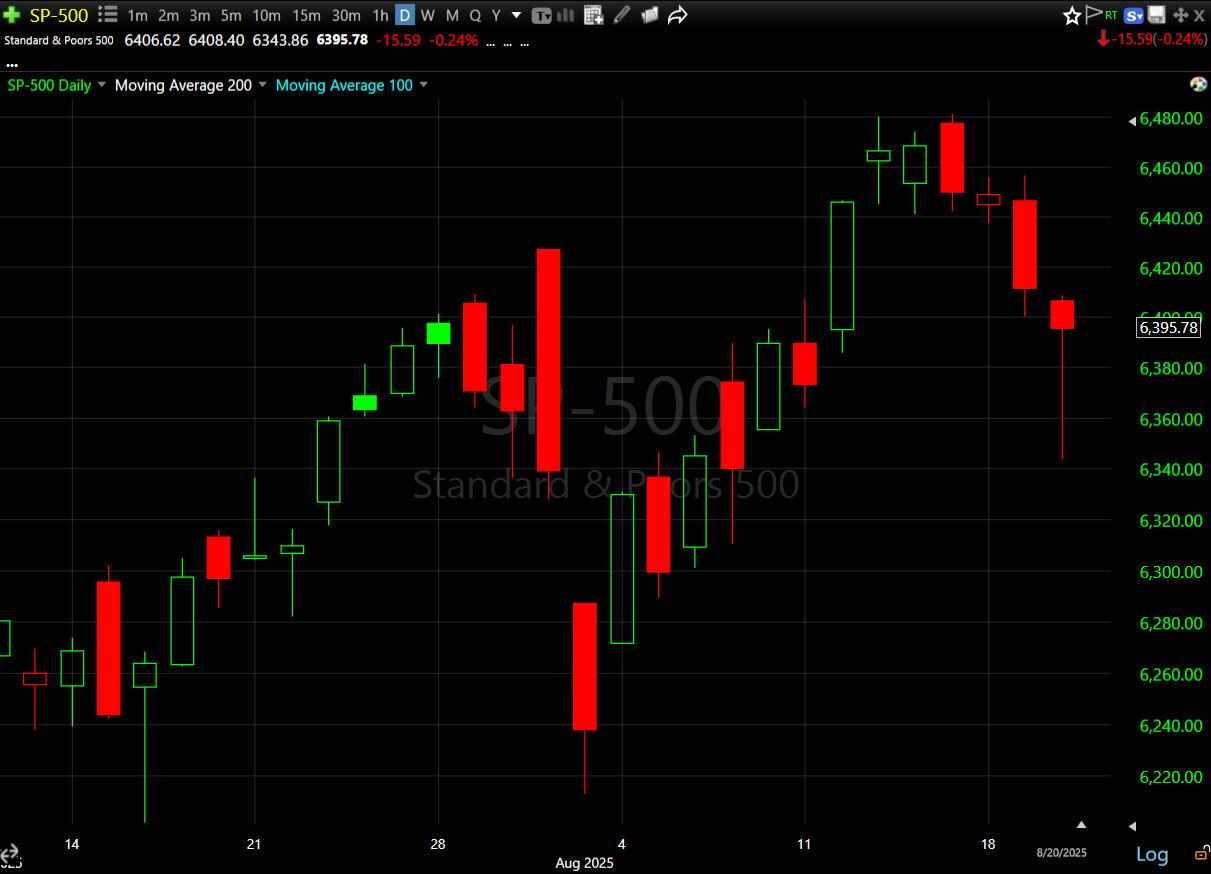
The S&P 500 finished with a more modest loss. The DJIA made a push back to its baseline late in the session, briefly trading above $45k late this afternoon before slipping below the level once again.
For six days now the Dow’s closes have been constrained by resistance at $45k, yet it’s the only average that is unchanged week to date. The S&P is down -0.85%, Nasdaq-100 -1.95% and Small Caps -0.75%.
Dow Transports (-1.9%) gave back all of yesterday’s gains and then some.
S&P-500 ⇩ -0.24 %
NASDAQ ⇩ -0.58 %
DOW JONES ⇧ 0.04 %
RUSSELL 2000 ⇩ -0.32 %
The S&P ended with a bullish Hammer…
 Lots of these today, so I expect some correcting por consolidating into Friday morning’s Jackson Hole Symposium.
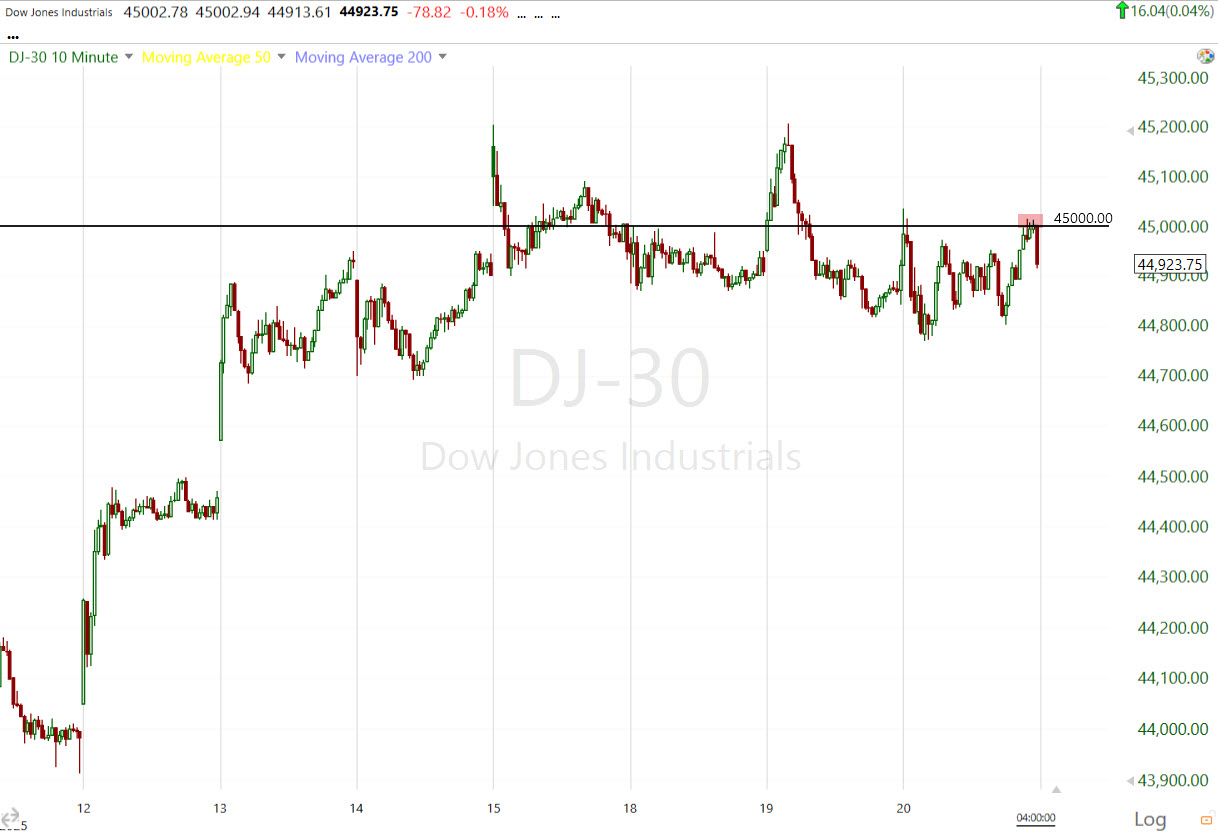
DJIA (10m) struggling with $45k still…
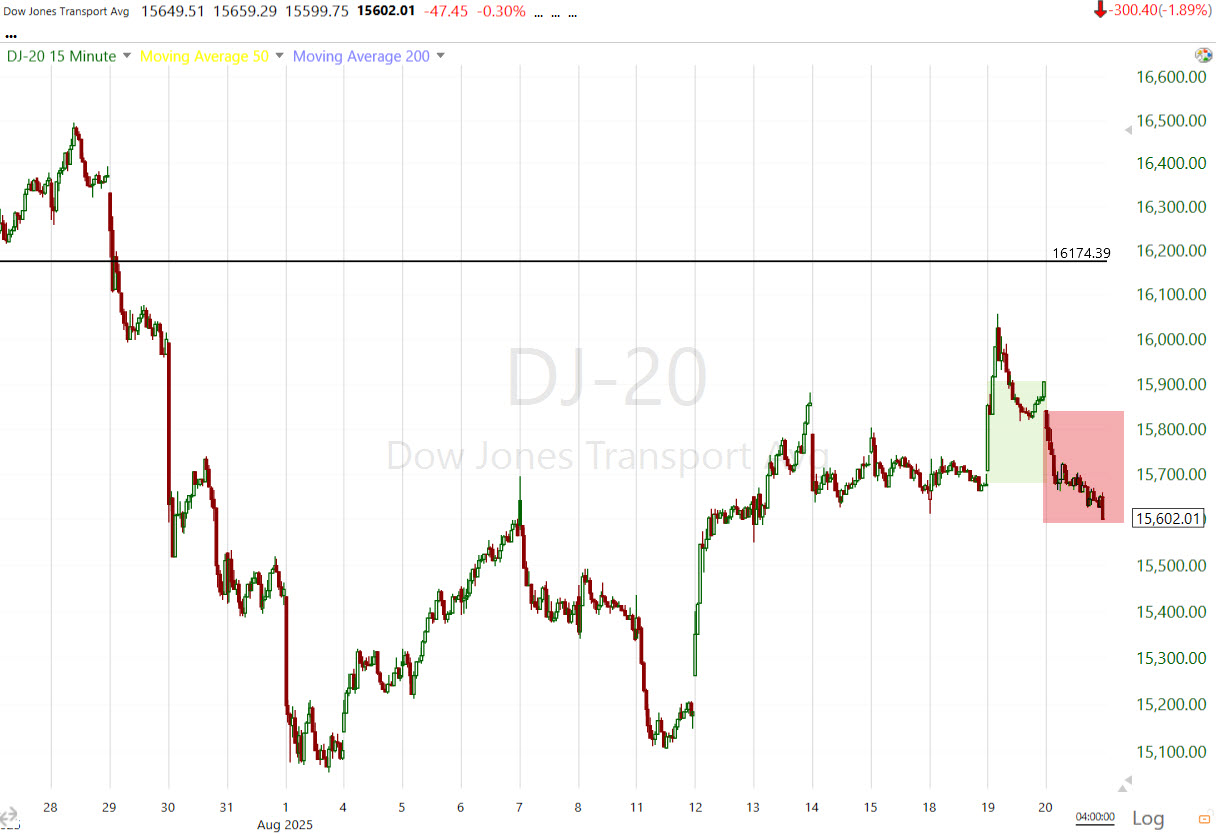 Dow Transports (15m) posted an ugly daily candle, opening at the high of the day, closing at the low of the day, but did manage to close at the 50-day SMA with the 200-day just -0.15% below as well. The release of the hawkish leaning minutes put some downside pressure on the group this afternoon and into the close. I still don’t think they are holding above that massive resistance above.
Small Cap IWM’s price action still holds some potential, but it’s worth noting that price is back to the key area of resistance going back to 2021…
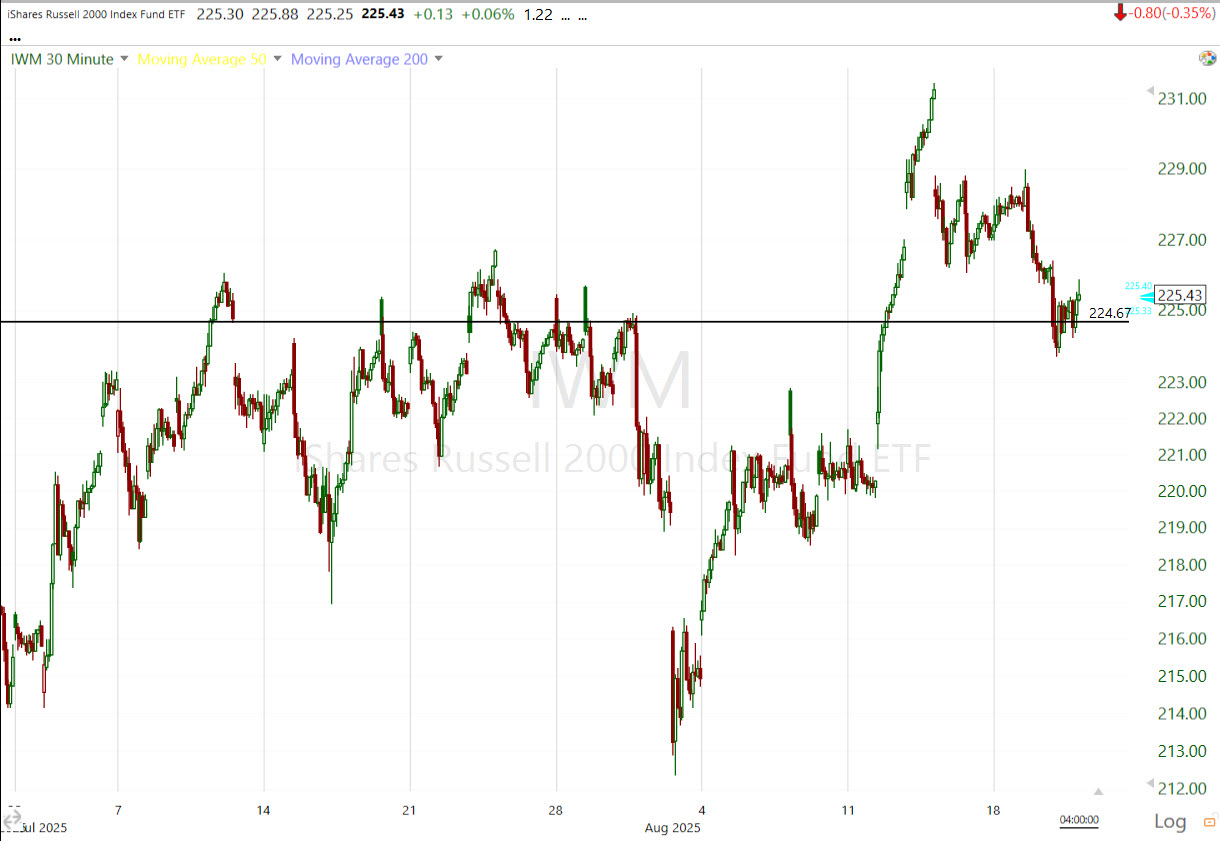 At the $225 area…
Small Caps continue to track extremely closely to my Most Shorted Index…
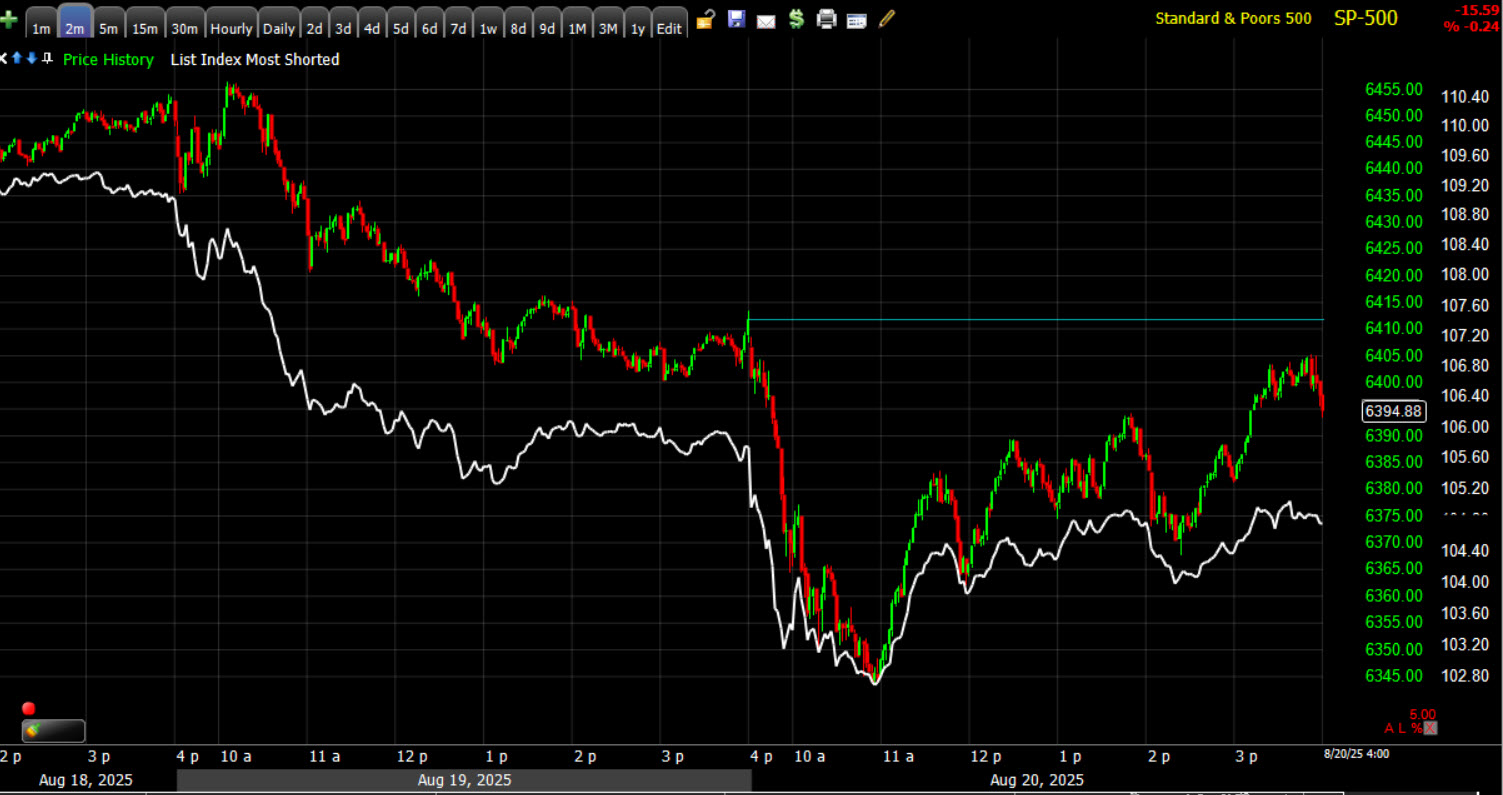 IWM & MSI (2m) – To me, that doesn’t suggest committed rotation to value and it’s certainly not showing up in procyclicals, but rather a dependency on short covering, At some point short covering loses its momentum.
VIX (+0.75%) was unremarkable, which may have had something to do with expiration. VVIX (-3.4%) came down sharply from the time I mentioned that dip buyers were showing up this morning. My take is the numerous technical support levels tagged today opens Thursday up to some corrective (bounce) action. This may change later Thursday heading into Powell’s comments Friday morning. VVIX still maintains a wide relative strength margin over VIX.
The ABI is in the 27’s.
S&P sectors
Seven of 11 sectors managed a gain, but similar to yesterday, the day had a defensive bias with counter cyclical Consumer Staples and Health Care among the best performers. It wasn’t quite as defensive as Tuesday, but apparent. The lightly weighted Energy sector was the best performing with a +1.5% gain in Crude oil.
The three mega cap heavy sectors (Technology, Consumer Discretionary and Communications) ended at the bottom of the leaderboard like yesterday, joined by the Industrial sector.
The most influentially weighted Tech sector did manage a bullish Hammer at its 50-day and price support at the $256 area, on increased volume, suggesting high probabilities of a short term low, which aligns with my view that we see a bounce or more likely a larger consolidation tomorrow heading into Friday’s Jackson Hole Symposium.
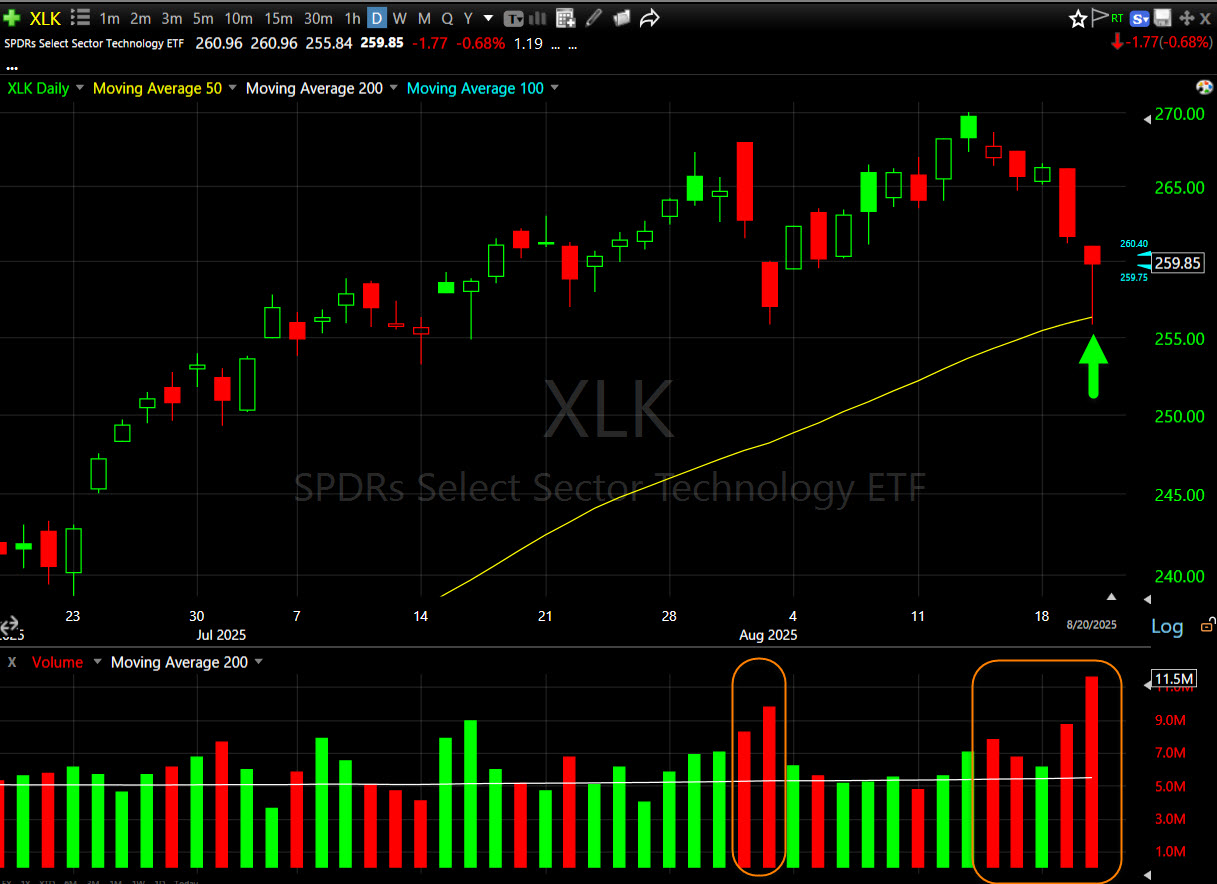 Tech sector (daily) – beyond today’s bullish hammer on heavy volume at the 50-day and price support, there is a lot more to take away from this chart. Remember the recent negative 3C negative divergence in the tech sector? Take a look at volume and how it’s rising on price corrections. That’s not a good sign, especially coming after a number of Key Reversal Days the week of Payrolls, and following my Trend Channel’s stop-out.
Don’t under appreciate the change in character this key sector is starting to exhibit. Changes in character lead to changes in trends, and the equal lows rather than higher lows demonstrates there’s already evidence the trend is changing.
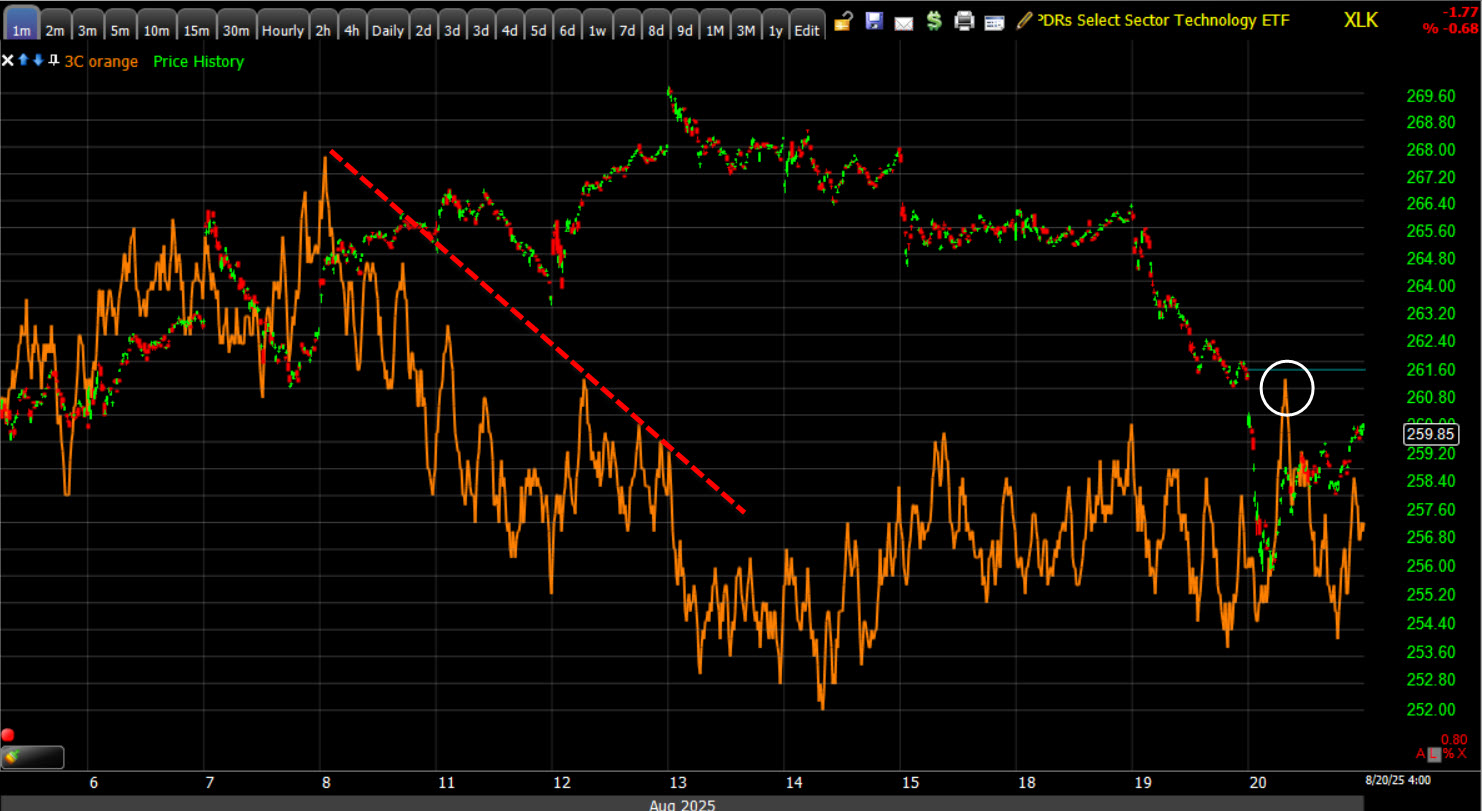 Tech sector (1m) – The Dip buying at the 50-day looks purely technical and while strong initially, faded off pretty quickly. It’s also worth mentioning that price reverted down to 3C’s level.
Intraday, here’s the equal lows that are catching my attention…
 Tech sector (30m) notice that price isn’t making higher highs/higher lows (an up trend) anymore, it’s starting to make equal lows and moving into a more lateral price trend. The price trend is not the low volatility environment of a consolidation, but rather higher price volatility more typical of a small topping pattern.
My best guess at this point is that price continues in a consolidation tomorrow ahead of Powell Friday morning…
 (10m)-perhaps something along these lines…
While not as bad as yesterday, the Mega Caps (MGK -0.65% & MAGS -1.1%) had another day of notable underperformance vs. the Equal Weight S&P-500 (-0.1%) – over a 100 basis point margin. At midday, Microsoft (MSFT -0.8%) was the only “Magnificent 7” name with a loss less than -1.0%. Meta Platforms (META -0.55%), and NVIDIA (NVDA -0.15%) would eventually see their losses narrowed, while Tesla (TSLA -1.65%), Apple (AAPL -2%), Alphabet (GOOG -1.15%), and Amazon (AMZN -1.85%) lagged. Like the tech sector, MGK and MAGS also posted short-term bullish hammer candlesticks suggesting the selling has abated for the moment. Likewise, most of the mega cap names above either posted bullish hammer candlesticks or found technical support at their 50-day moving averages as well.
The Philly Semiconductors Index (SOX) ended with a loss of -0.8%, but much like the rest of big-tech, found technical support at its 50-day SMA and posted a bullish Hammer candlestick.
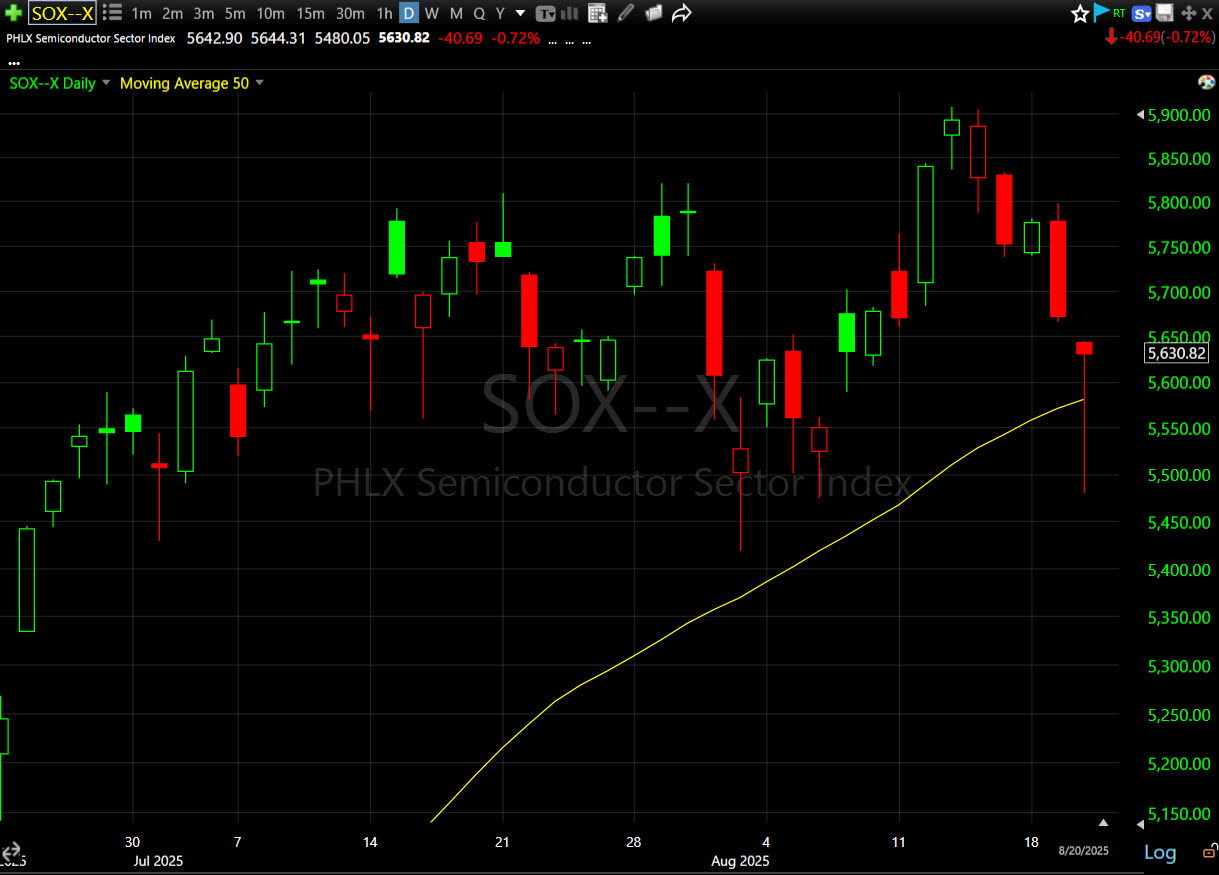 (daily) – It’s fascinating how the bear flag pattern identified on Monday projected a move down to ~$5,600, aligning closely with the 50-day SMA at $5,580.83. These recurring synchronicities in price action never cease to amaze me.
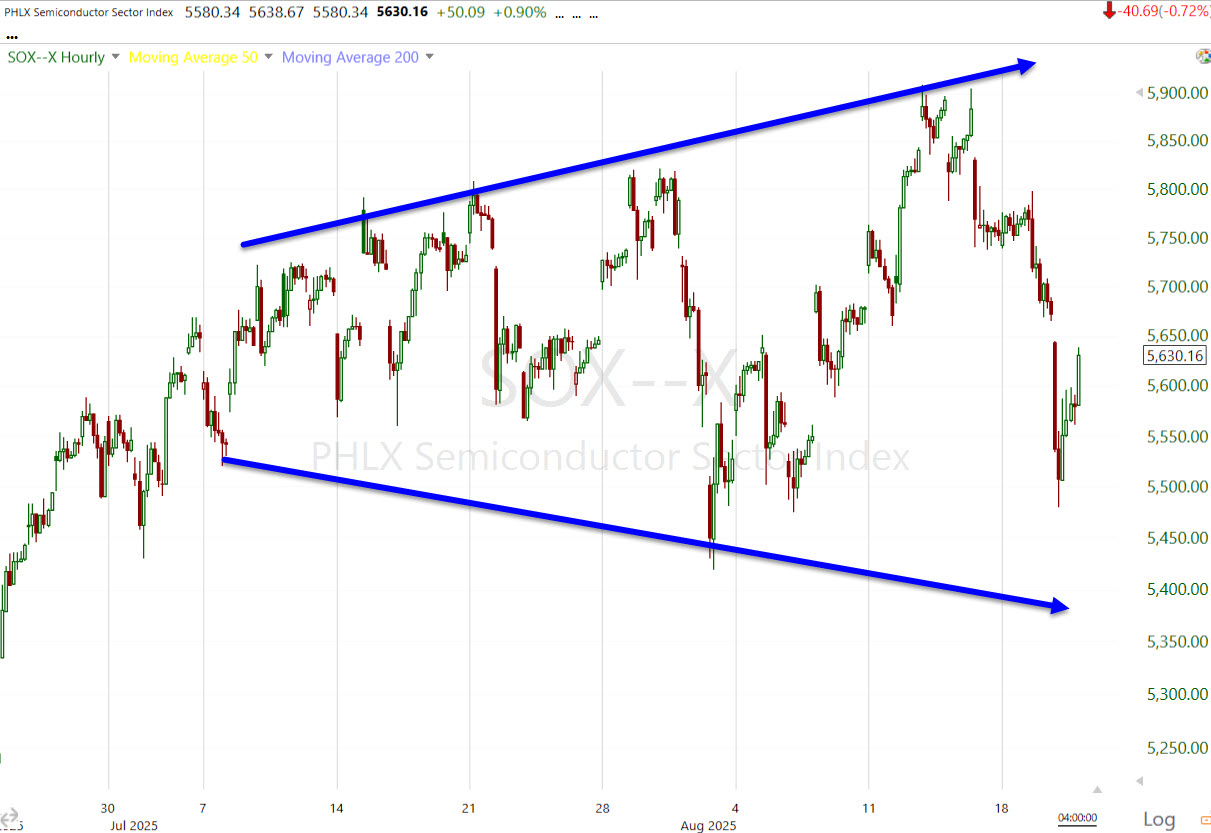 SOX (60m) – While tradeable as we just saw with a very accurate bear flag, in my opinion, this is no longer an investable trend. It’s increasingly chaotic. The AI narrative is the driving force behind elevated valuations across Tech and S&P components. It’s also responsible in part for the extreme market concentration in which 2% of S&P stocks represent 40% of index weight — 50% higher than the peak of the Dot.Com bubble.
Remember what creates Broadening formations such as the one above? A loss of intelligent sponsorship and investors reacting to rumors and news. On that front, Intel (INTC -7%) was the worst-performing stock in the SOX and the S&P 500…
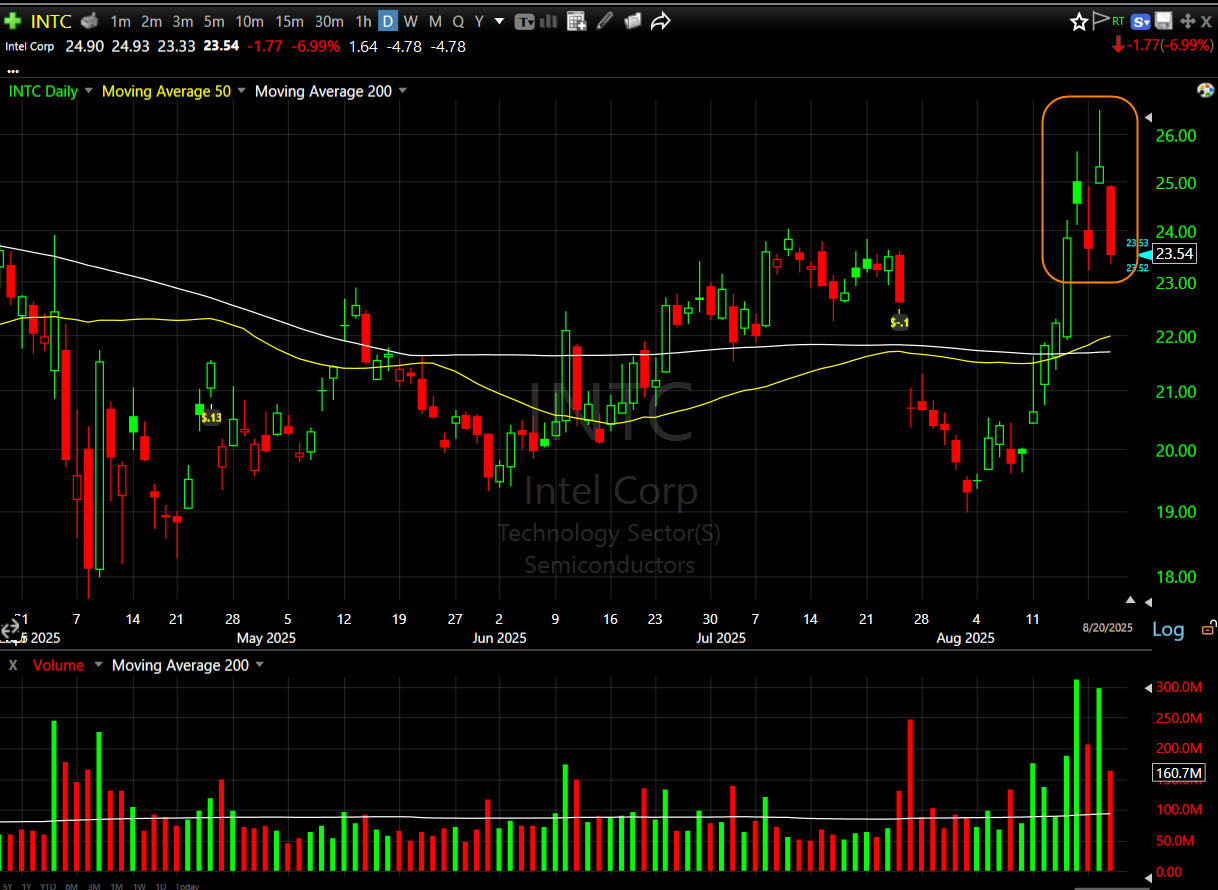
After CNBC reported that the company is in conversations with investors, seeking to offer equity stakes for a discounted price.
After breaking trend (shown in yesterday’s Daily Wrap), Nvidia put in an impressive hammer candlestick after being down as much as -3.9% this morning.
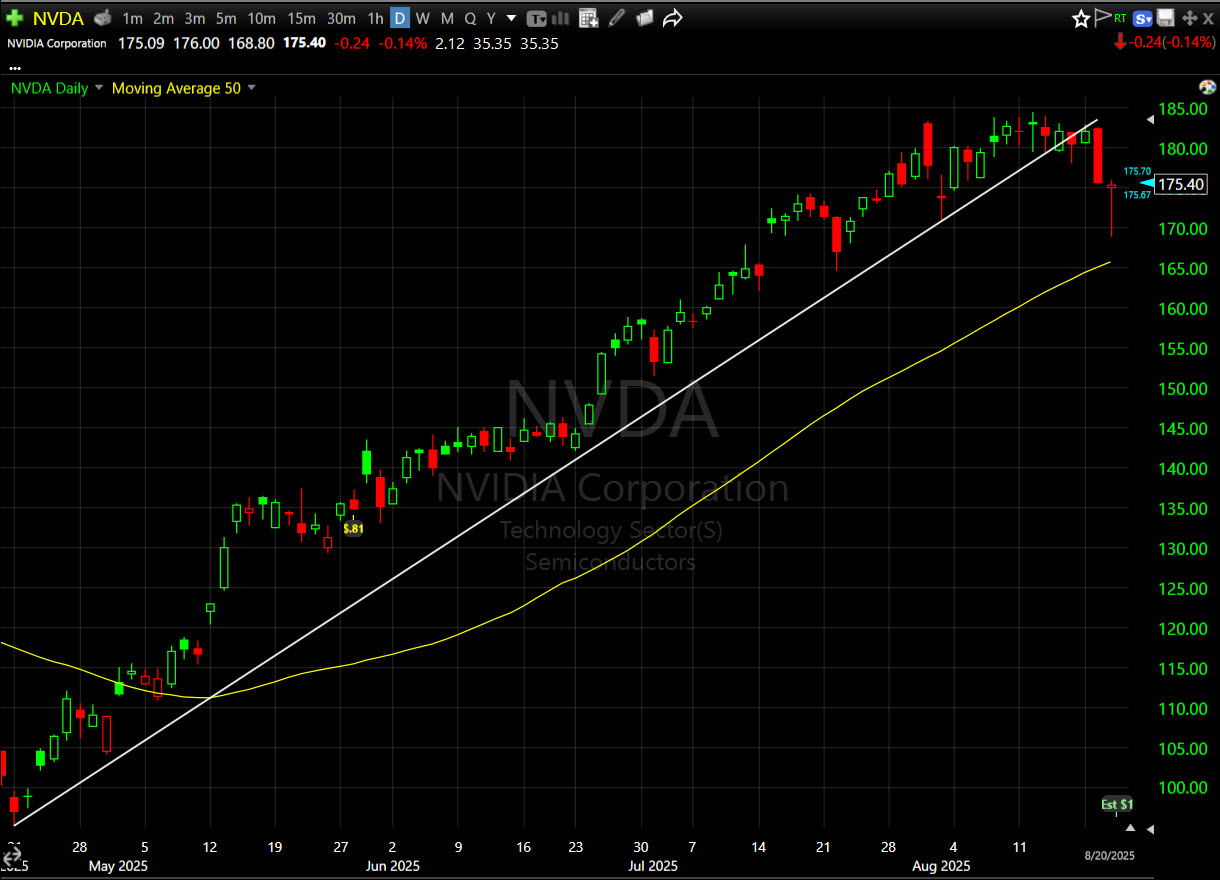 NVDA (daily) The trend break is another, change in character, but it’s very common for a broken trend to be back-tested and Nvidia probably isn’t moving too far from the trend line until the company reports earnings, Wednesday August 27th after the bell. Nvidia’s 3C chart, posted in yesterday’s Daily Wrap, mirrors that of the broader Tech sector.
Materials ⇧ 0.08 %
Energy ⇧ 0.83 %
Financials ⇧ 0.51 %
Industrial ⇩ -0.09 %
Technology ⇩ -0.68 %
Consumer Staples ⇧ 0.57 %
Utilities ⇧ 0.10 %
Health Care ⇧ 0.54 %
Consumer Discretionary ⇩ -0.99 %
Real Estate ⇧ 0.38 %
Communications ⇩ -0.30 %
Internals
Decliners 1412 had a slight edge over Advancers (1295), Just demonstrating that the weakness at the index level came from heavily weighted large cap stocks. Volume was heavier at 1.08bln shares, suggesting a short-term seller’s exhaustion event.
There was no Dominant price/volume relationship, the NDX was closest at Close Down/Volume Up, also typical of a short-term low.
The once immaculate breadth of the rally off April’s low continues to show notable cracks…
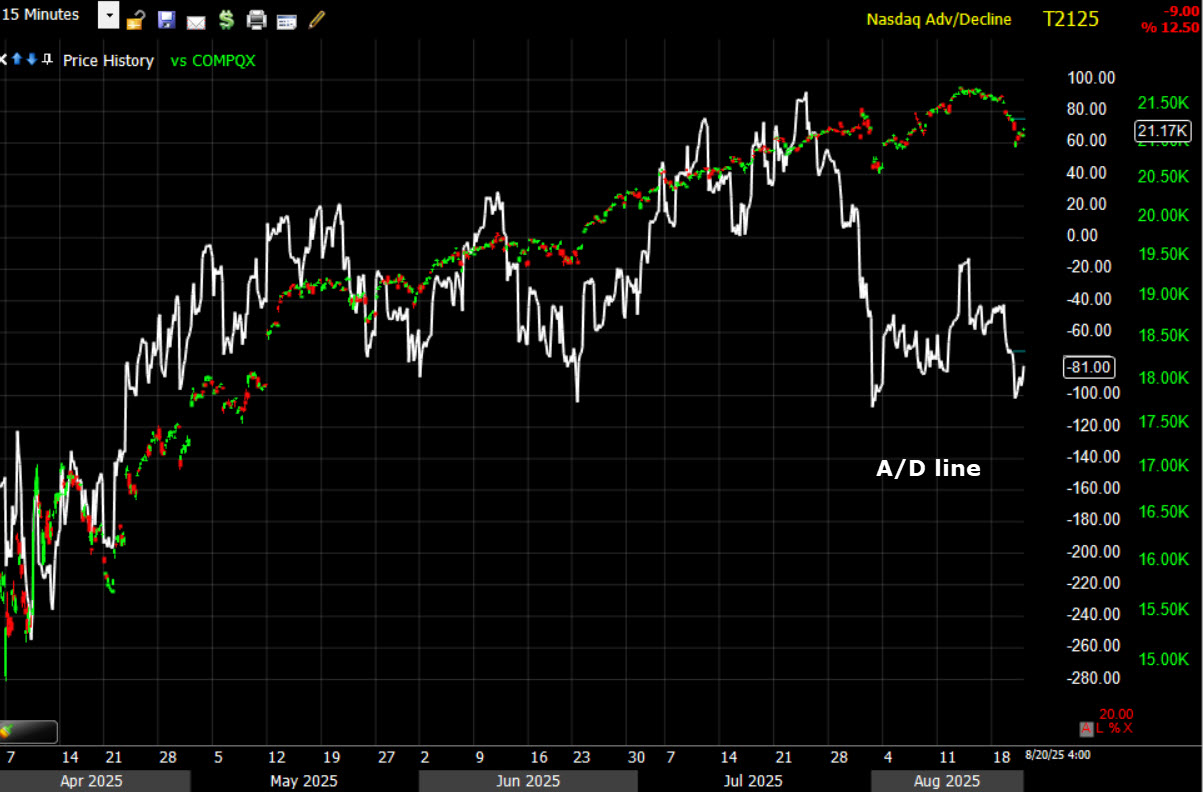 Nasdaq Composite and its Advance/Decline line (15m)
Treasuries
Treasuries were one of the few reactions to the July FOMC Minutes, although modest. Early gains were trimmed in response to the Minutes, edging slightly higher for the day with shorter Fed-sensitive tenors leading the advance. The 2-year yield settled down one basis point to 3.74%, and the 10-year yield settled down one basis point to 4.30%.
Currencies and Commodities
The U.S. Dollar Index came down -0.1% to $98.21, but holding above the $97.80 support area expected to hold until Powell, reflecting some suspicion of hawkishness.
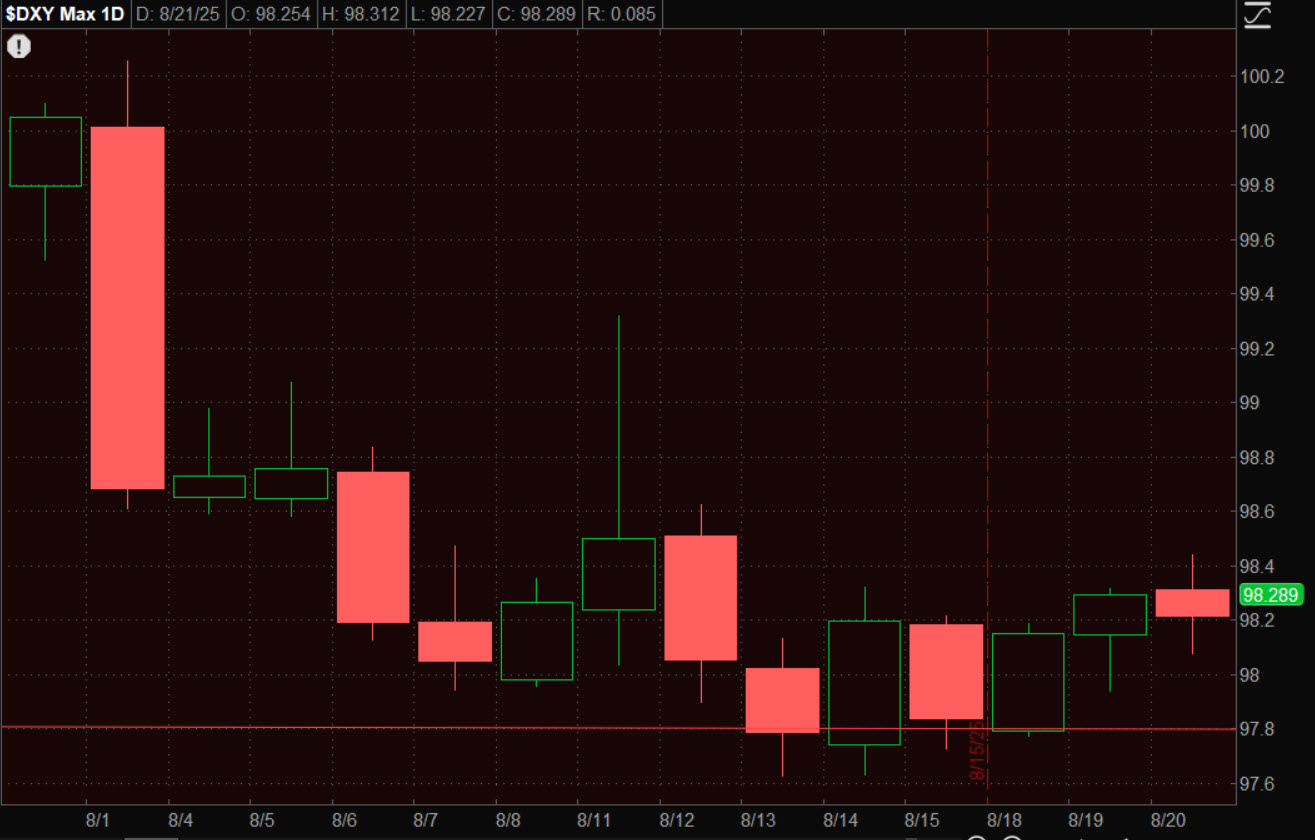 (daily) Holding support. Come Friday I’ll be watching the Dollar, the 2-yr yield and gold closer than stocks when Powell speaks.
WTI Crude oil closed up +1.5% to $62.70 per barrel after a big surprise crude inventory draw and some indications that the potential Russia-Ukraine talks may not be going so well. I still think WTI below $64 isn’t a great look.
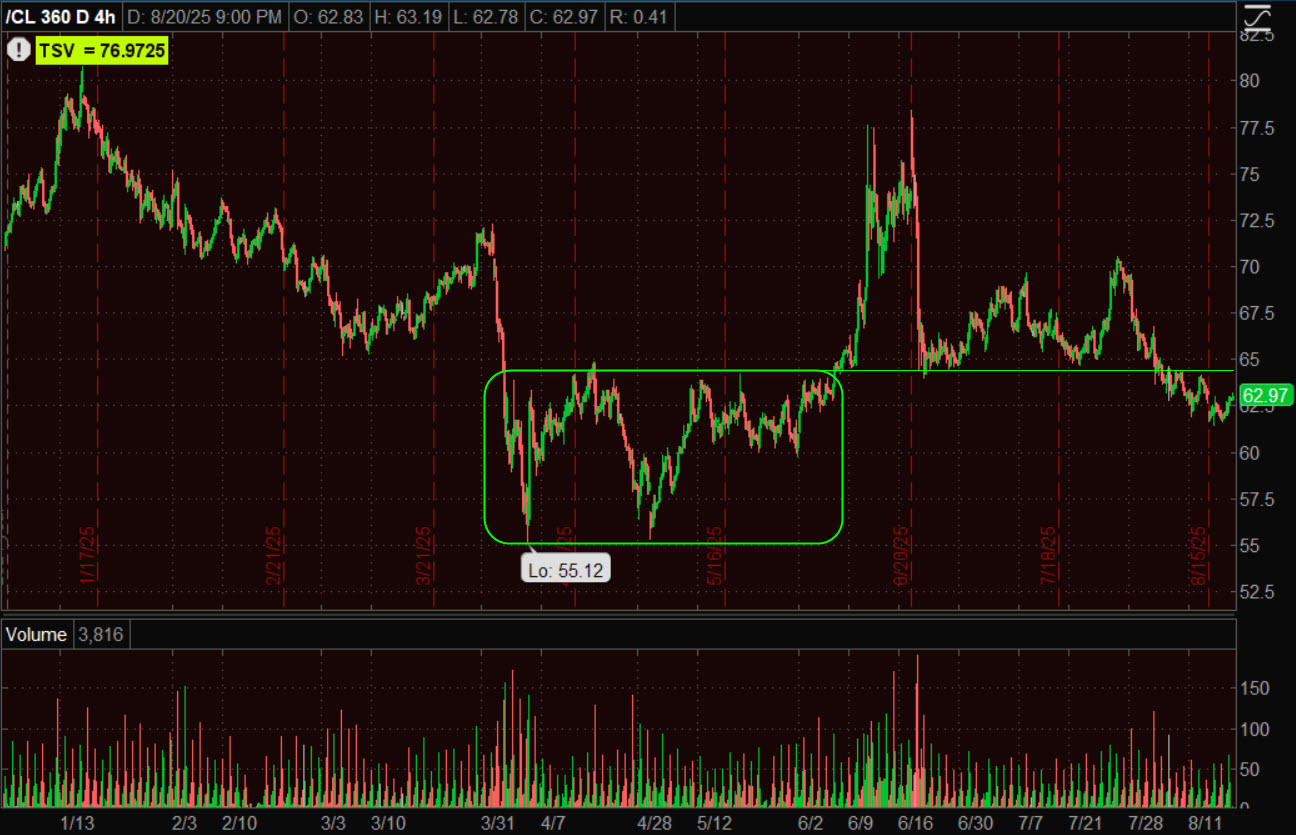 (4H) – The level was support from the “W” base from April-May, now I expect it to be resistance. There is geopolitical risk related to Russia, but for now WTI is in limbo.
Gold futures gained +0.9% to $3,388.50/oz. It’s time to redraw the trend lines on gold’s chart. This isn’t a subjective exercise, price action demands it. As suspected yesterday, the large bullish Ascending Triangle is widening out.
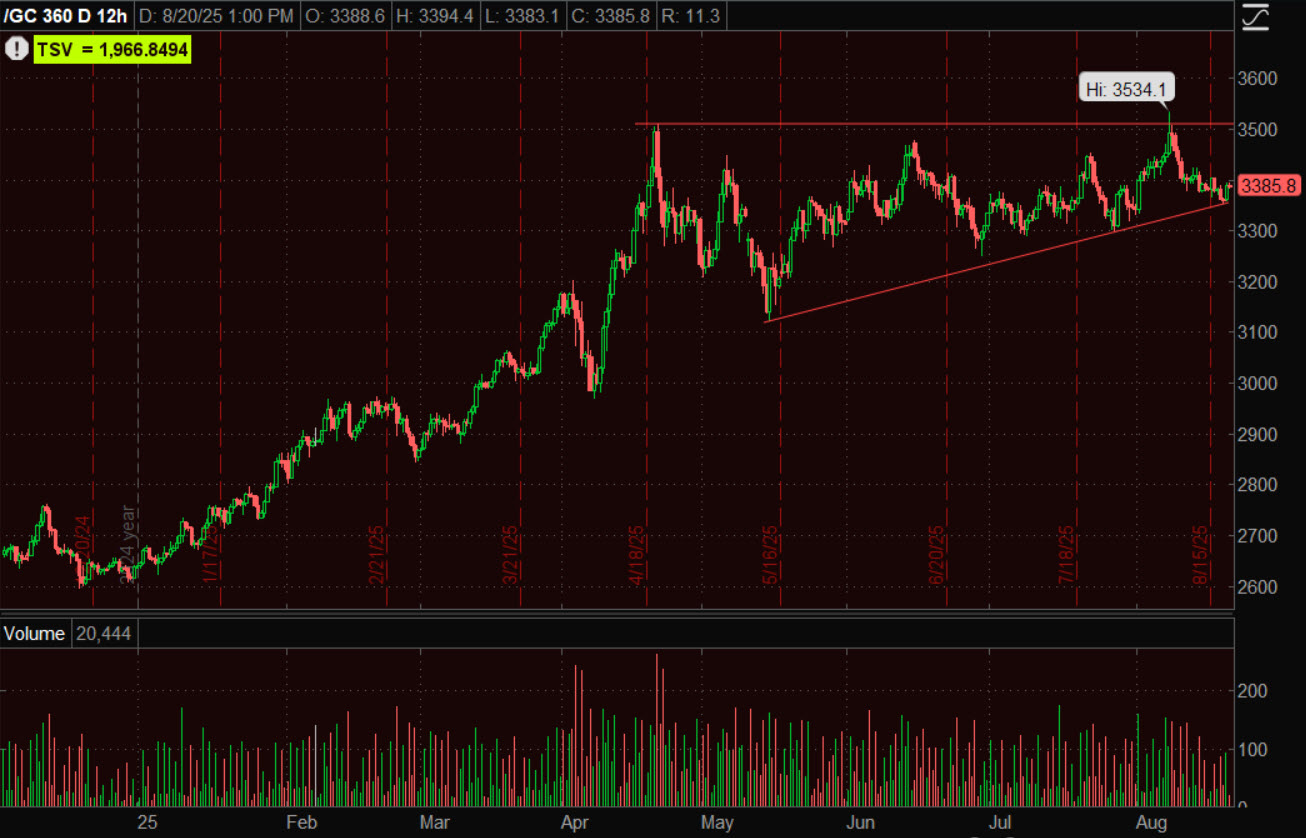 (daily) – I try to be as objective as possible when drawing trend lines. I’ve seen traders adjust them to fit what they’d like to see or forecast, but that doesn’t do anyone any favors. The price pivots demanded an adjustment. There’s no change to the bullish bias, just a little broader consolidation.
URA (-1.4%) has been hit with the AI theme as Uranium is part of the “Power Up” data center theme,
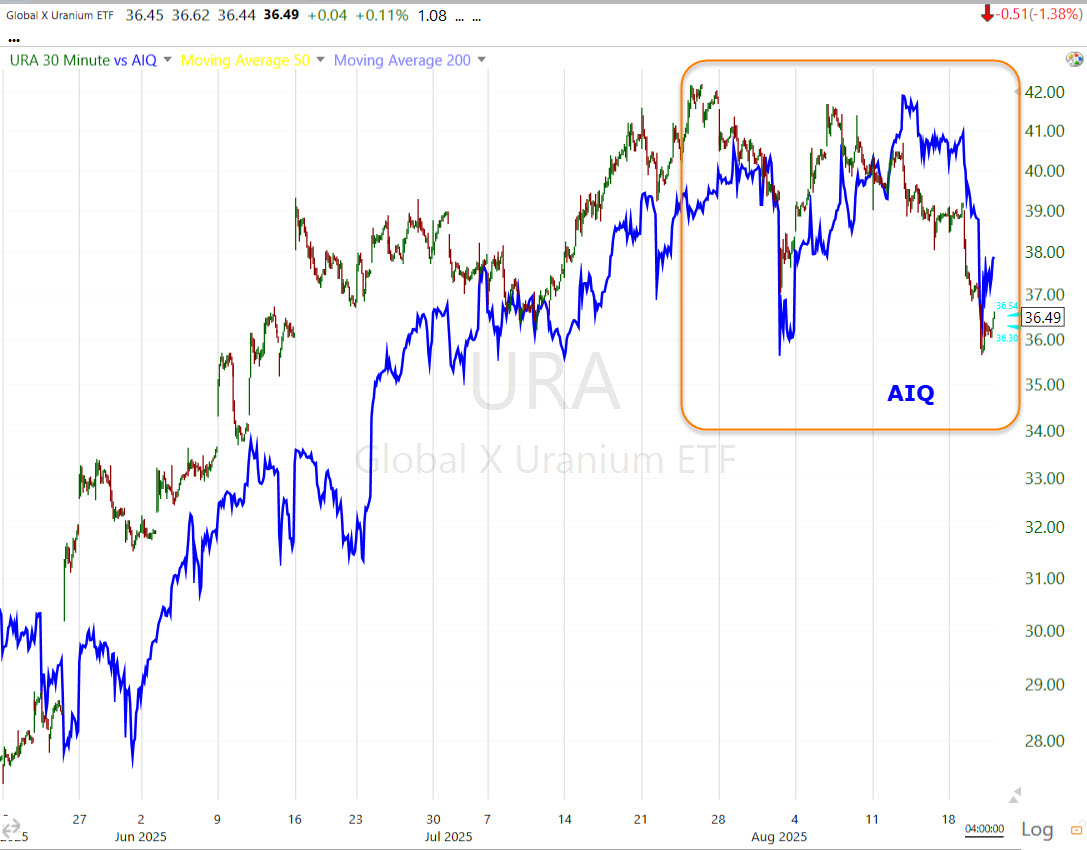 URA & AIQ (AI ETF)
I’m not worried about it. The data centers will still be built. Do a search of the news on “soaring electric bills.” Kazakhstan’s Kazatomprom, the world’s largest uranium producer, reduced its 2025 production guidance by 12–17%. There are questions about Canadian supply. Global nuclear capacity is projected to grow from 450 GW to 650 GW by 2050, driven by new reactors in China (24 under construction, 44 planned), India, and Europe. The U.S. aims for a fourfold increase to 400 GW by 2050, boosting annual uranium demand from 50 million to ~200 million pounds. Modular nuclear reactors add additional demand, and on and on. Mostly, I just like the price and volume trends.
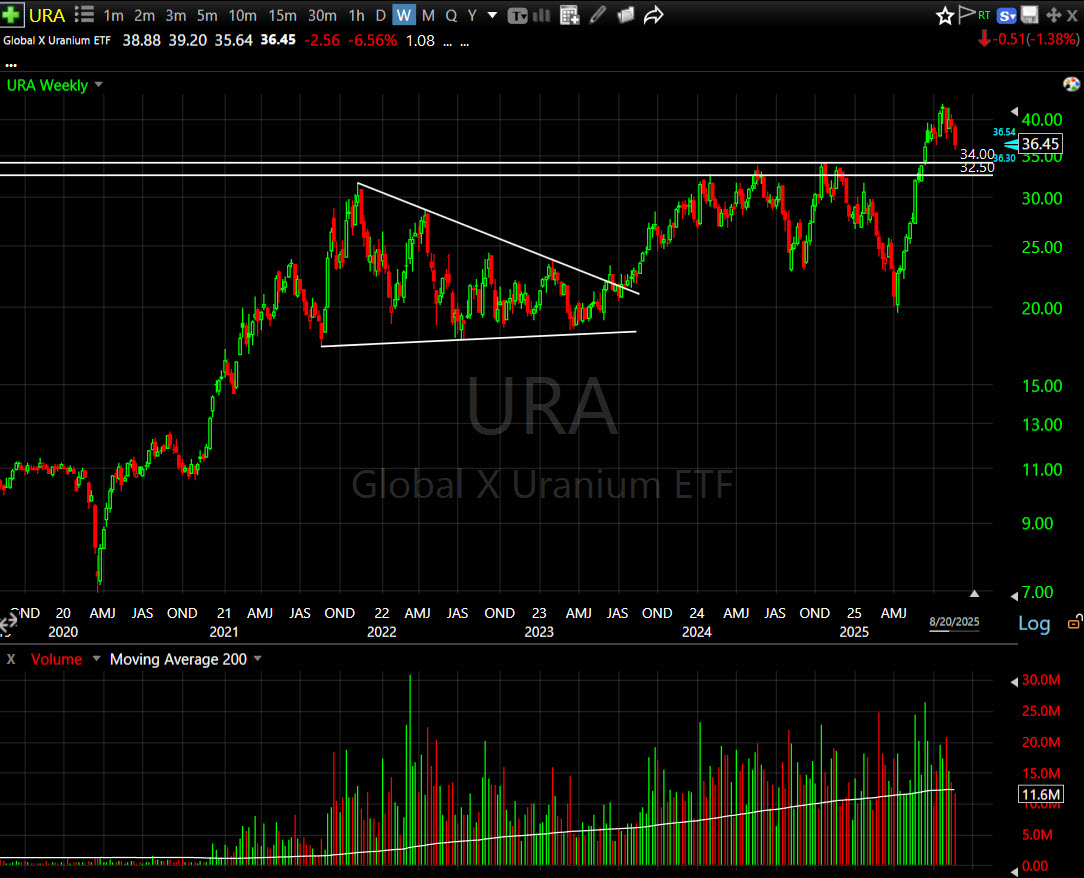 (daily) – In fact I’d be a buyer at $32.50-$34. Much below that, then I’m a little concerned. This was always a long term trend play, not a trade.
I suspect price may be entering a larger consolidation before making a run at $42, but I’ll wait for a little more confirmation before drawing in the consolidation’s trend lines.
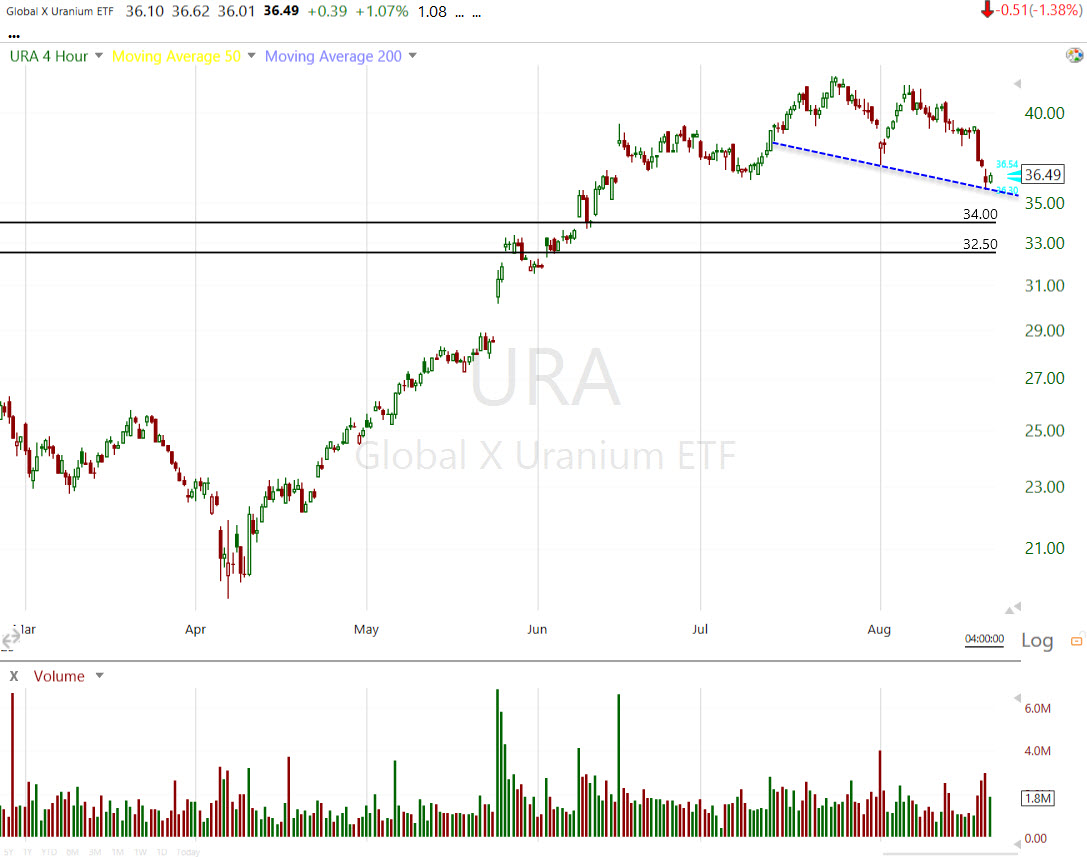
(4H) – The blue line is a hypothetical potential larger bull flag, but I haven’t drawn it in yet.
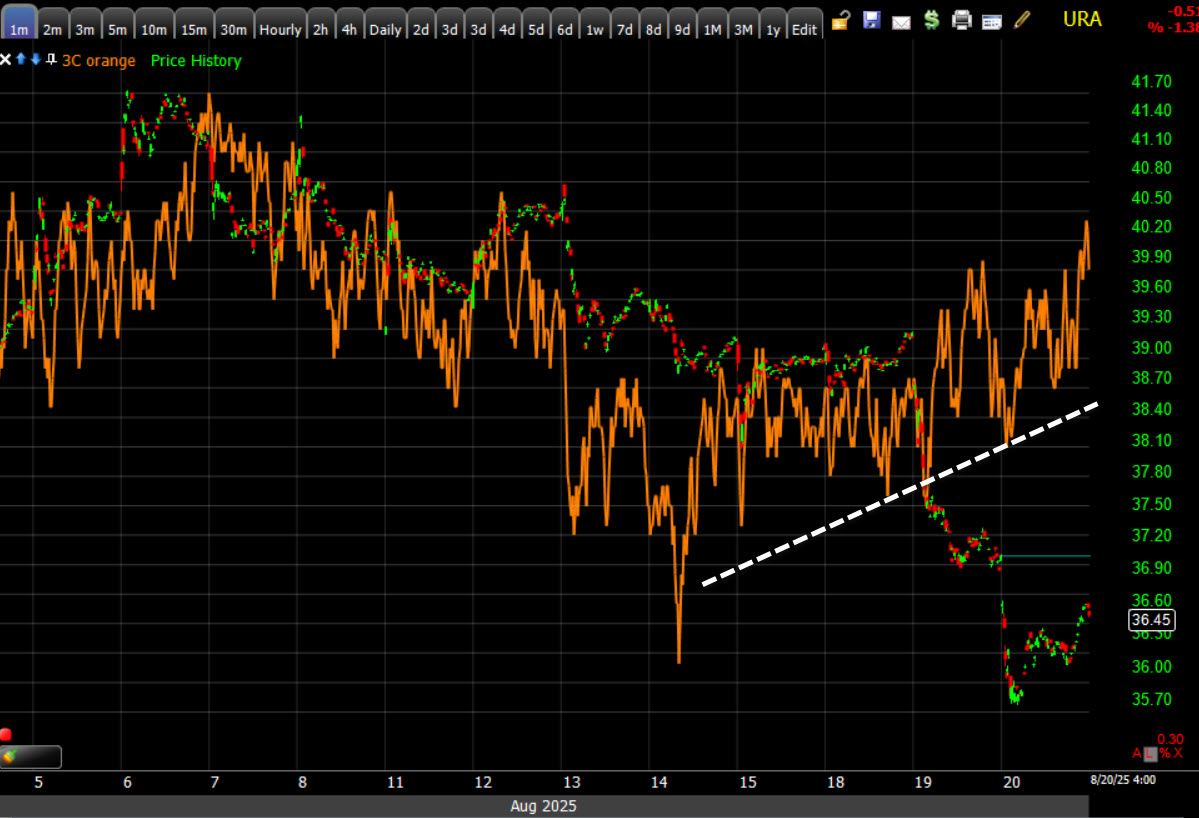
I’m not convinced the short-term price action is done pulling back yet, but 3C is showing some buying interest coming in recently.
 (1m)
(1m)
I understand the uncertainty of investing and trading and the desire to get as much information as possible, but I’d advise not to torture indicators to reveal insights that aren’t there. Most of the time, they’re silent. When they do signal, it’s unmistakable and leaps off the chart. Those are the high probability signals that are worth acting on.
Bitcoin (+1.25%) bounced back a little today.
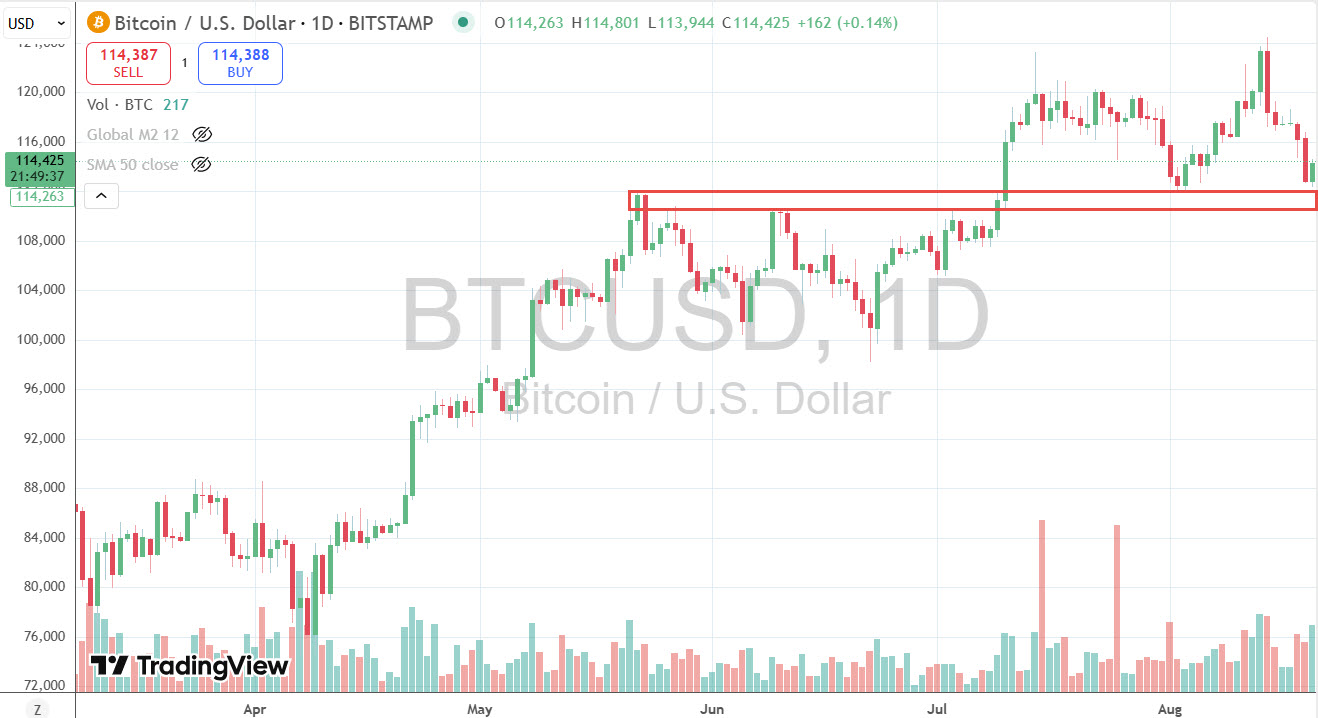 (daily) – I don’t love the failed breakout. There is a good zone of support here between $110k and $112k, but as you may have guessed, I prefer Ethereum. If this breaks under $110k, watch out.
ETH posted a nice +6.4% gain today…
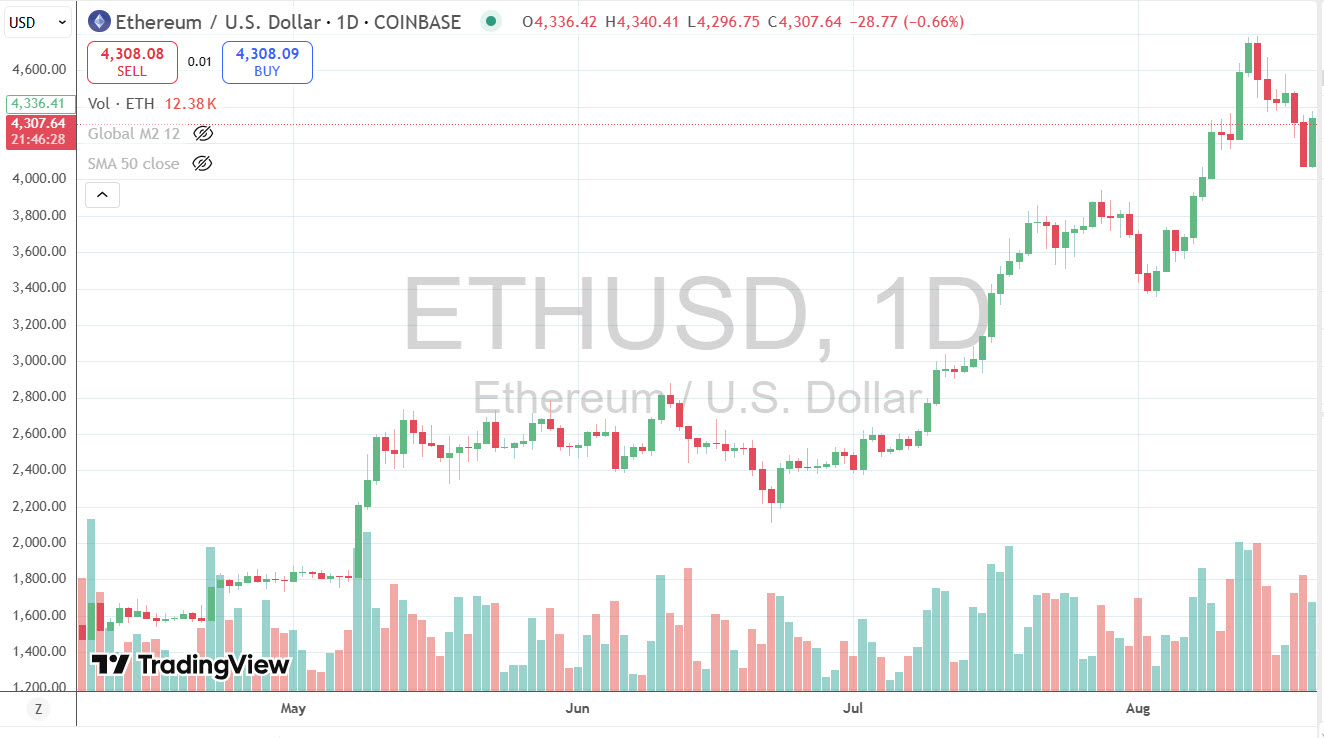 (daily) From a trend perspective there’s solid higher highs and higher lows and volume looks good.
Intraday,
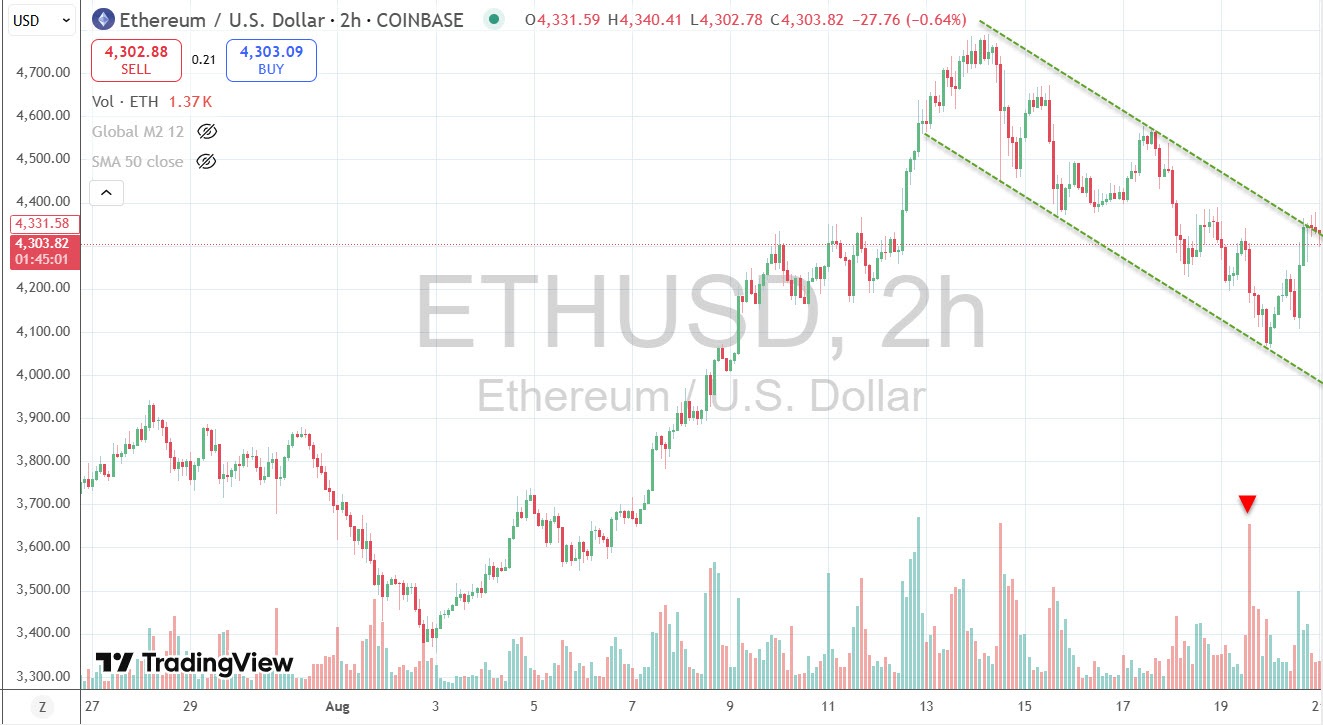 (2H) I’d say this is pretty close to a bull flag, it’s not perfect but cryptos don’t seem to consolidate all that well. I’m not crazy about the little spike in volume there but I’m not too worried about it either. Whether we call it a bull flag or not you can see pretty clearly where price needs to break out. It looks a heck of a lot better than Bitcoin.
Summary
My expectation on the July FOMC was that the committee was more dovish than what Powell portrayed in the press conference. The market took it that way too. We had two FOMC voters dissenting, both favoring a 25 basis point rate cut. I think it’s pretty natural and pretty reasonable to have expected the minutes from the July meeting this release this afternoon to have been more dovish than what Powell portrayed in the press conference. It turns out, Powell was pretty much right on with the committee’s thinking, at least the majority of the committee’s thinking. The minutes were a lot more hawkish than I expected.
The key takeaways were:
- Several participants said that the current Fed funds rate may not too much above the neutral rate.
- A few participants stressed that current demand conditions were limiting firms’ ability to pass tariff costs into prices.
- Many thought that tariff-related inflation would take some time to show up in the real economy, and several expected companies to pass on tariff-related inflation to consumers.
- A Majority thought inflation was a bigger concern than employment.
Given the horrendous Non-Farm Payrolls was 2-days after the decision, I’d assume the Fed had that information when they made their decision, so to still lean toward the inflation side of the mandate was much more hawkish than I expected.
It was around this time last year we were approaching the September FOMC, after a horrendous -818k downward revision to Payrolls, that the Fed cut rates not just by 25 basis points as the market expected a week before the meeting, but by a whopping 50 basis points. And do you remember what rates did in the aftermath? They jumped. And not by a little. The 10-yr yield rose over 100 basis points!
Some believe the Fed was playing politics with a whopper of a rate cut just before the November election. Some just think it was a policy error. Some think it was reasonable. We just had another really ugly jobs report so the market is pricing in a near certainty for a 25bp rate cut in September. Anything above 50% right before the FOMC, and the Fed very rarely disappoints.
The Fed uses the Jackson Hole Symposium to unveil policy pivots and clarify guidance, so expectations are high that Powell will make a dovish pivot and confirm the market’s expectations of a September rate cut. After seeing today’s minutes, I’m not so sure. Maybe a one-and-done? I just don’t think Powell is going to be as dovish as the market hopes.
Here’s what the market is pricing now…
- September -25bp @ 81.9%
- October is a coin toss @ 45.5%, down from 64.4% a week ago – that’s the hot PPI report.
- December is @ 35.3%, down from 54.4% a week ago.
While the Jobs data is arguably bad enough to warrant at least a 25bp cut, what is different than last September is inflation’s trajectory now vs. then. CPI had good and bad in it, and an argument could be made either way, but that argument shifts hawkish after PPI came out 2 days later.
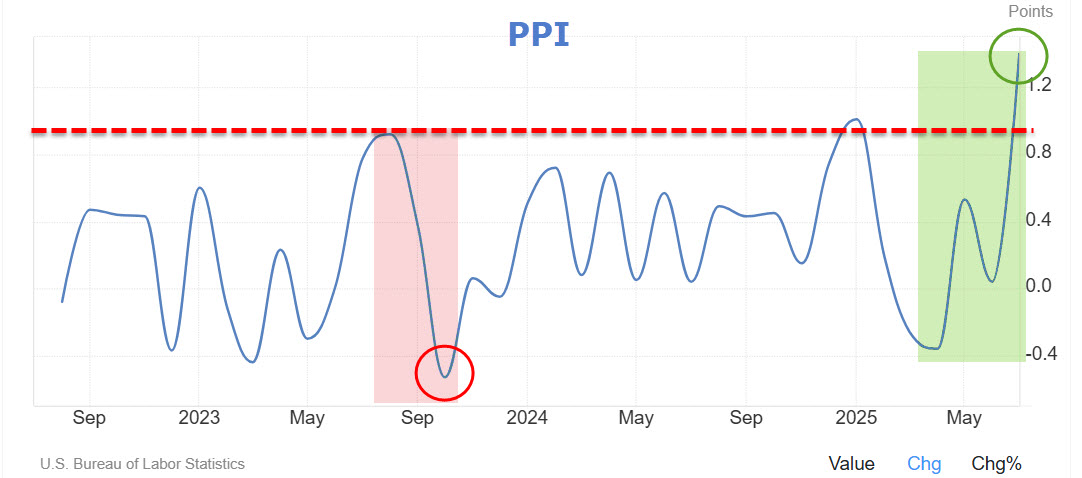 PPI last September was trending down, and now it’s spiking higher. When viewing economic data trends, you always have to think in terms of the rate of change, and this is a whopper than aligns with the start of tariffs.
It was a lot easier to cut rates last September with inflation trending lower. If the Fed was already leaning harder into the inflation side of their mandate at the July meeting, this isn’t going to help. I still have no idea what Powell will do, but with the market pricing in 82% for September, I think there’s a very real potential for the market to be very disappointed if Powell is hawkish or even neutral and doesn’t hint at a dovish pivot, and there’s good reason to suspect he might be hawkish.
Beyond Jackson Hole, there’s still another CPI and PPI report due ahead of the September FOMC meeting (Jobs report too). Powell may choose to remain cautious until that data is in.
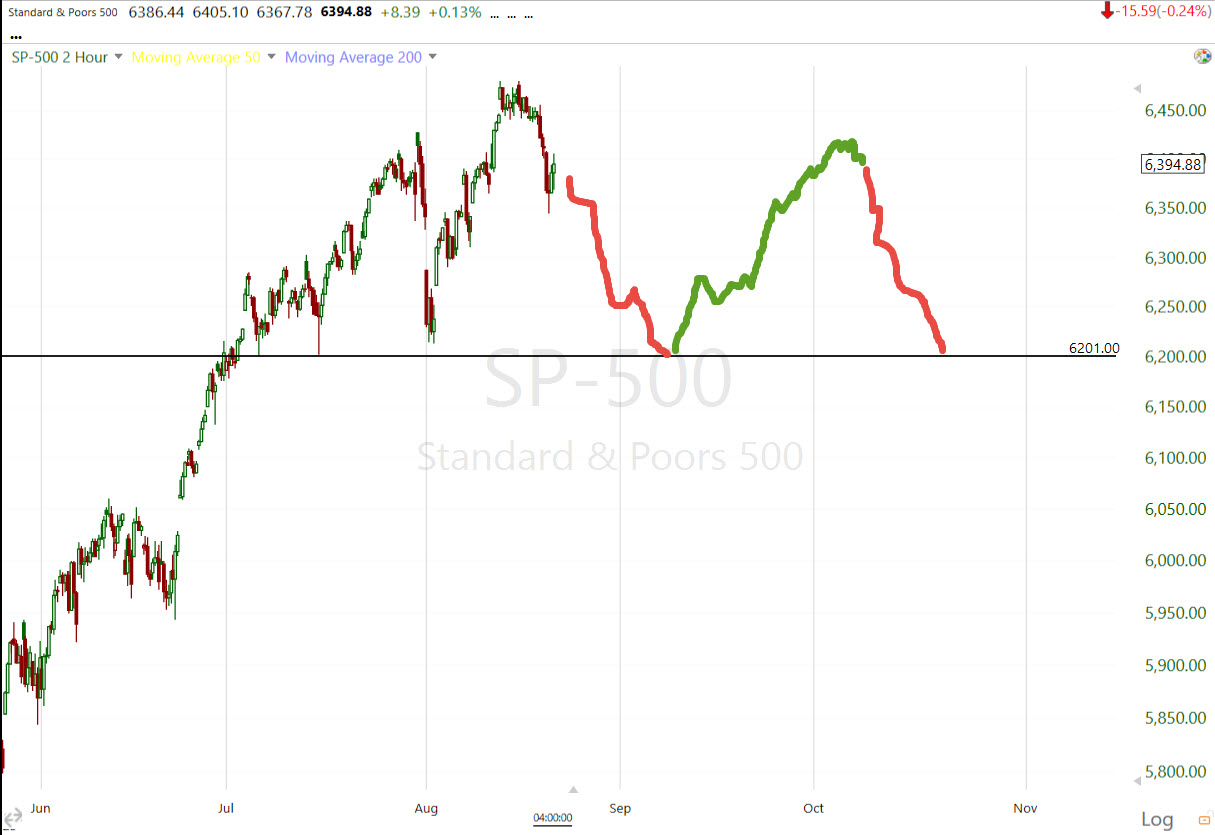
I see a lot of choppiness in market trends. What I alluded to earlier is equal lows or near equal lows showing up in the trend.
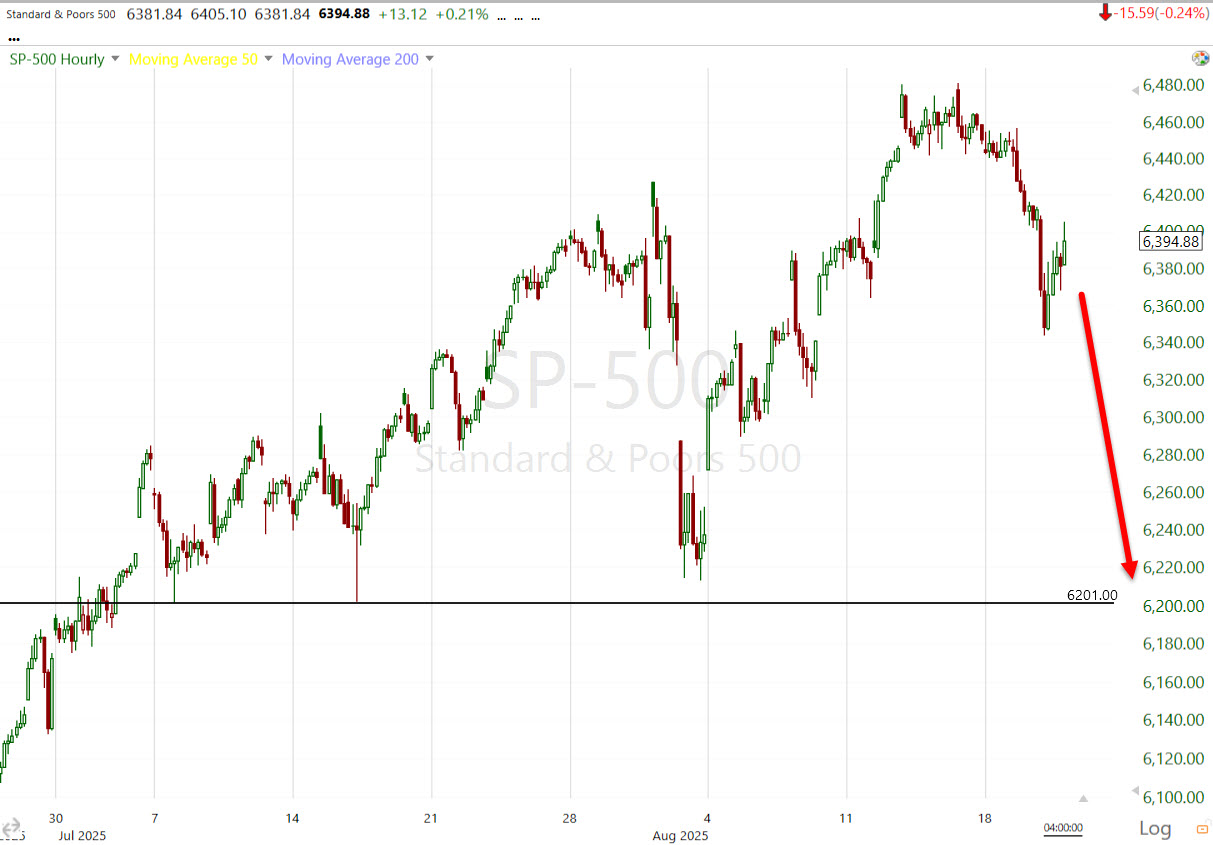 SPX (60m) – Ignore the red arrow for a minute and just look at the trend line near $6200. While we have higher highs in the trend, the higher lows are much less pronounced. As for the red arrow, what if Powell disappoints markets that are betting on a September cut and expecting more to follow? Yeah, a 3% loss down to the trend line is not unreasonable.
When I look at recent volume, this scenario is looking a lot like the SOX Index July of 2024. I forecast a H&S top in SOX right around this time in the price trend, well before I had any right to, but largely based on price/volume. If we look at SPY (volume is more pronounced)…
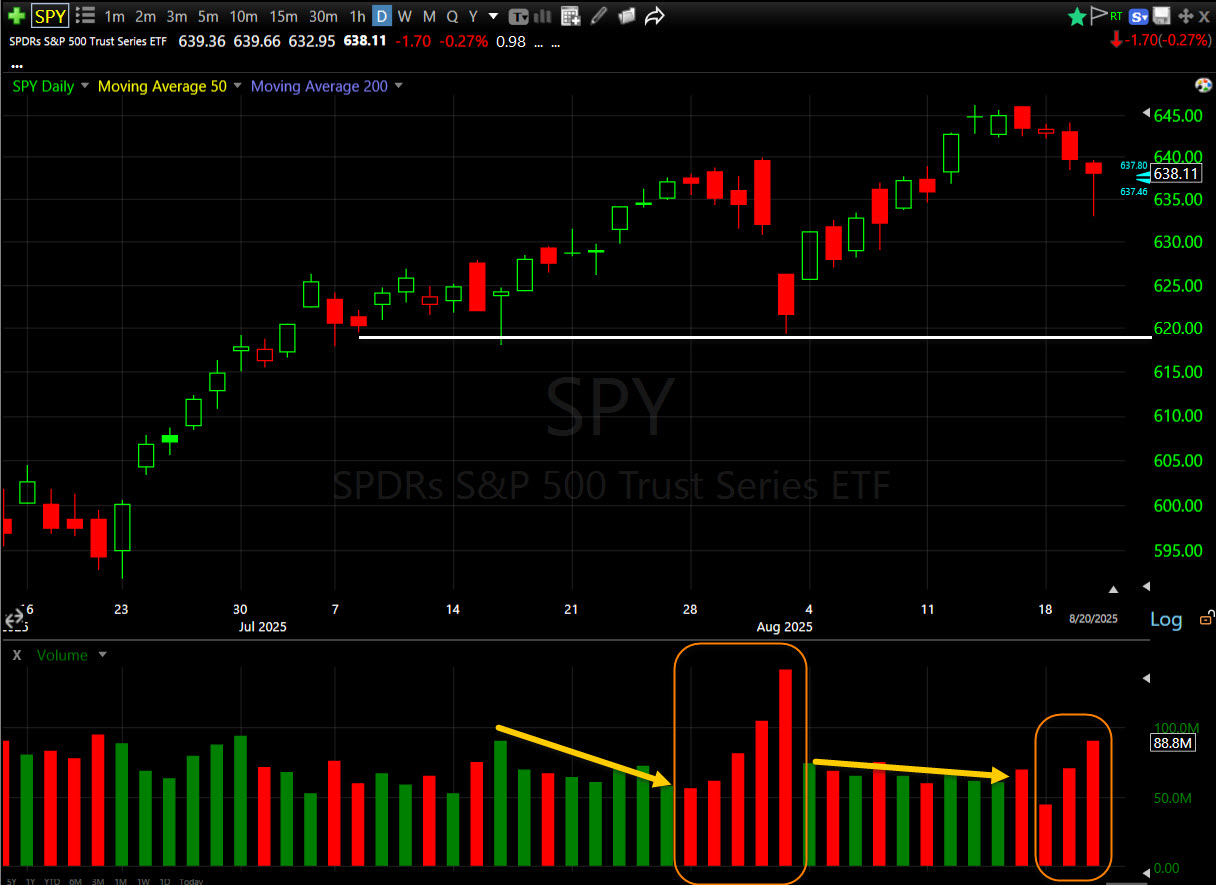 (daily) – I’m seeing the same trend that I saw in Semis back in July of 2024, volume is declining on price advances and increasing on price declines. The last one is a bit light because everyone is on summer vacation. This is not good. The price/volume trend is arguably more important than the quality of the price pattern in a H&S. This is exactly what led me to call a likely H&S in SOX last year way earlier than I had any right to.
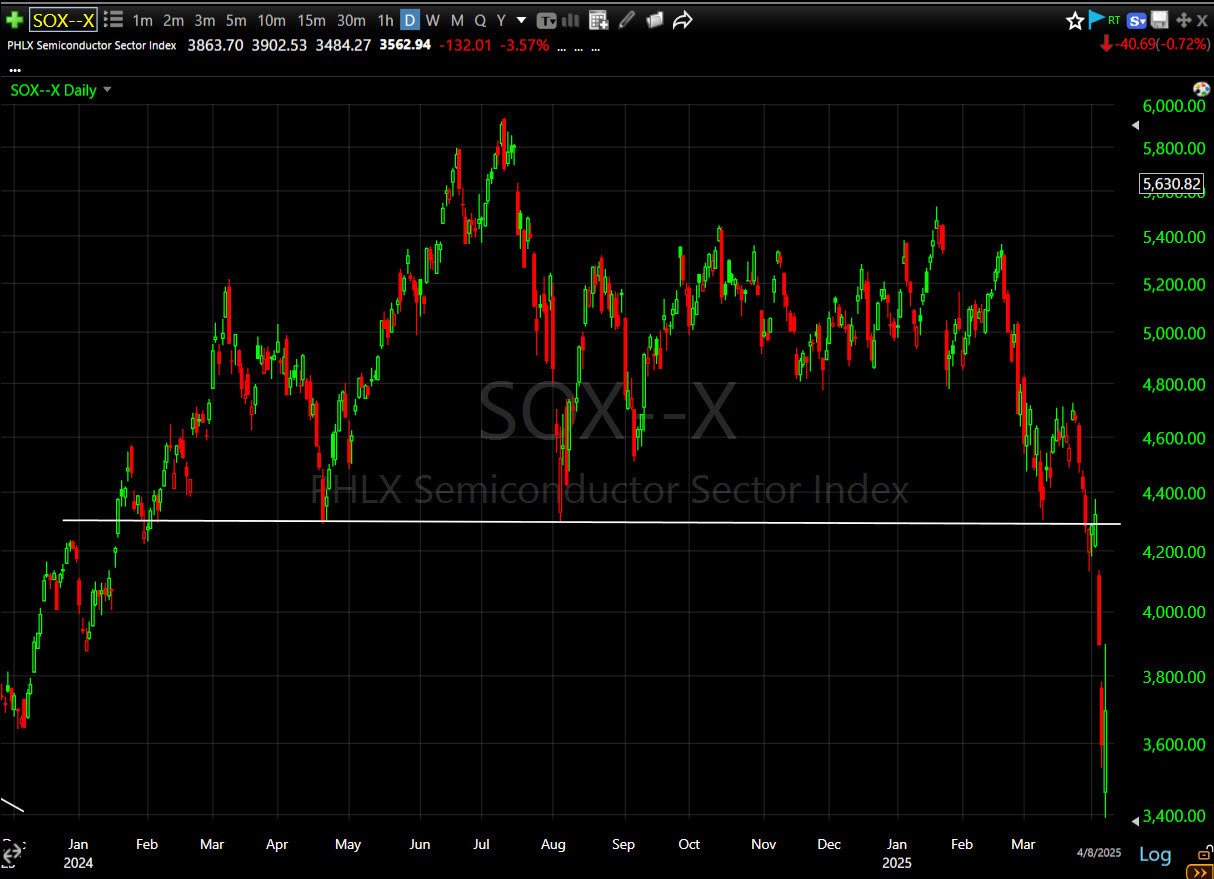 SOX H&S – It was right around the high in July that I started suspecting it, actually maybe even a little earlier than that. Price fell over -40% from that high, and that’s an index!
Nasdaq has the same thing going on, too…
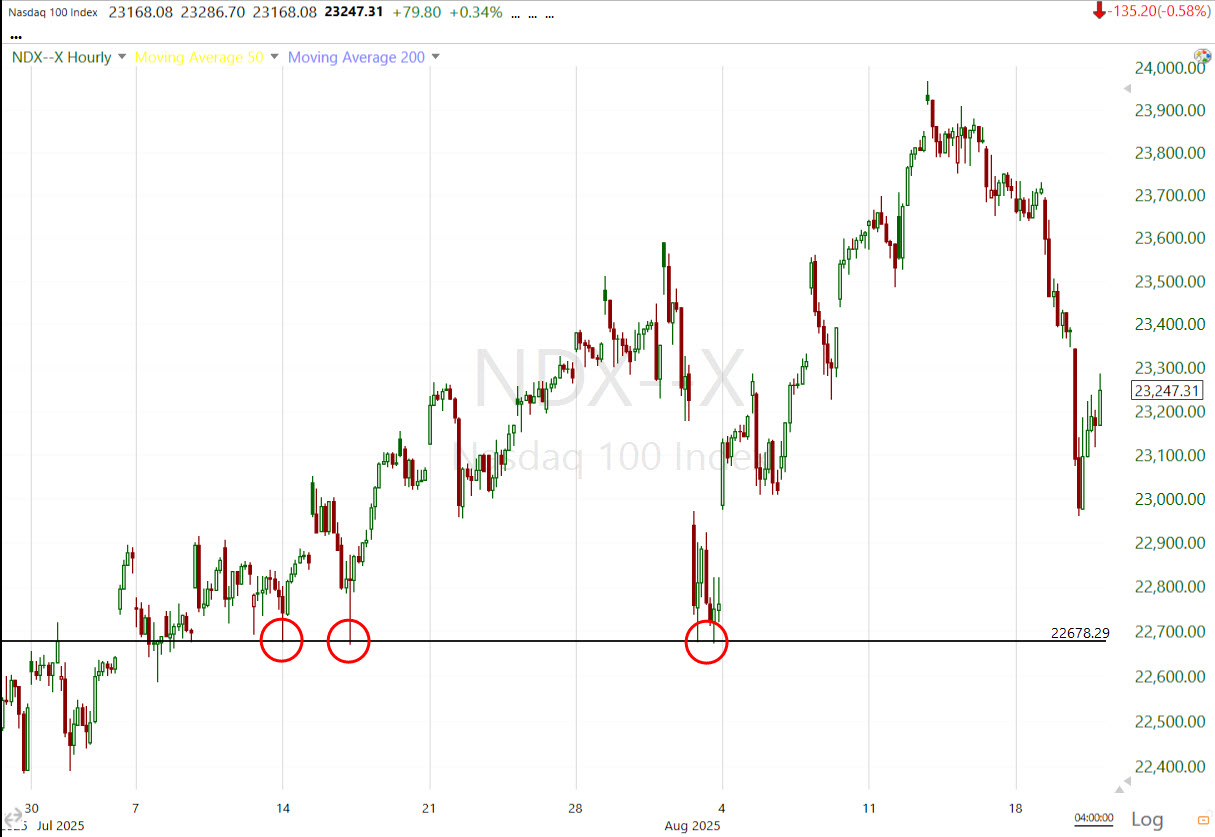 (60m)
(60m)
I feel like I’m getting a little ahead of myself, but let me just throw this out there. Price has a pretty predictable ebb and flow. It takes time for mass psychological sentiment to shift, and for that reason, many price patterns are very predictably proportional. If we play this exercise out…
 We could be looking at a serious break down in October, and I was conservative in drawing the pattern out.
We’ll see, but between the way Semis are acting, the way market breadth has been deteriorating, the questions arising in investors’ minds about the AI narrative’s glory, this strikes me as a very real possibility. Of course in this environment things can change 180 in a day. I believe we have chip tariffs of up to 300% coming up soon and who knows what else?
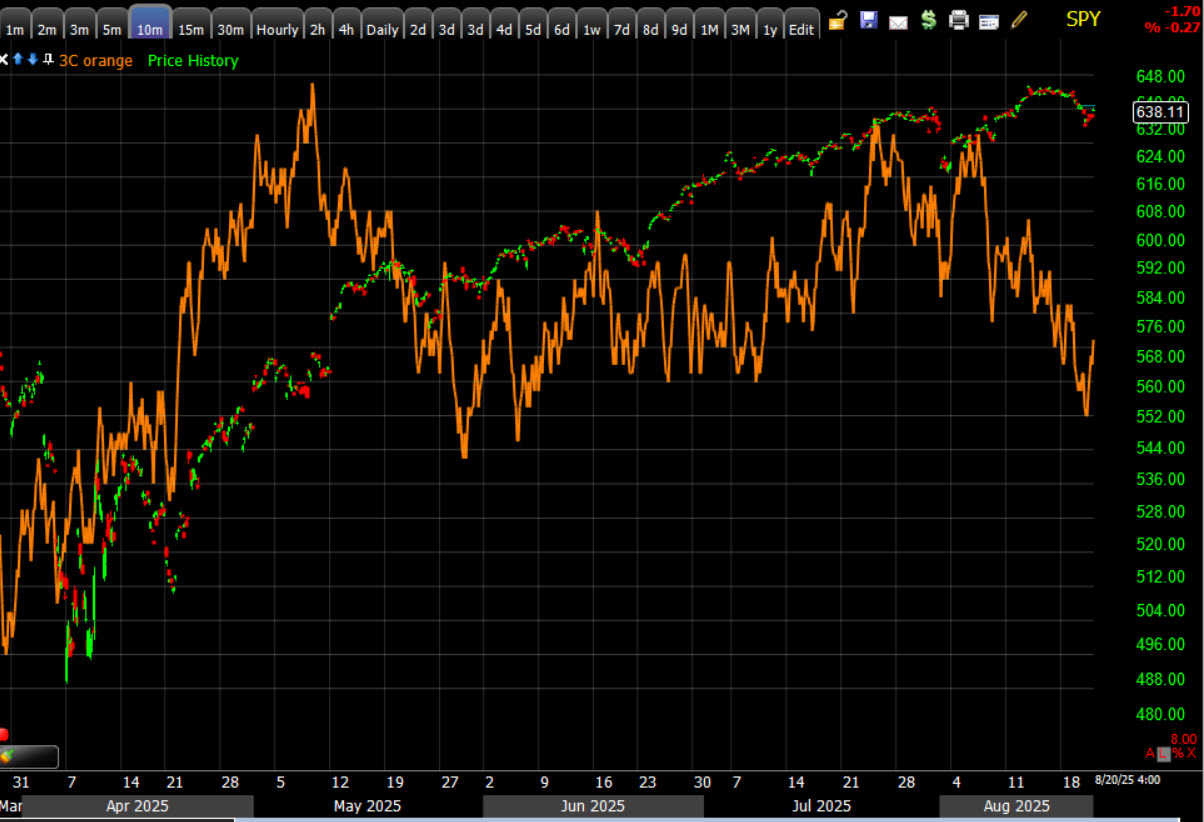 SPY (10m) – Here’s 3C’s long term trend, positively divergent at the April low, and huge money flow coming in off of that April 21st accumulation day, spiking 3C higher. Breadth was incredibly strong then too. Right now 3C is not saying, “no” to this scenario.
Just something to chew over.
Overnight
Overnight, S&P futures are very little changed at +0.05%. NASDAQ 100 is up 0.1%, while the Dow and Russell 2000 are flat.
The US dollar index is up about 0.1%.
WTI crude oil futures are up 0.5% to $63. I see a little spike. I’m assuming there was some bad news on the Russia Ukraine negotiations tonight.
Gold futures are down 0.1% to $3385.
Yields are flattish.