***This is a subscriber post from Wolf On Wall Street Trade. Subscribe here at 2008 rates before we move to the Technical Take & its Discord Room, yo can save money by subscribing now before the move to The Technical Take.
To have context as to why the stock market is acting so badly, see my recent videos: The Stock Market’s Stranger Signals ; Stock Market Update and the most recent, Stock Market Follow-Up Report
Here’s the intraday Members’ post…
Economic data today is mixed.
- S&P Global’s ‘soft’ surveys soared in the US (as European PMIs slipped lower). The Manufacturing PMI fell to 49.5 (contraction) from 51.6 (51.6 consensus). The Services PMI accelerated to 56 from 55.3 (54.9 consensus). On the inflation front, from S&P Global: “the July survey saw input costs rise at an increased rate, linked to rising raw material, shipping and labour costs. These higher costs could feed through to higher selling prices if sustained, or cause a squeeze on margins.”
- After a disappointing Existing Home Sales for June, New Home Sales confirmed the slowdown, dropping -0.6% MoM (below the 3.4% MoM consensus) and also saw a major downward revision in May from -11.3% MoM to -14.9% MoM. That leaves new home sales down -7.4% YoY. The median new home price rose in June, but it remains below the median existing home price we saw hit a record yesterday. Homebuyer confidence has collapsed to an all-time record low.
The earnings bar was indeed higher this quarter. And those unusual signals from volatility and other places like 3C, did matter.
A sharp loss in Tesla (TSLA -10.3%) after its relatively disappointing earnings report has contributed to the downside bias.
Alphabet (GOOG -4.6%) is another influential laggard following its earnings report. Other mega cap stocks trade sharply lower, weighing on the broader market. Recall the many bear flags in price in mega-caps shown in the weekend video and here ever since?
As for the averages, NASDAQ-100 is the worst, but selling picked up in small cap stocks too.
SP-500 -1.7%, Dow -0.8% (Transports -0.2%), NASDAQ-100 -2.8%, Small Caps -0.6%
With regard to the S&P’s neck line that was troubling me, as I wrote last night, sometimes you just need to give price a little time and it sorts itself out. That’s the case with the S&P today.
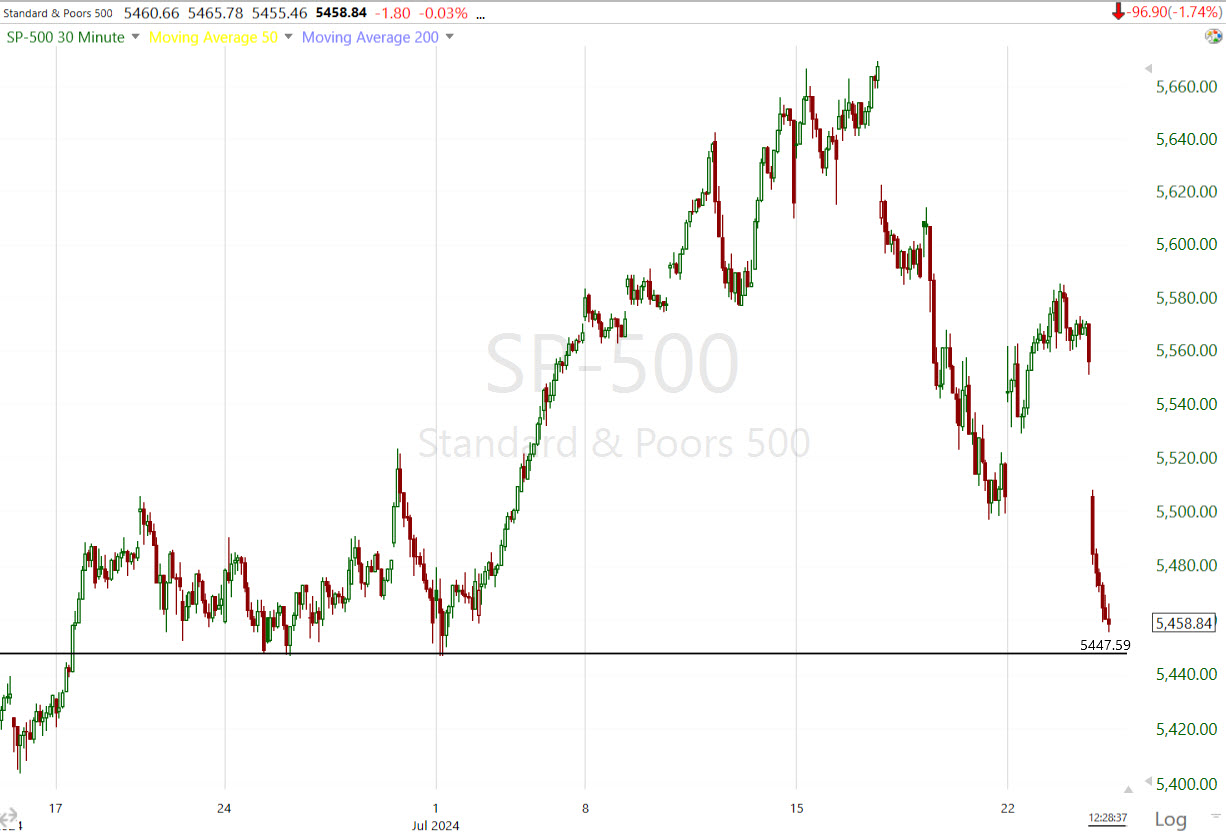
SPX (30m) coming right down to the neckline that made sense to me.
The DJIA broke the bear flag, and sits at the prior record high that quickly failed, as support for now.
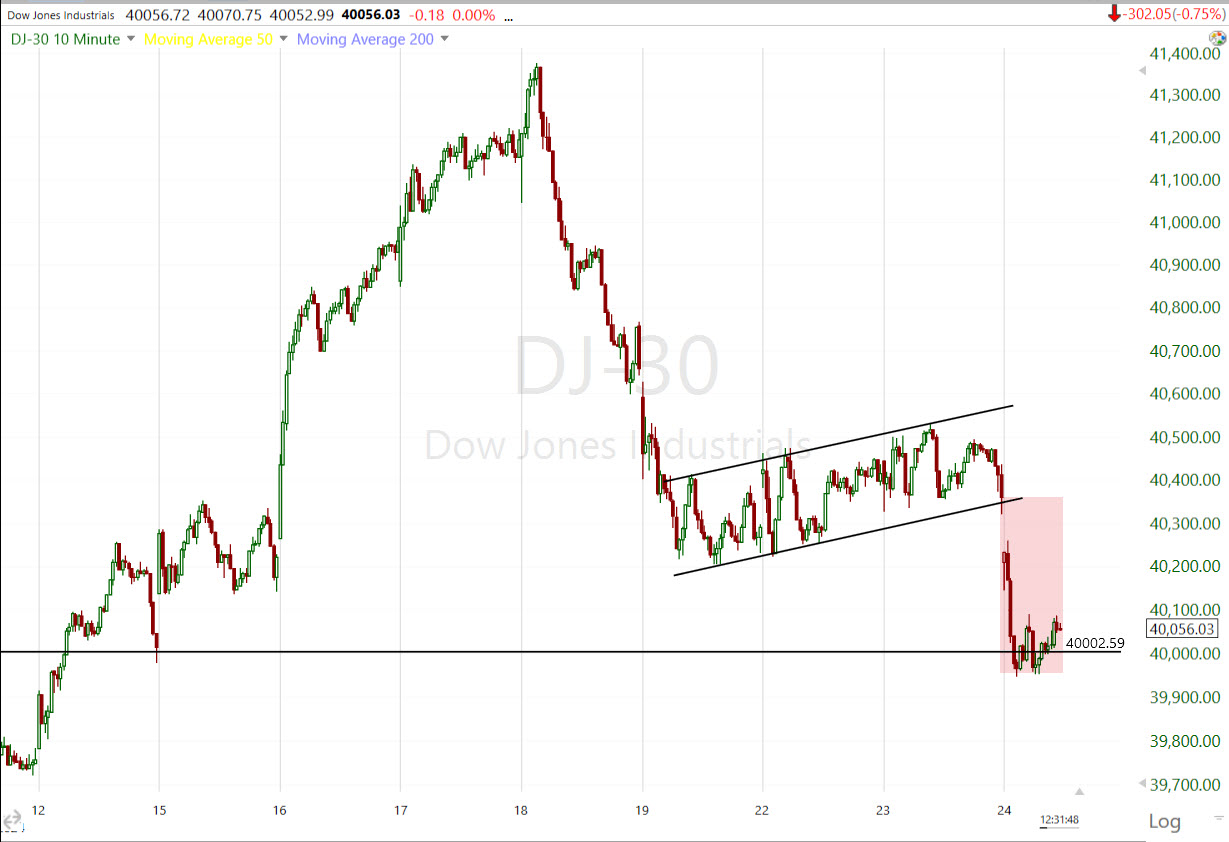 DJIA (10m) – the prior record high is at the trend line.
Dow Transports sit in the zone of support, under the bear flag, looking like they may back-test the bear flag.
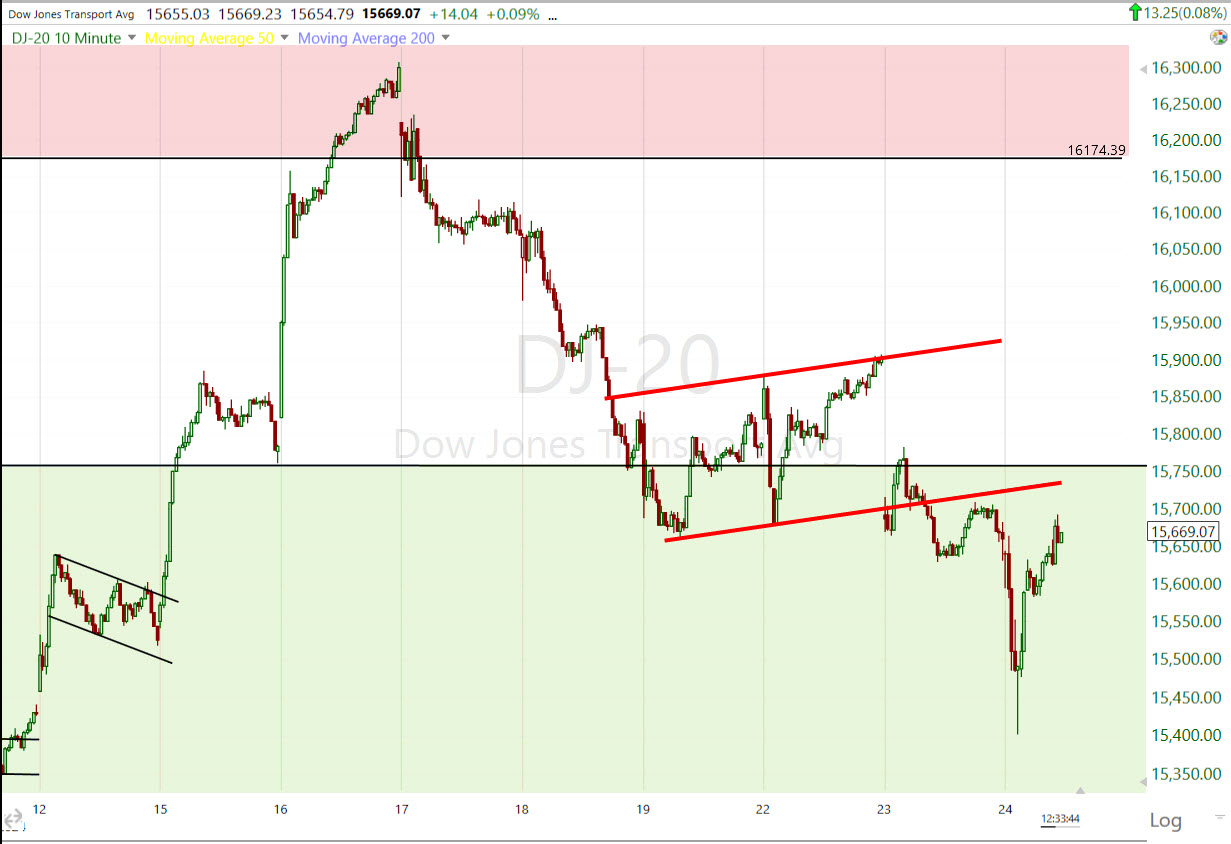 Transports (10m)
While the S&P’s pattern straightened out, we have to reassess the NASDAQ-100’s.
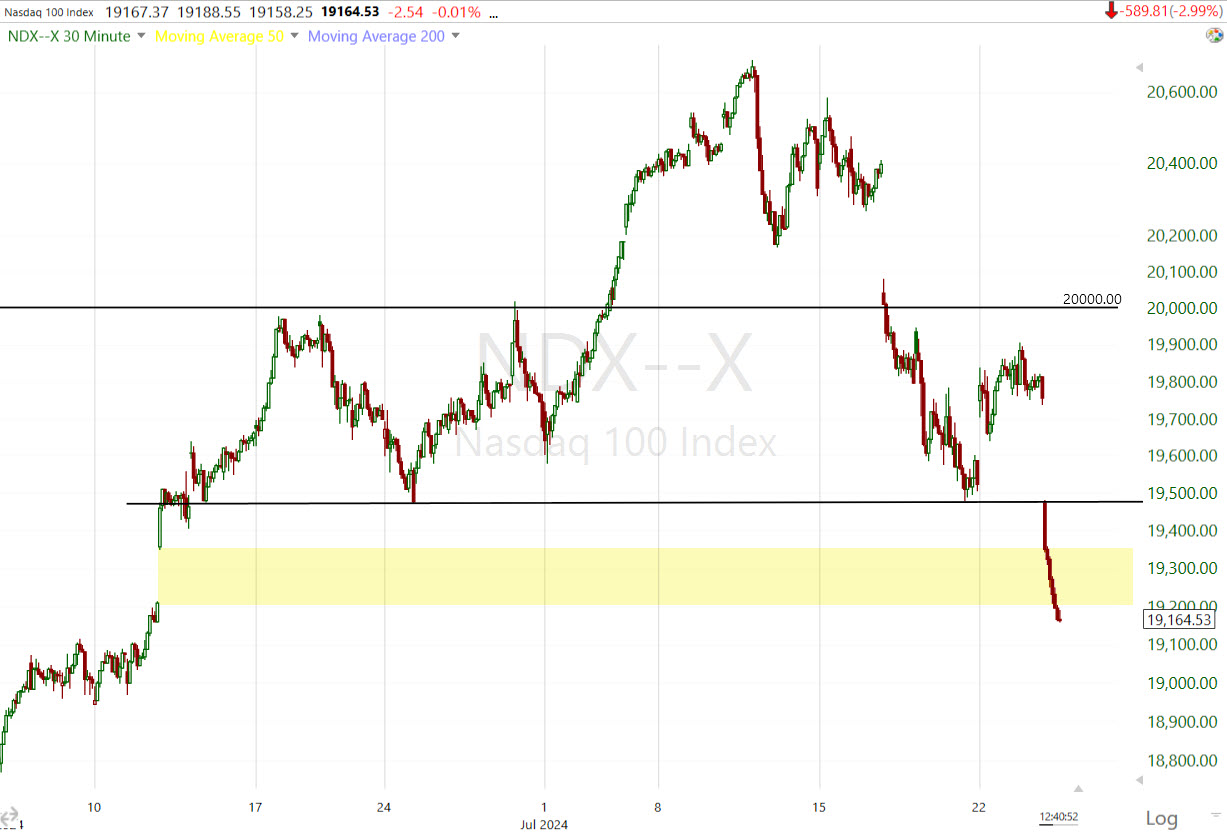
NDX (30m) -price blew right through $19,500 and filled the gap from June 12th. We’ll figure out what this is and what it means for the big-picture measured move later, for now though, it certainly smells like CTA trigger levels (at least the short-term trigger) has been hit and they’ve unleashed the flood of selling.
I’ve long said that if mega caps are sold, Small Caps won’t be able to offset the weight of their selling, and just as a rising tide lifts all boats, when the water flows out of the harbor, it leaves all boats sitting on the sand. What we’re not seeing today is money coming out of mega-caps and rotating into small caps.
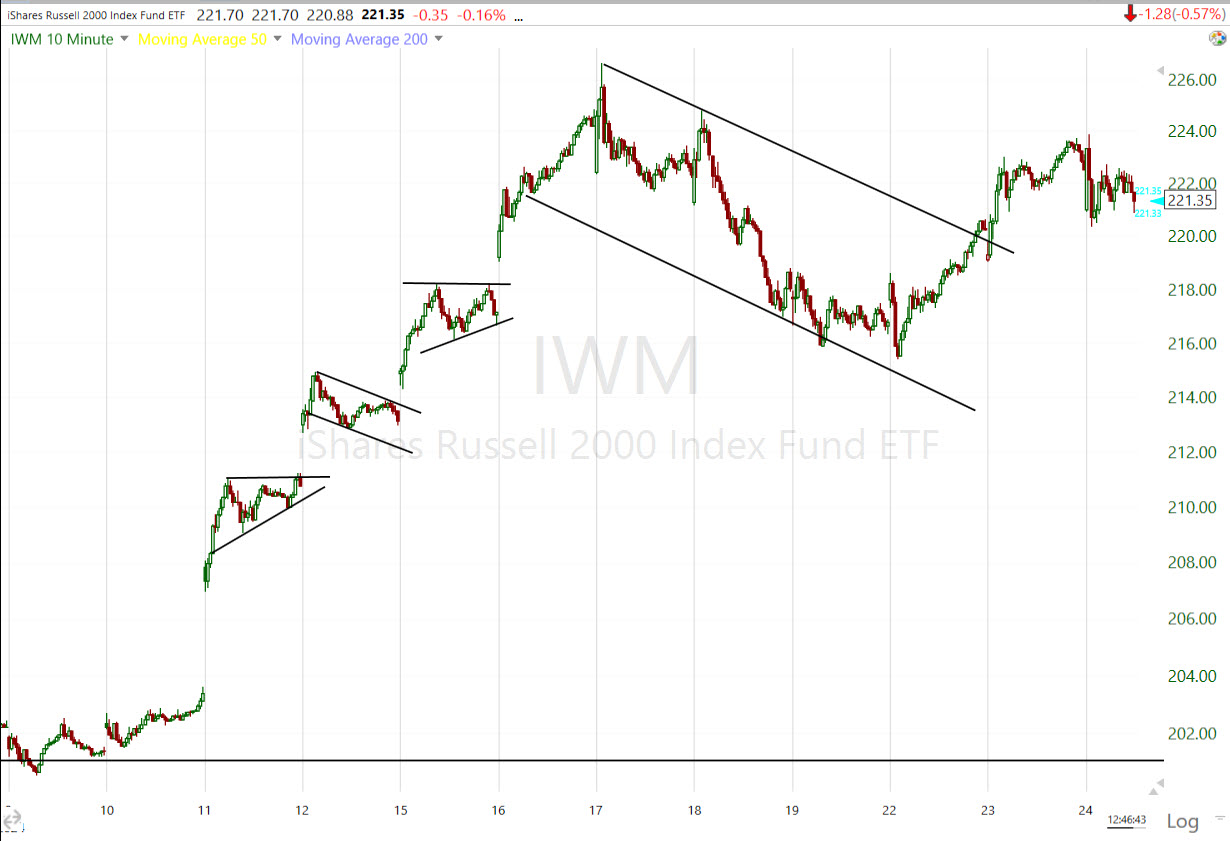 IWM (10m) – This isn’t a failed breakout of the bull flag yet, but for a flag this big and a preceding rally that strong, this is not what a second leg up should look like, it should be vertical like the preceding trend leading to the flag consolidation.
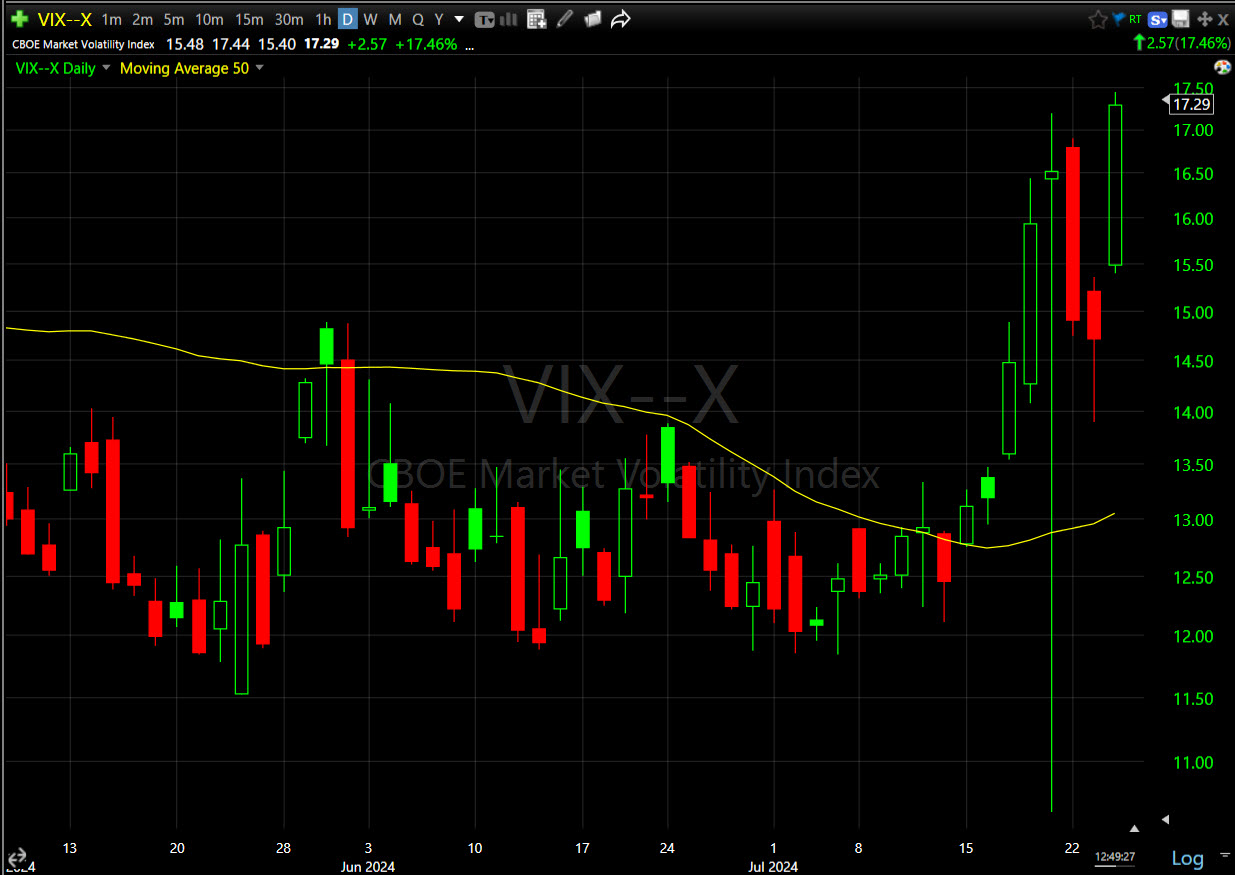 VIX (daily) and 50-day. Another consideration is most professional money managers/institutional money risk management ( and part of CTAs rules) requires them to de-leverage long equity positions when volatility rises, creating a self-reinforcing feedback-loop.
4 of 11 sectors are green, and if it stays that way, it’s unlikely we’ll get 1-day oversold internals. The leaders are mostly defensive – Utilities (+1.3%), Healthcare (+0.8%), Real Estate (+0.1%) and the Energy sector (+0.25%).
The worst performing are as you‘d imagine, the three mega-cap heavy sectors – Technology (-3.2%), Consumer Discretionary (-3.2%) and Communications (-2.1%). Industrials (-1.2%) are taking a hit too.
The mega caps (MGK -3.2%) underperform the S&P Equal Weight Index (-0.55%) by a massive 265 basis points (CTAs!).
Semis (SOX) are down -3.85, which means they’ve blown through the 50-day.
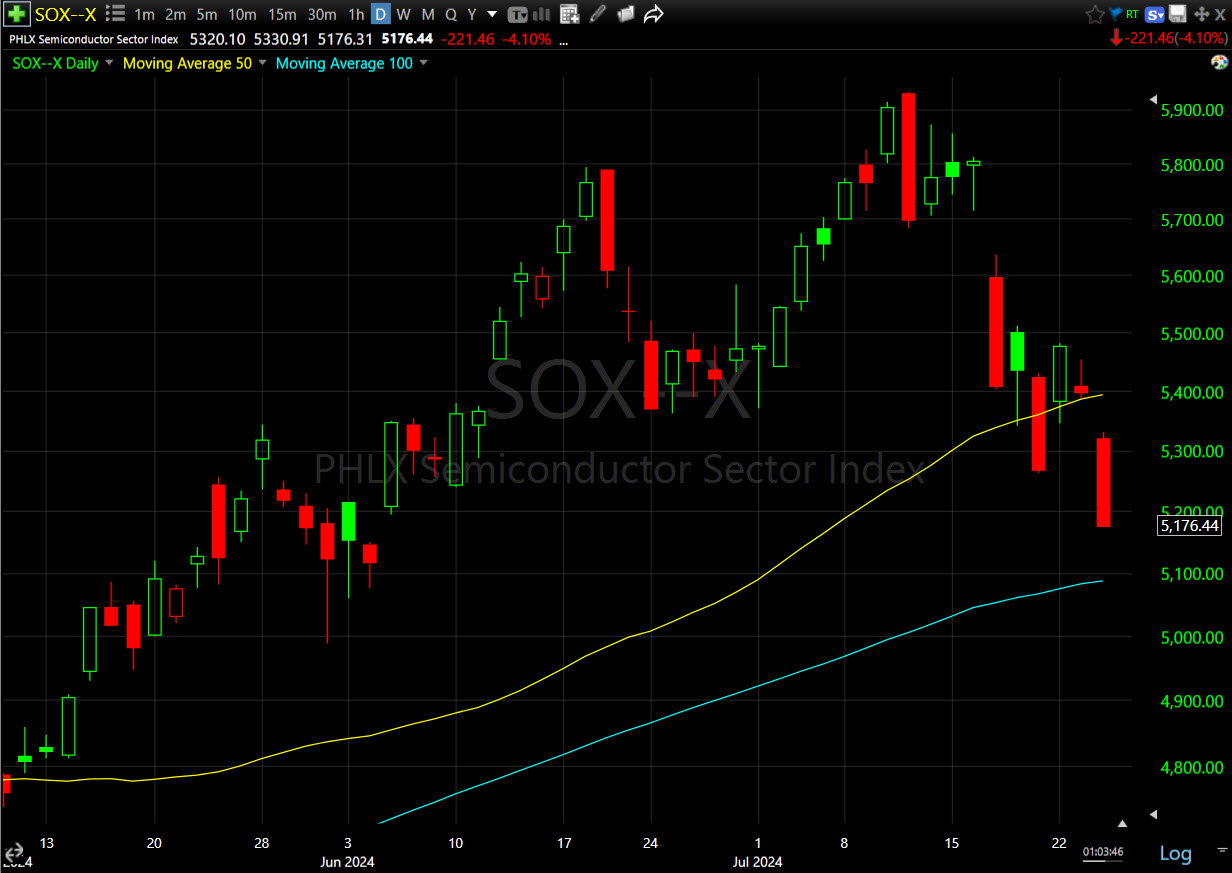 SOX (daily)
Visa (V -3.2%) is another laggard, sparking growth concerns after Visa mentioned a slowdown in spending by lower-income consumers.
While decliners have a hefty edge over advancers, it’s not 2-to-1 so again it looks unlikely that we get 1-day oversold internals, which means there’s a higher risk of follow-through selling tomorrow.
The 2-yr yield is unchanged at 4.40% and the 10-yr is up +1 bp at 4.25%.
The U.S. Dollar Index is down -0.2% (growth concerns).
The official DOE inventories data confirmed API’s across-the-board draws with crude stocks down for 4 straight weeks and a large gasoline draw too.
- Crude: -3.74 mln.
- Cushing: -1.71 mln.
- Gasoline: -5.57 mln. – the biggest draw since March
- Distillates: -2.75 mln.
WTI is extending gains on the draws and yesterday bounce off the 200-Day. WTI crude oil futures are up +1.3% to $77.95/bbl.
Gold is up +0.4% and thus far, although still early, it’s looking like a bear flag.
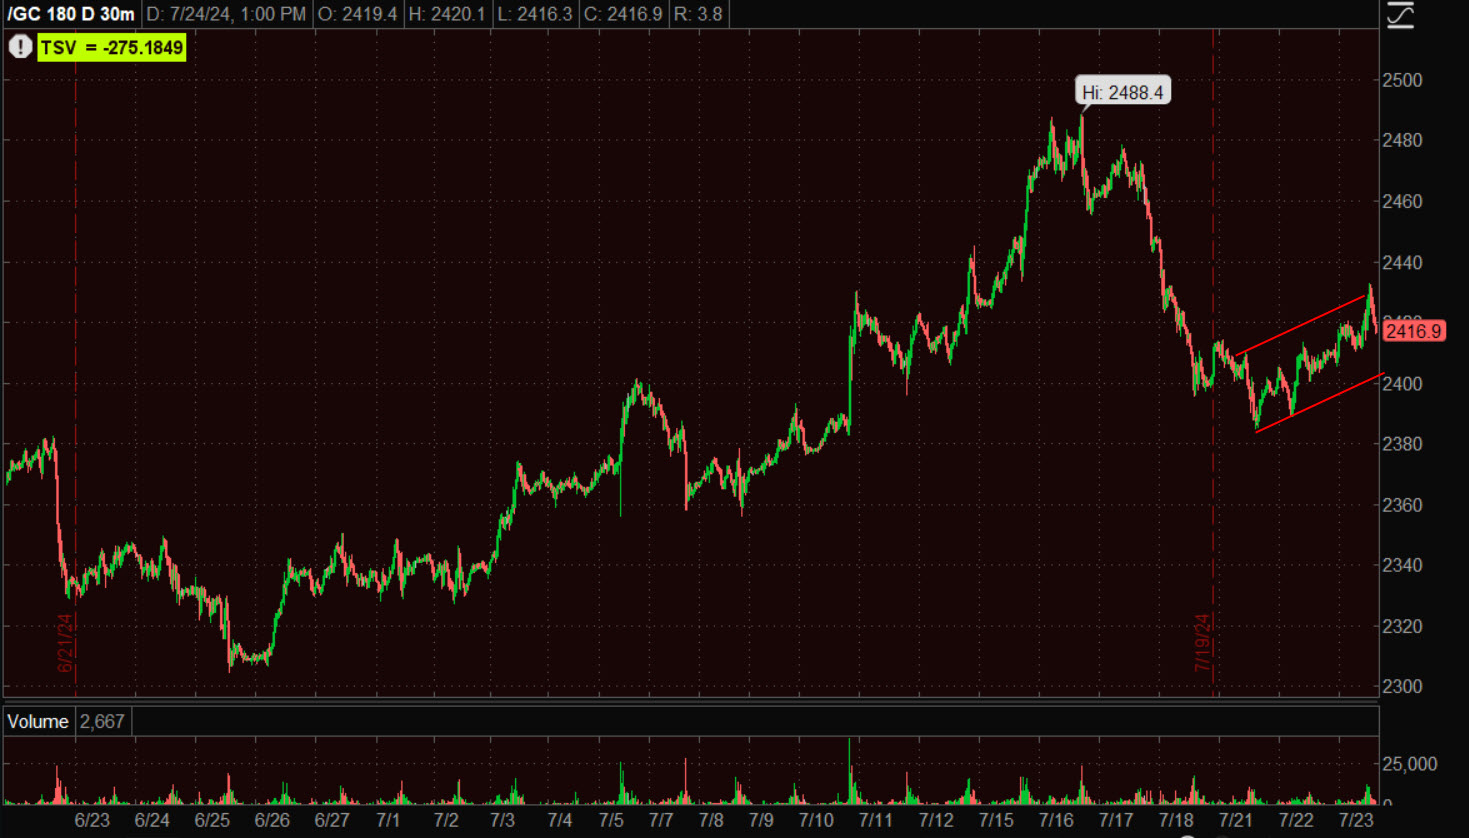 Gold (30m) – If that continues to be the case, then a test of $2300 looks increasingly likely.
Bitcoin is up +0.9%, that doesn’t change anything for price action
3C…
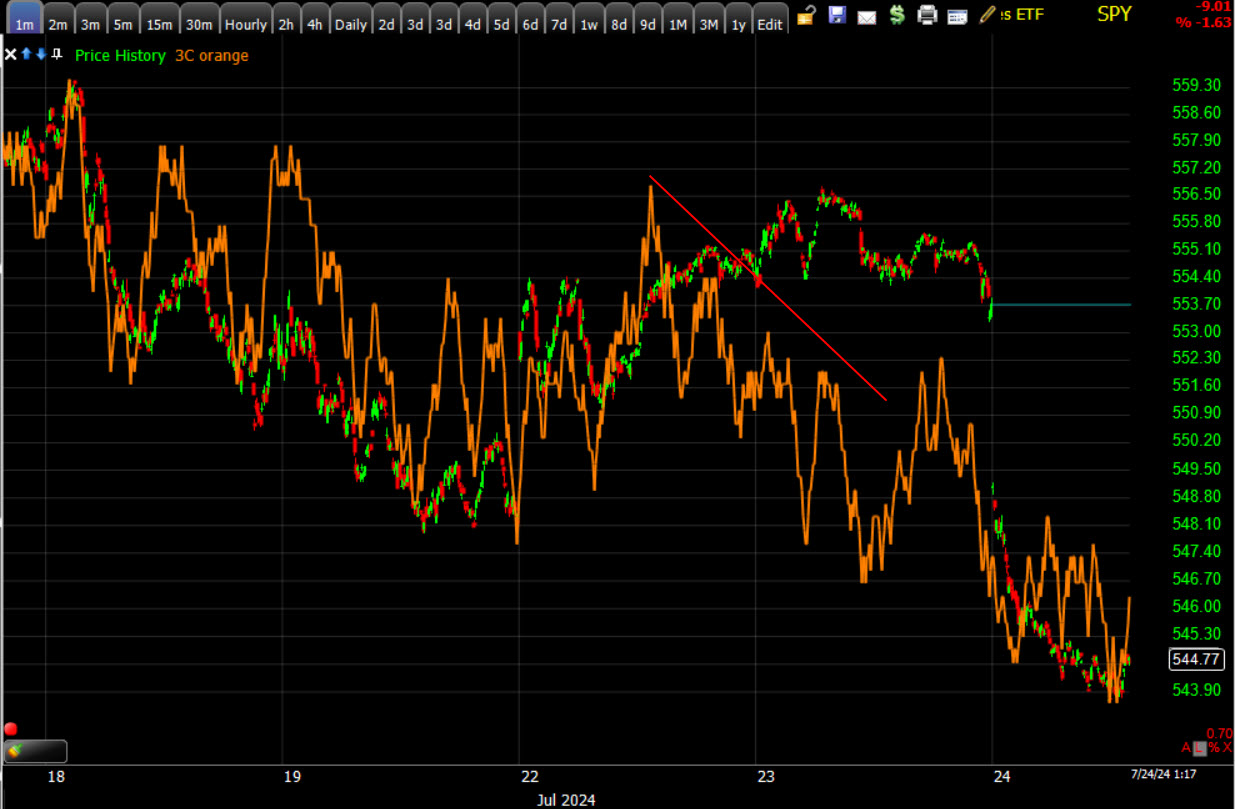 SPY (1m) It seems that late day weakness in 3C yesterday was for good reason.
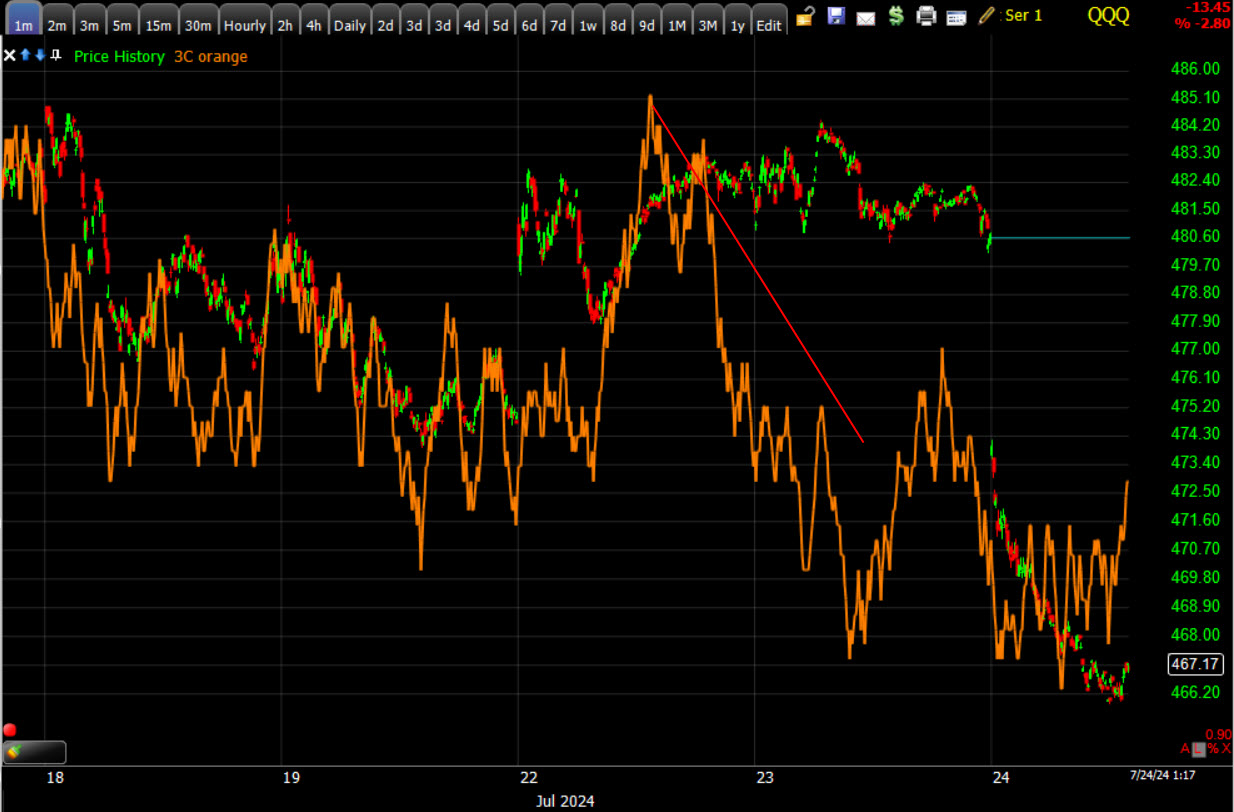 QQQ (1m) Same for QQQ.
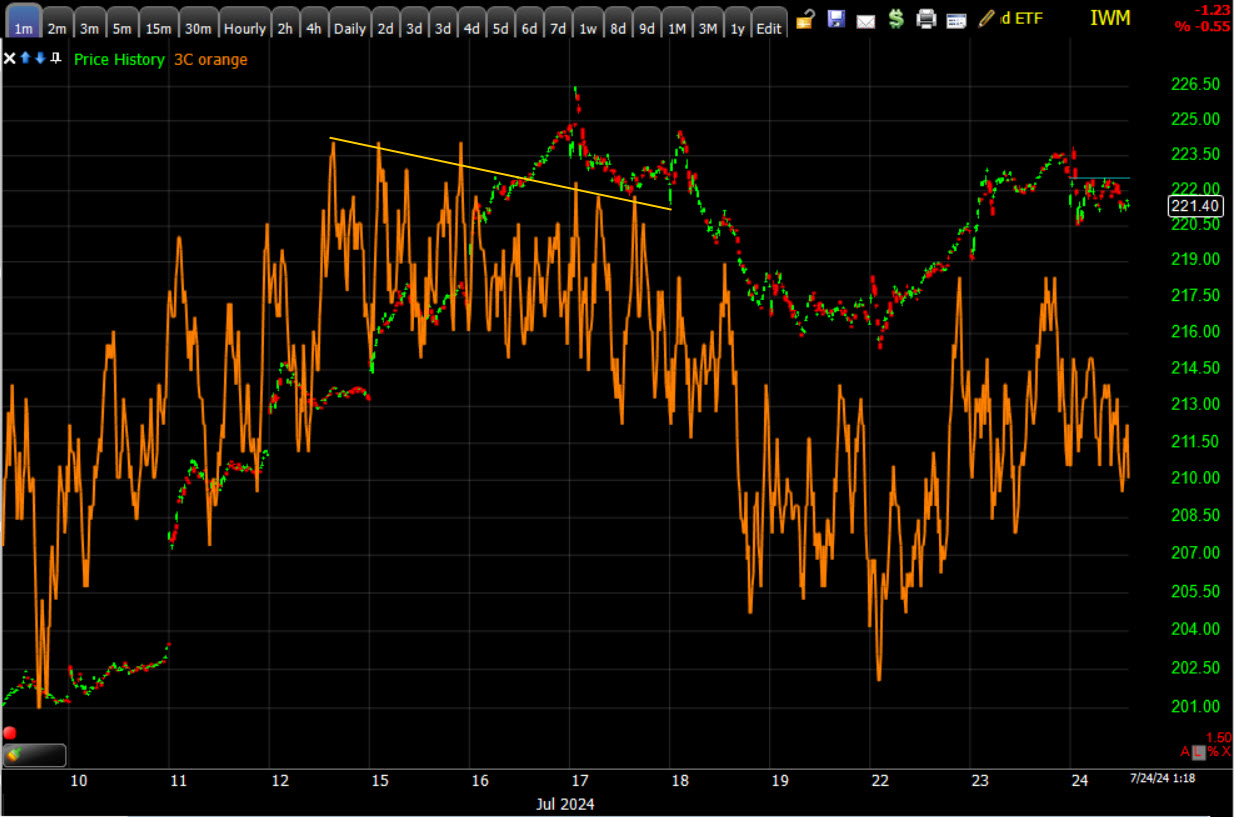 IWM (1m) is still “weak” in-line, but this is not what we should see on a breakout from a big bull flag. 3C should be leading price higher.
There’s some real damage to the trend charts of the cap-weighted indices…
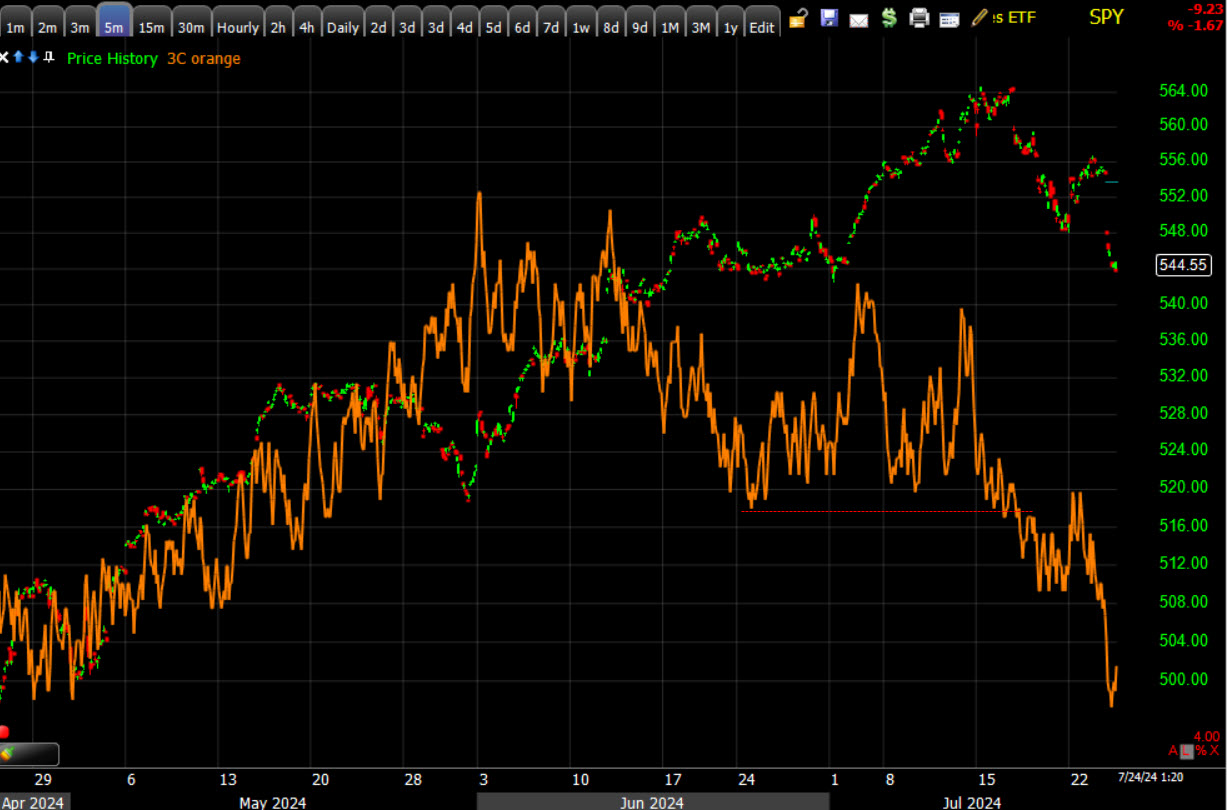 SPY (5m) has seen 3C break to a new leading negative low
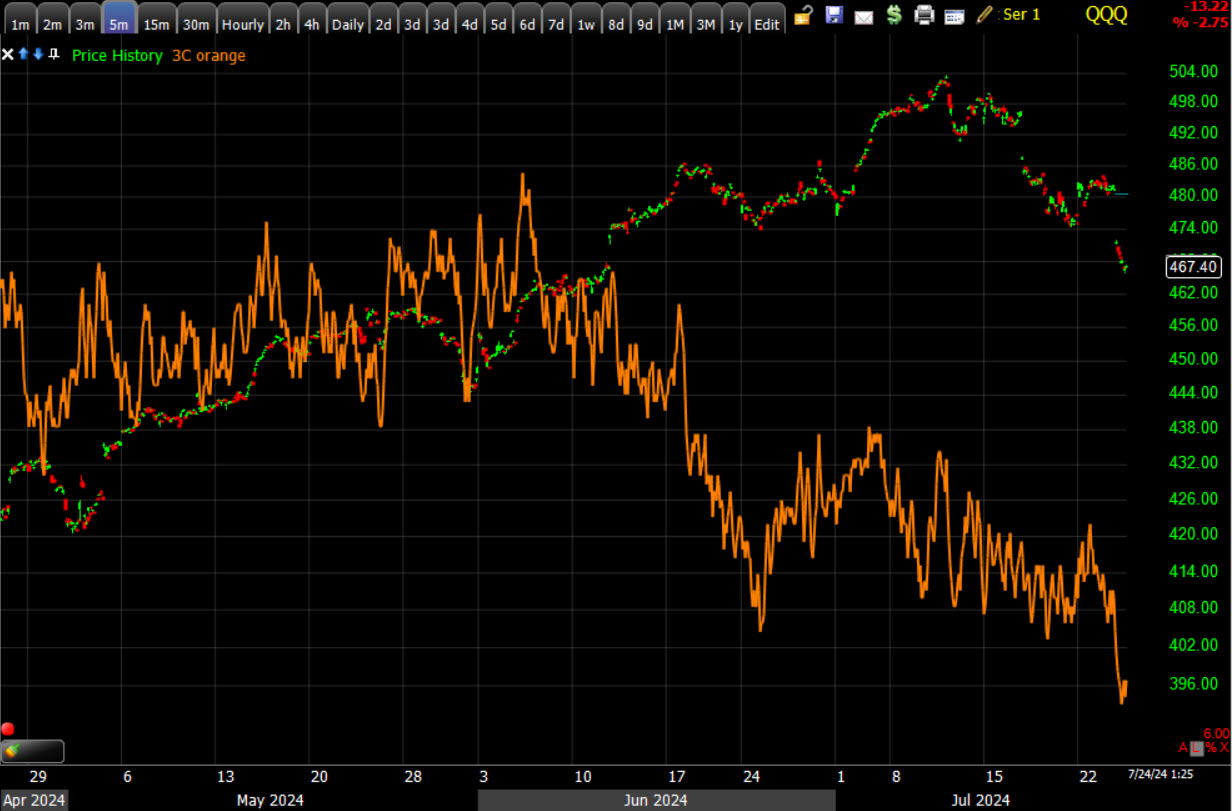 As has QQQ (5m)
Intraday, however, it looks like NASDAQ is trying to find a low with some bargain hunters sniffing around.
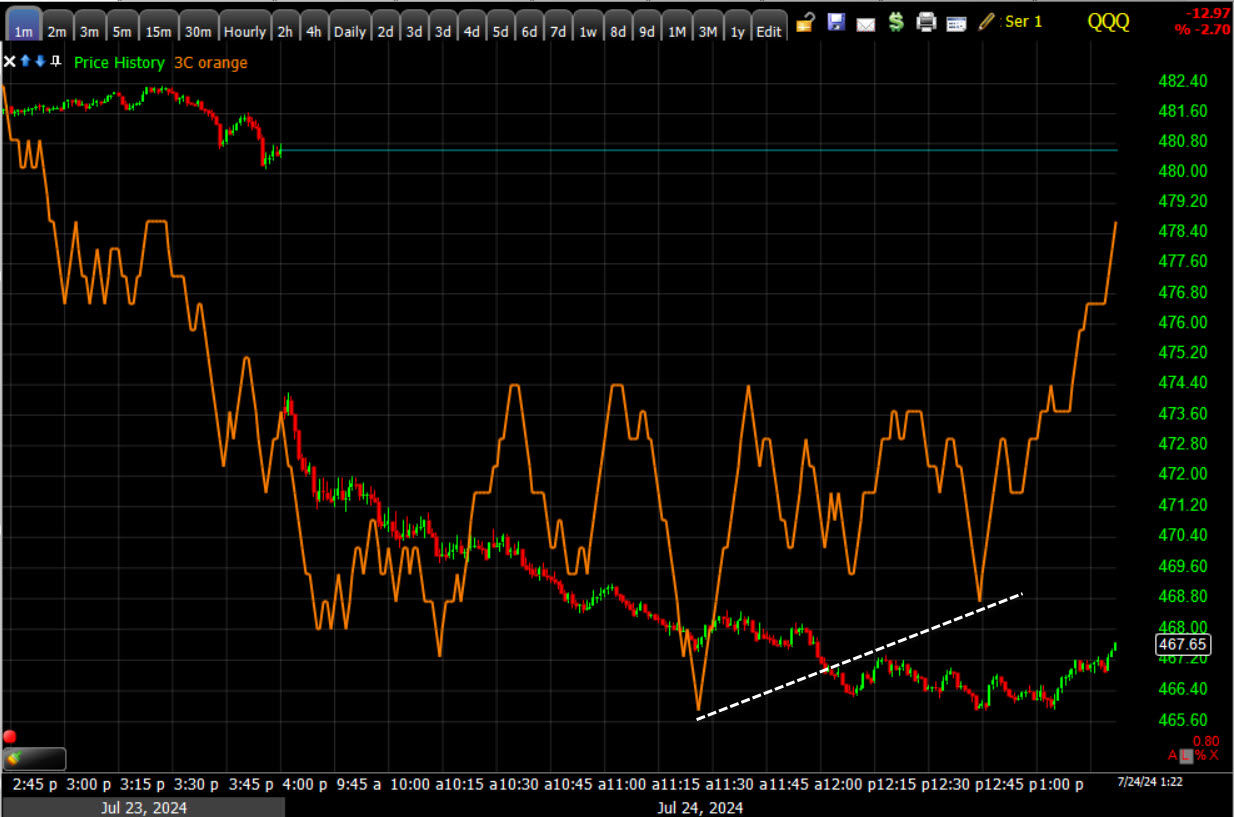 QQQ (1m) intraday
We’ll see if they gain some traction. I’m not seeing the same in the S&P yet.