Considering today’s stock market developments…
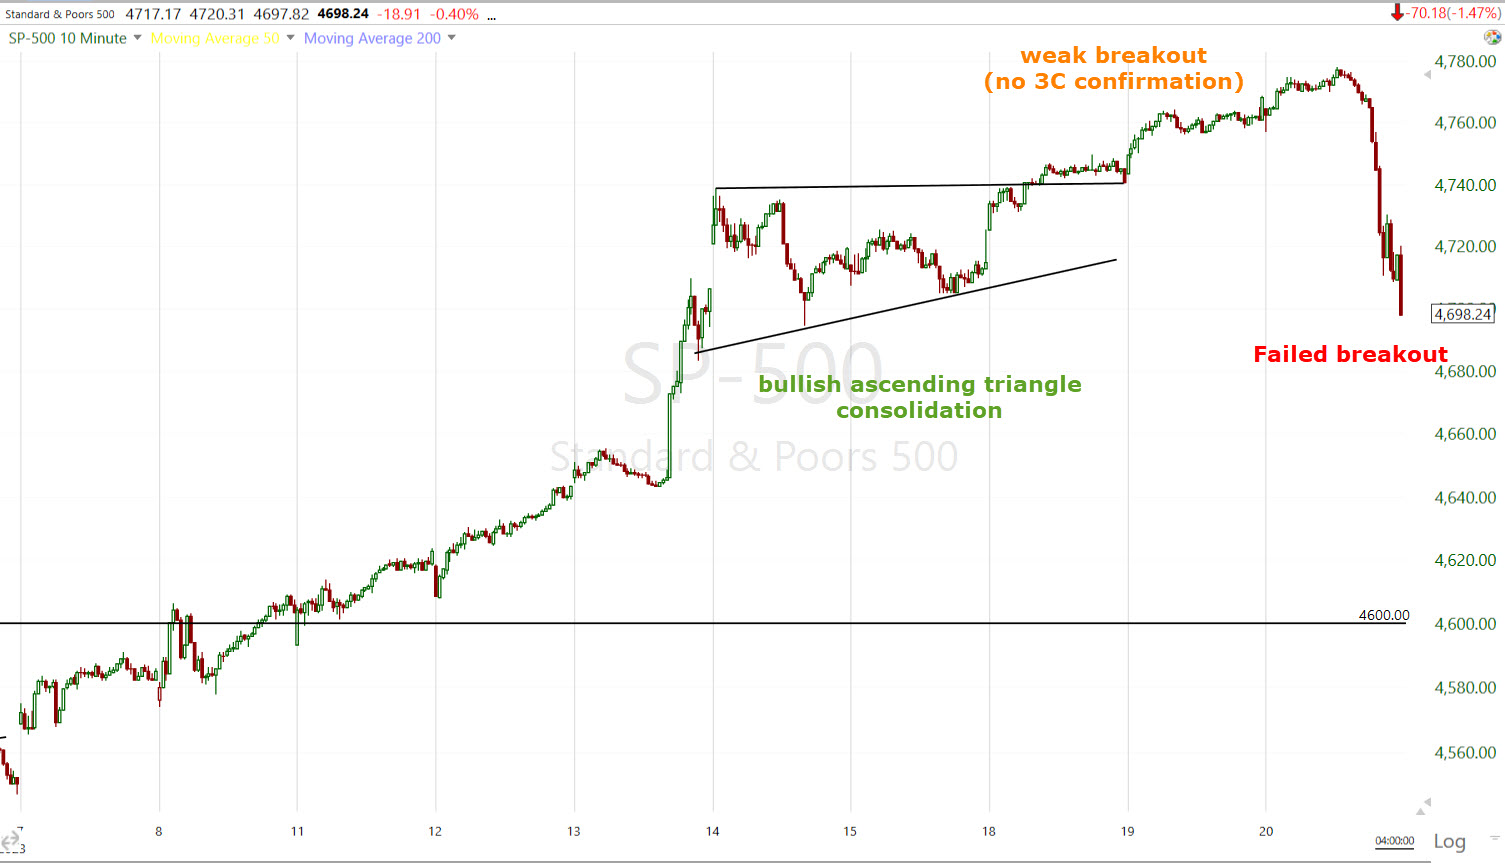
SP-500 (10m)
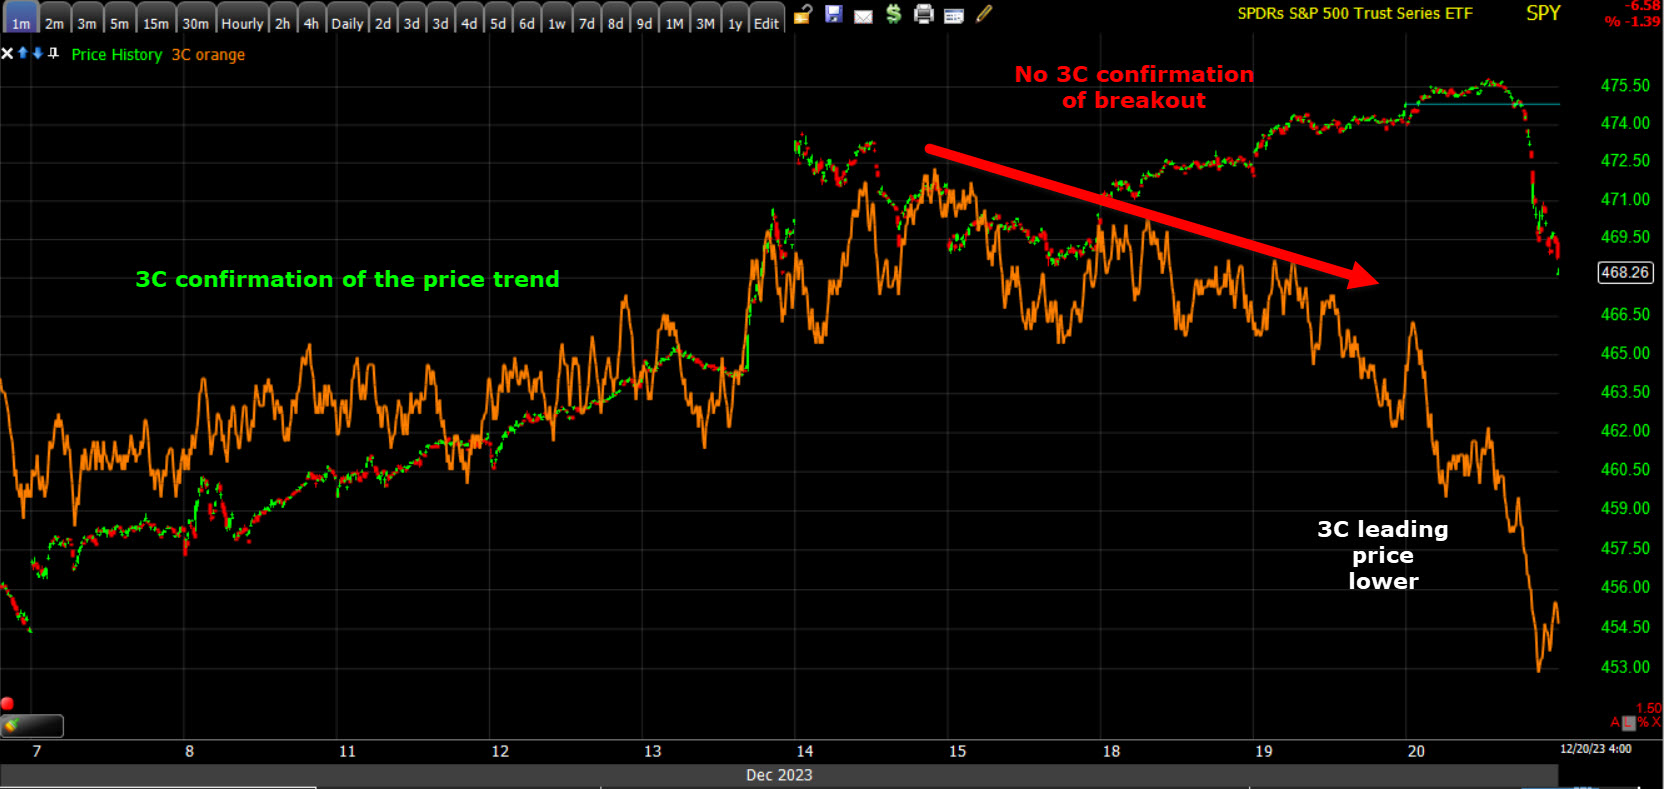
SPY (1m)
A failed breakout from bullish consolidations in every major stock market average today…
I’m going to report my exhaustive member’s content and analysis from yesterday, December 19th, 2023 below. Enjoy.
Daily Wrap -Sentiment Extreme
Overnight one of the events of the week was the Bank of Japan’s policy meeting as some BOJ officials hinted the BOJ may raise rates and exit their long term policy of negative interest rates, which would almost certainly send global yields higher. As many of us long time BOJ watchers suspected, the Bank of Japan did nothing and held policy rates unchanged at -0.10%. The BOJ couldn’t pull the trigger and stuck with negative interest rate policy. The lack of a move had some effect, it had the inverse consequence and stoked a drop in market rates, helped by interest rate differential trade.
Small Cap stocks easily outperformed the broader market, reflecting an increase in speculative trading. FOMO momentum continues and is reaching a tipping point in sentiment, volatility and breadth indicators as you’ll see below. Meanwhile, the mega-caps lagged behind again.
As you may have noticed by now, Small Caps move highly correlated to my Most Shorted Index. Yesterday I noted that,
“My Most shorted Index saw some weakness this morning.”
And this morning I noted,
” the modest weakness yesterday was retraced this morning. As you can see, it’s nowhere near the size of the FOMC short squeeze to the left, it’s just a retracement of yesterday’s dip so I’m not real confident that this is the start of a 6th major short squeeze, but more of a jiggle in the MSI.”
Small Caps tracked nearly tick for tick with my Most Shorted Index to post an impressive near +2% gain. Was this another notable short squeeze? Not even close. It seems to be buyers chasing the same “most shorted” stocks that have soared since the end of October with 5 massive short squeezes, or…“The Dash For Trash”.
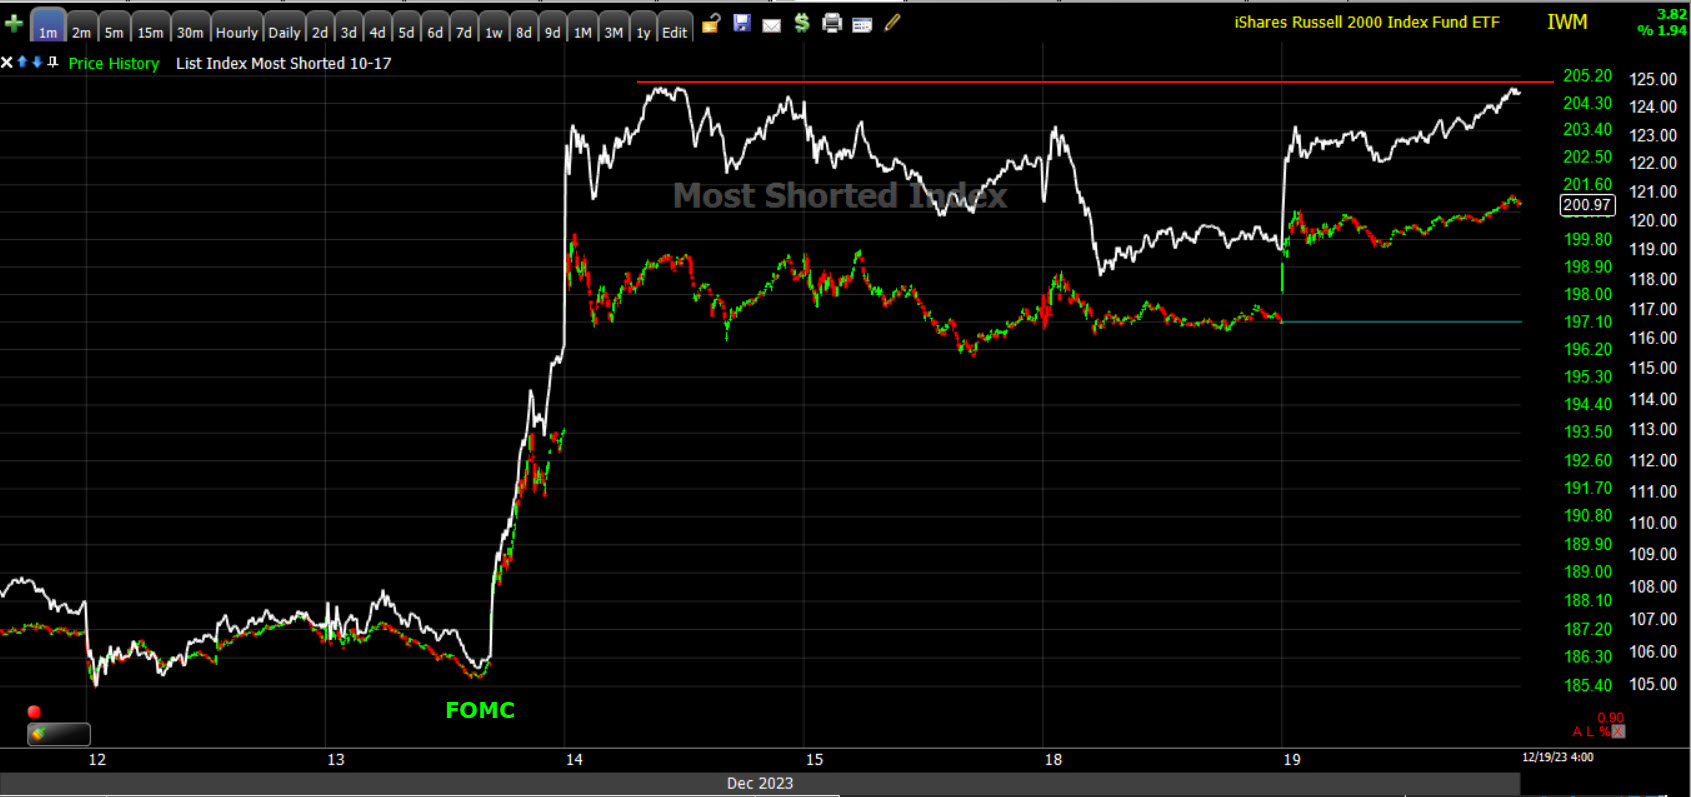 Small Cap IWM (1m) and my Most Shorted Index. The MSI has not made a new high since last Wednesday’s post FOMC short squeeze (squeeze #5). This was not another notable large short squeeze.
I haven’t created the scan yet, but my assessment is that the worst performing stocks over the last 12 months, are those currently being bought… Or… “The Dash for Trash.” This is similar to the speculative mania that defined late 1999’s Tech bubble.
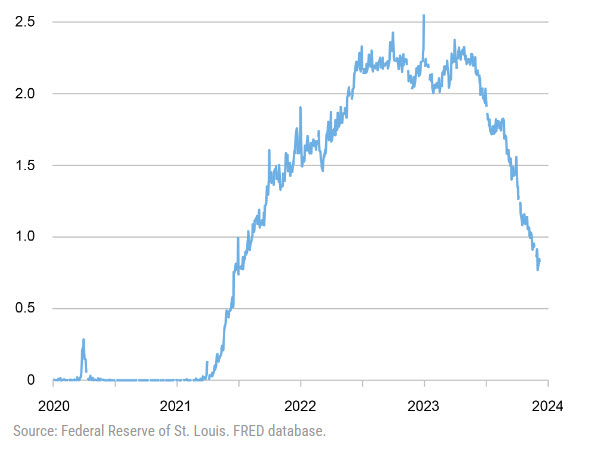
Then, like now, the market was flush with liquidity. Few people were aware of this, but the Fed pumped the market full of liquidity heading into the end of 1999, and while the reason may sound silly now, many people were deeply concerned back then about “Y2K”. The Fed was among them. After Y2K turned out to be a nothing, the Fed withdrew all of that liquidity and that was the pin that popped the Tech bubble. The current liquidity inflow is from the Fed’s RRP facility and that will run dry in 2024. Take-up at the Overnight Reverse Repo Facility (ON RRP) has halved over the past six months, declining by more than $1 trillion since June 2023, but it’s still offsetting the Fed’s balance sheet drawdown by a wide margin.
What I found back in late 1999 and early 2000 (as the market was flush with liquidity) was that the crappiest stocks, generally under $5, generally with small market capitalizations and VERY high P/E’s, were rallying like crazy. In a very real sense you could say that it was the height of greed and speculative activity.
As for the current situation, I do have this breadth indicator that I think makes the point well enough.
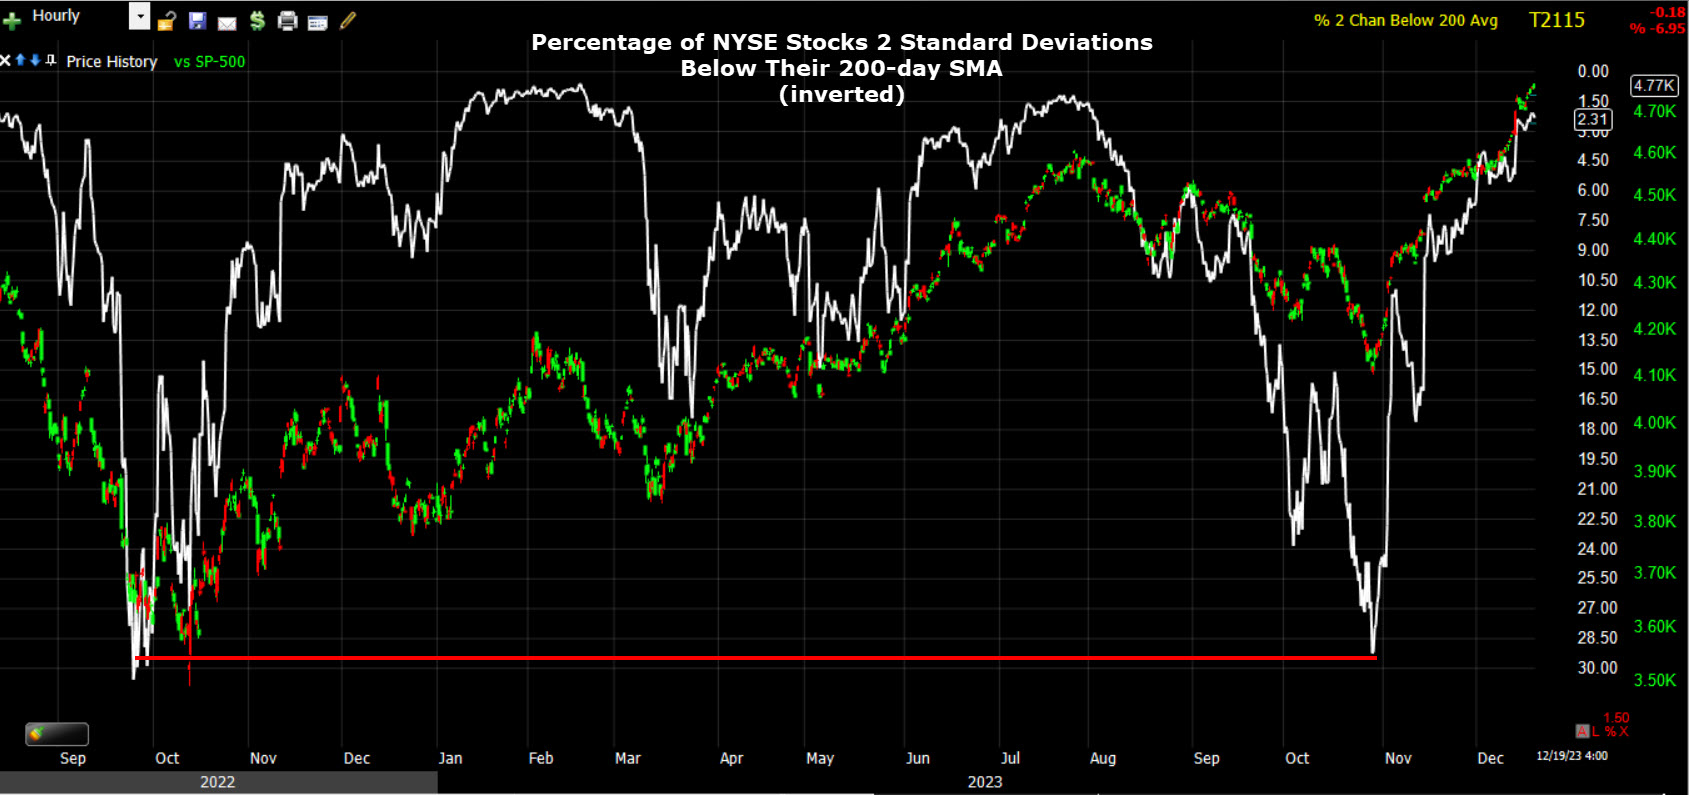
SPX (60m) and the Percentage of NYSE Stocks Trading 2 Standard Deviations Below Their 200-Day SMA (inverted) reached the highest level since the bear market bottom in October of 2022! That’s when things were the ugliest (darkest before the dawn) and they’ve been rallying pretty non-stop since the late October extreme low, but they are nearing their long-term mean reversion.
Translation: the stocks that were performing the worst (2 SD’s below their 200-day) have been among the best performers, which is why I keep repeating that the current environment is nothing like the main 2023 theme of quality mega-caps, but rather, “The Dash For Trash.”
When you see who’s buying, the 3C charts, and the sentiment data in the “Summary” section of the post will make sense...
According to MS Quant desk notes today,” it is retail investors that have arguably been a big driver of the melt up given they have been buying at the fastest pace in over 18 months, coming in with over $60bn in total equity market demand over the last month on QDS estimates based on public data.”
I can’t argue with this as this is exactly what I’ve noted. Here’s an excerpt from last Thursday’s Daily Wrap, “The Stock Market Has No Clue That The Fed Just Told Us That They’re Positioning For Recession Fighting”.
By the way, this is post’s title is the literal depiction of my long term Three-Phase forecast from last year… PHASE II to be specific. After the market rallies on peak inflation and peak hawkishness (PHASE I), the market transitions to PHASE II in the second half of 2023 and into 2024. Phase II is the Fed (and eventually the market) move from worrying about inflation, to worrying about recession.
As for the excerpt from my post and RETAIL, this was commentary regarding SPY’s 3C trend chart,
“My interpretation is that the strong buybacks, 4 episodes of multi-year record short covering and CTA’s going max long, was starting to fade as we moved in to December. As far as I can tell, the only buy-side support is Retail and some left over short covering – the two weakest forms of support which certainly explains how 3C went from perfect upside confirmation, to negatively divergent.”
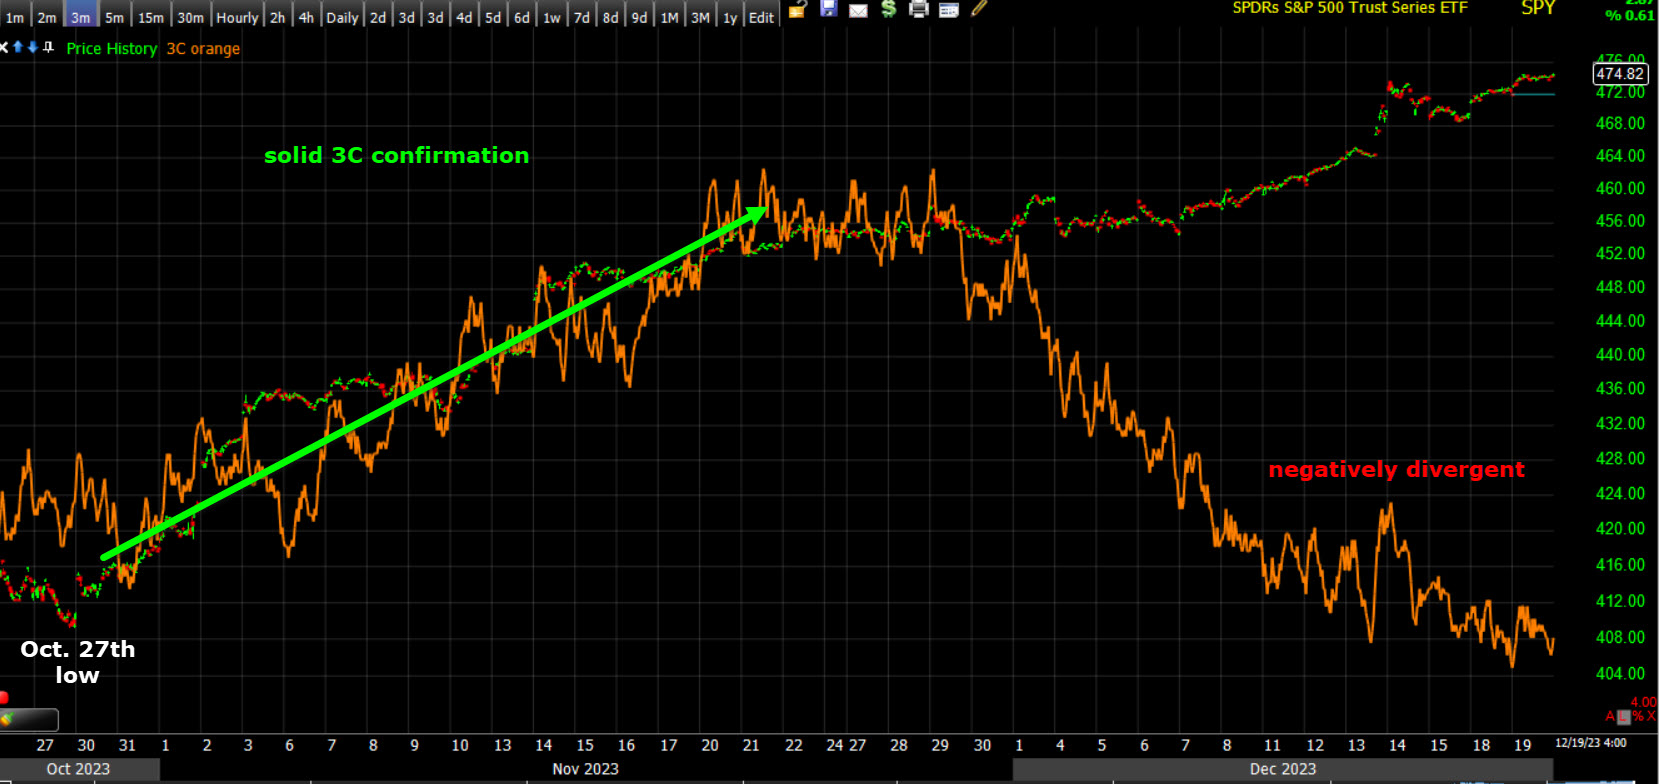 SPY (3m trend) – The worst of the divergence is above S&P $4600, my “Bull Trap” trigger level.
“With so may local resistance ranges, like the SPX $4600 level, all near by, it creates an almost irresistible bull trap. SPX would sail through $4600 in a bull trap scenario,” Weekend Update: Bull Trap Setting Up?” – December 10, 2023
Who’s buying?
The “left-over short covering” in the excerpt above refers to hedge funds. I think it’s pretty clear that hedge funds ruined their year when they burned their YTD returns going into this rally with the largest short position on record according to Goldman Sachs data (back to 2010). We already know that they had to cover at much higher prices as we’ve seen 5 massive short squeezes in an S&P rally that’s nearing +16% so they’ve been covering shorts the whole way up right through last week. That’s a lot of pain for the hedgies as they near year end. In fact, this is the worst month for L/S hedge funds since January 2021, and second worst month in at least 12 years (Source: Bloomberg.)
What can they do to try to save their year with so little time left? Chase the momentum trades – which happens to be the same crappy stocks they had been record short at the end of October.
And Retail…
After nearly 2 years of selling, retail has turned to a net single-stock buyer according to GS Prime data out the weekend prior to last.
“we are seeing a significant pickup in the net buying in single stock shares that is coming through the payment for order flow channel (i.e., aggregate GSET retail data). This is particularly significant… especially considering there has been a nearly 2-year trend of selling.”
Additionally, Vanda Research noted that crypto, Russell 2k and software stocks were key targets of retail’s rotation from big tech.
Averages
All of the majors closed higher, but Small Cap Russell 2000 was the standout winner by a large margin. Interestingly, there wasn’t a single sector even close to Small Cap Russell 2000′ gain today.
On a side note, to give some context of the size of these short squeezes, Goldman Sachs’ Most Shorted Index is up 16% since the FOMC last week. That’s the fifth short squeeze’s gain alone. For comparison’s sake, the Magnificent 7 mega-cap stocks as a group are up around 2% over the same period.
S&P-500 ⇧ 0.59 %
NASDAQ ⇧ 0.49 %
DOW JONES ⇧ 0.68 %
RUSSELL 2000 ⇧ 1.94 %
Dow Transports (+0.89%) had been rallying much like Small Caps on short squeezes, but I don’t think today was so much about short covering as it is chasing upside momentum of the most shorted stocks. As such, Transports didn’t get the same lift and seem to be running into resistance just below $16,200.
While we’re on Dow Transports, from a macro perspective and for those who believe this is the start of a new bull market, Transports “should” be confirming Dow Industrials. They are not.
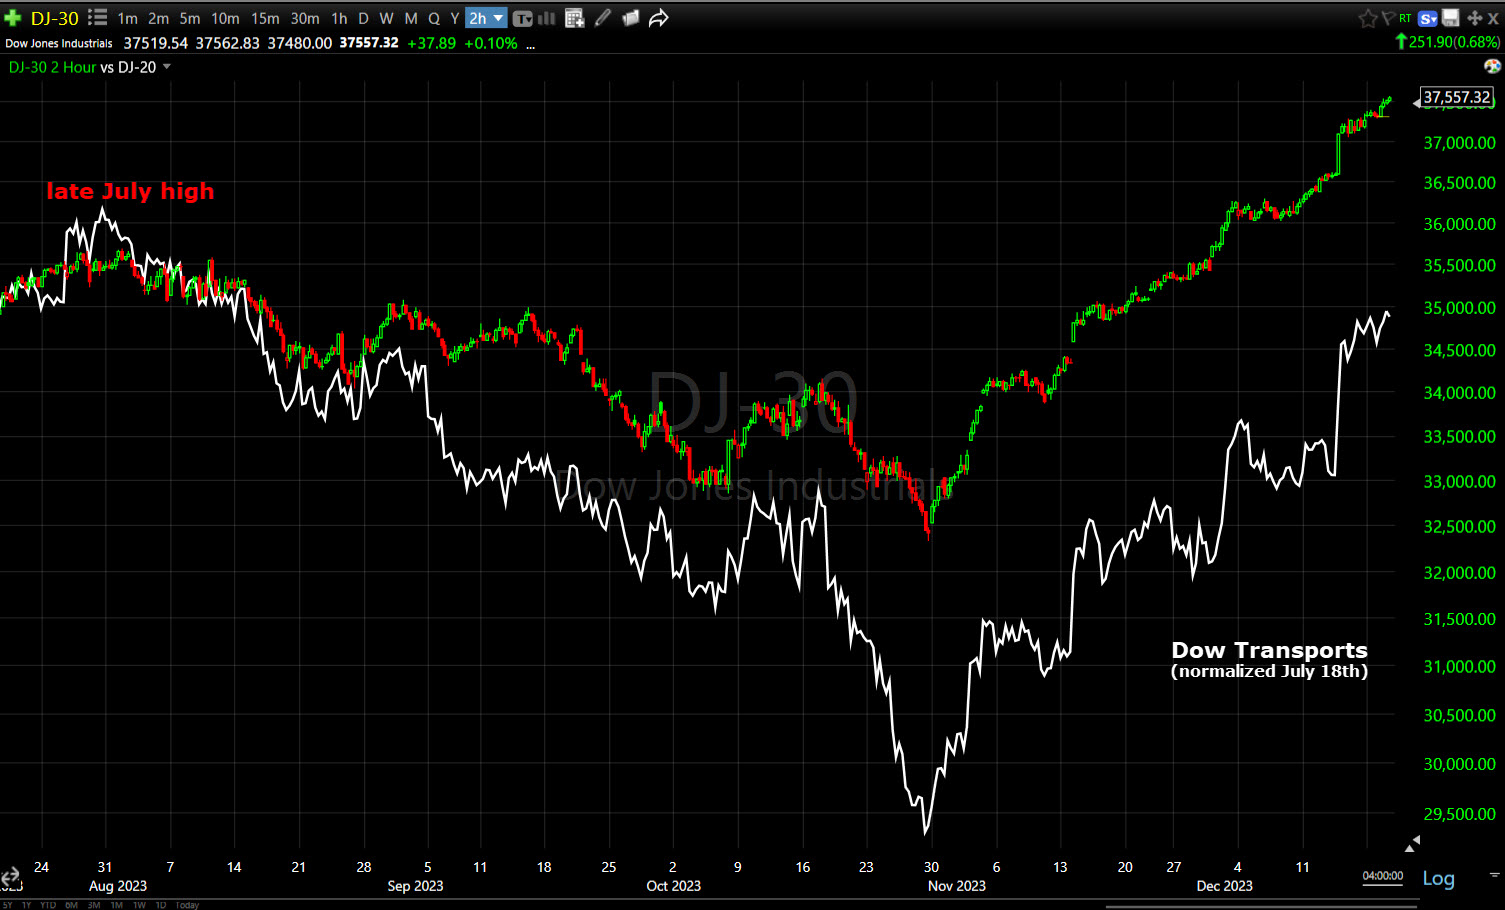 DJIA & DJT (2H)
Here’s the start of a new bull market….
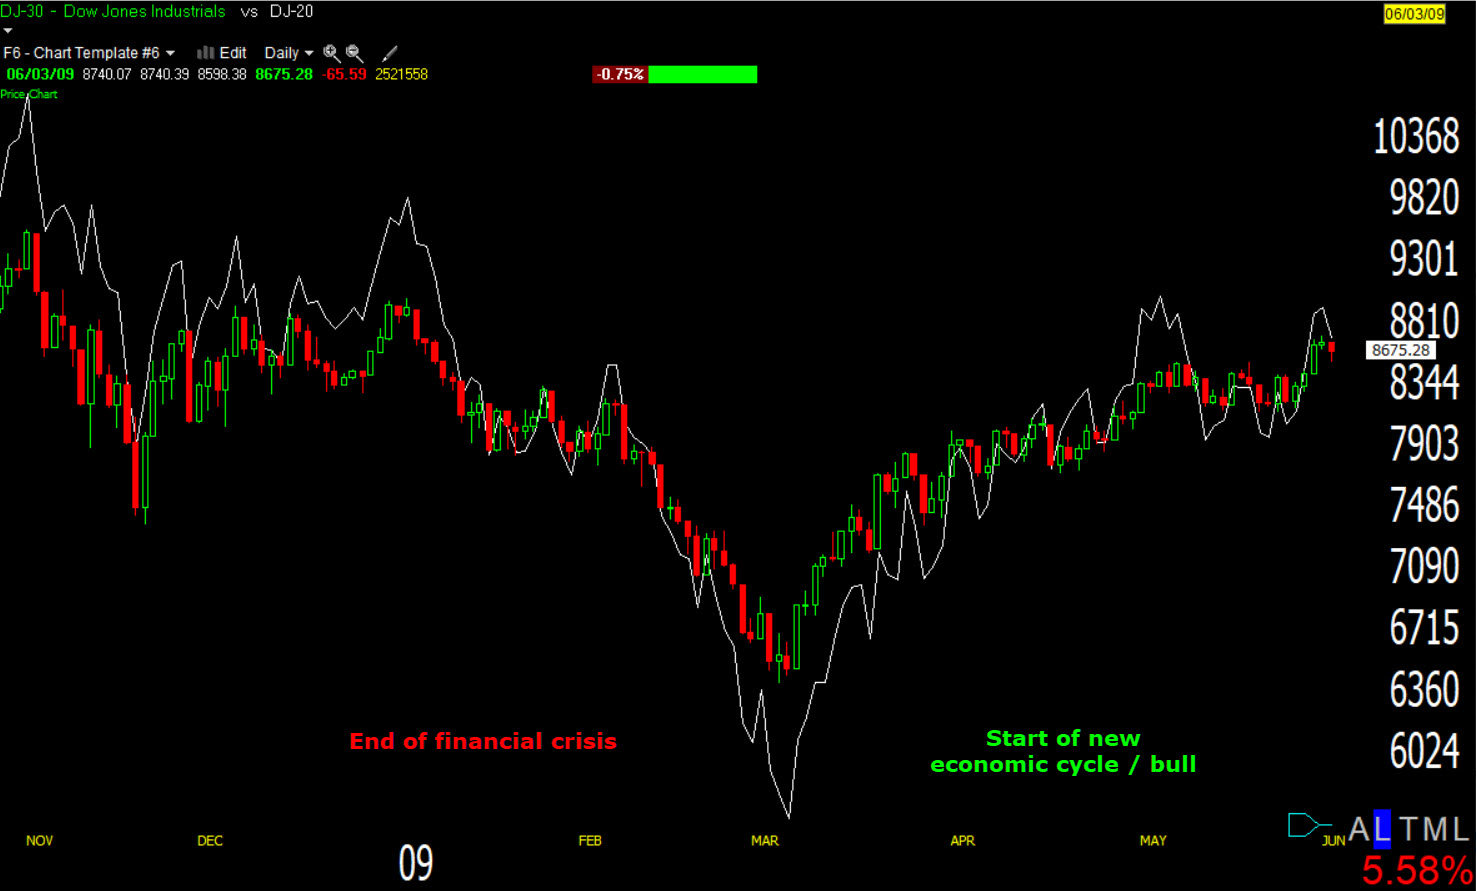
DJIA & DJT (daily) rolled back to 2008/2009 with excellent confirmation between the two indices.
Not much has changed on the intradya price charts. Price action is still solidly bullish in bias, but feels weak in conviction. That would make sense with a Retail FOMO chase, and will make more sense when you see what sentiment is doing.
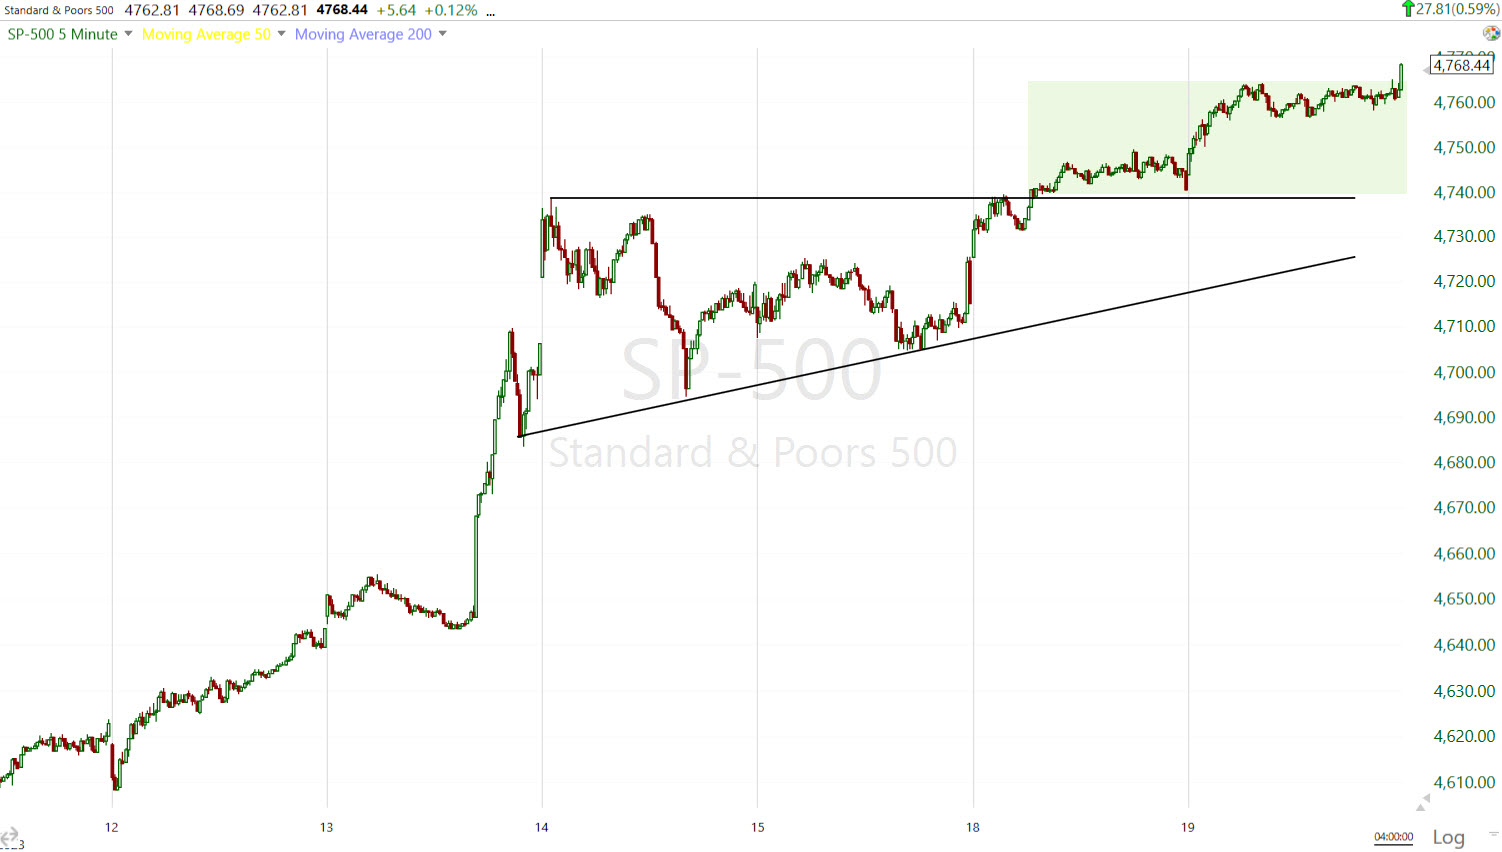 SP-500 (5m) has been above its consolidation (breakout) for 2 days and in that time it’s rarely moved more than a half percent from the breakout point (low conviction). Interestingly though, there was some last minute rotation right into the close.
Just after I posted the Afternoon Update — which shows a great example of how Small Caps benefit the most (in this case, solely) from moves higher in my Most Shorted Index — and in the final few minutes of trade before the close, there was a VERY clear rotation out of Small Cap IWM and into SPY, QQQ, and DIA to a lesser extent. You could see it happening in real time watching price and volume. These charts don’t make the same impression as watching it in real time, but they’ll do.
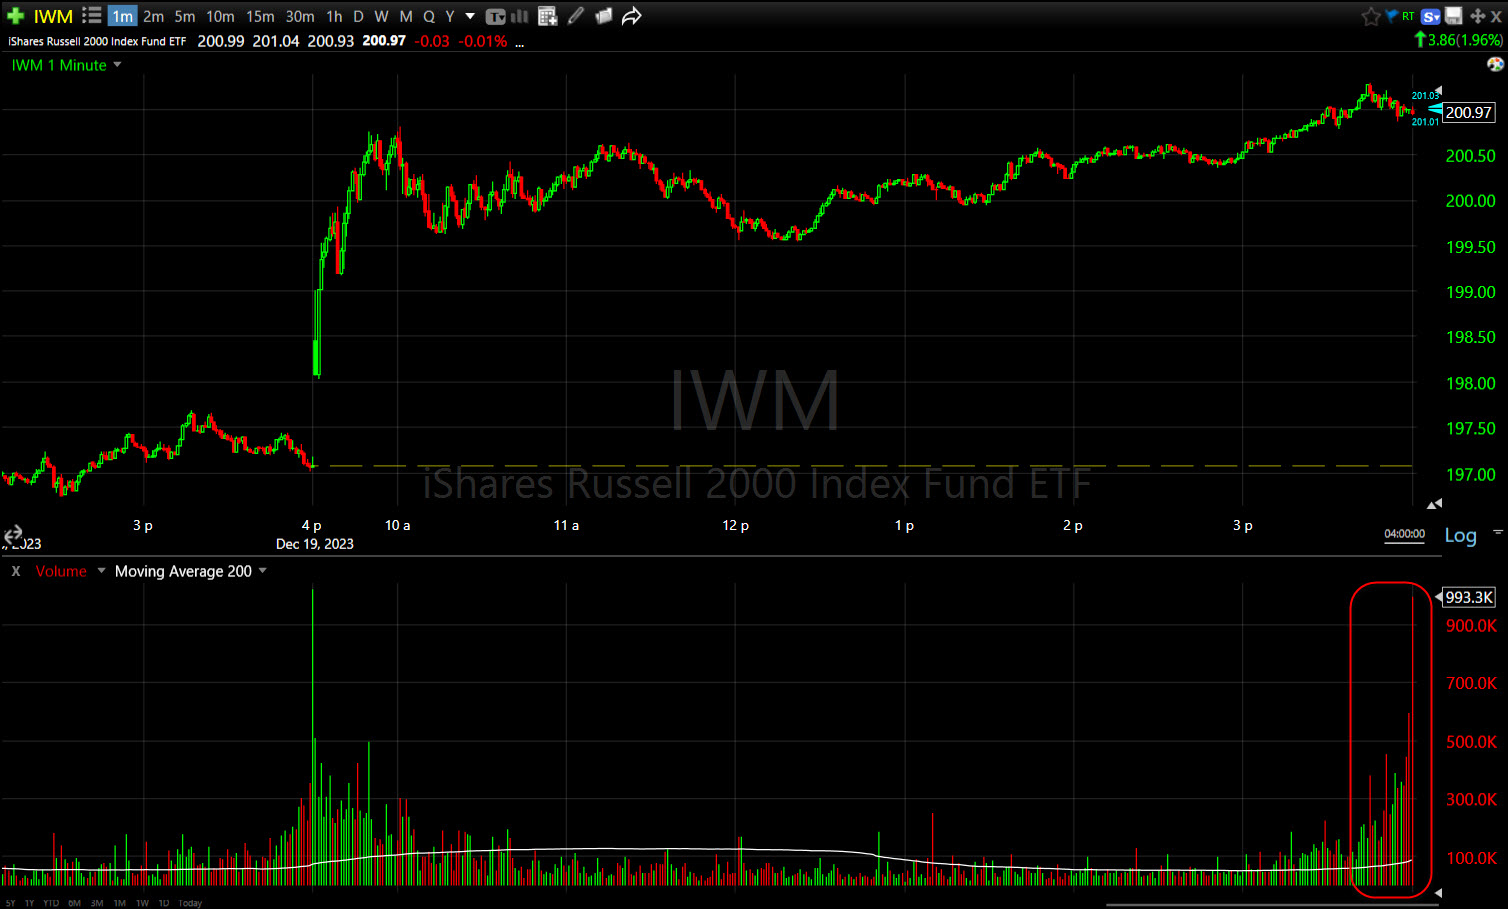 IWM (1m today) note the heavy red volume into the close, meanwhile the money was going to…
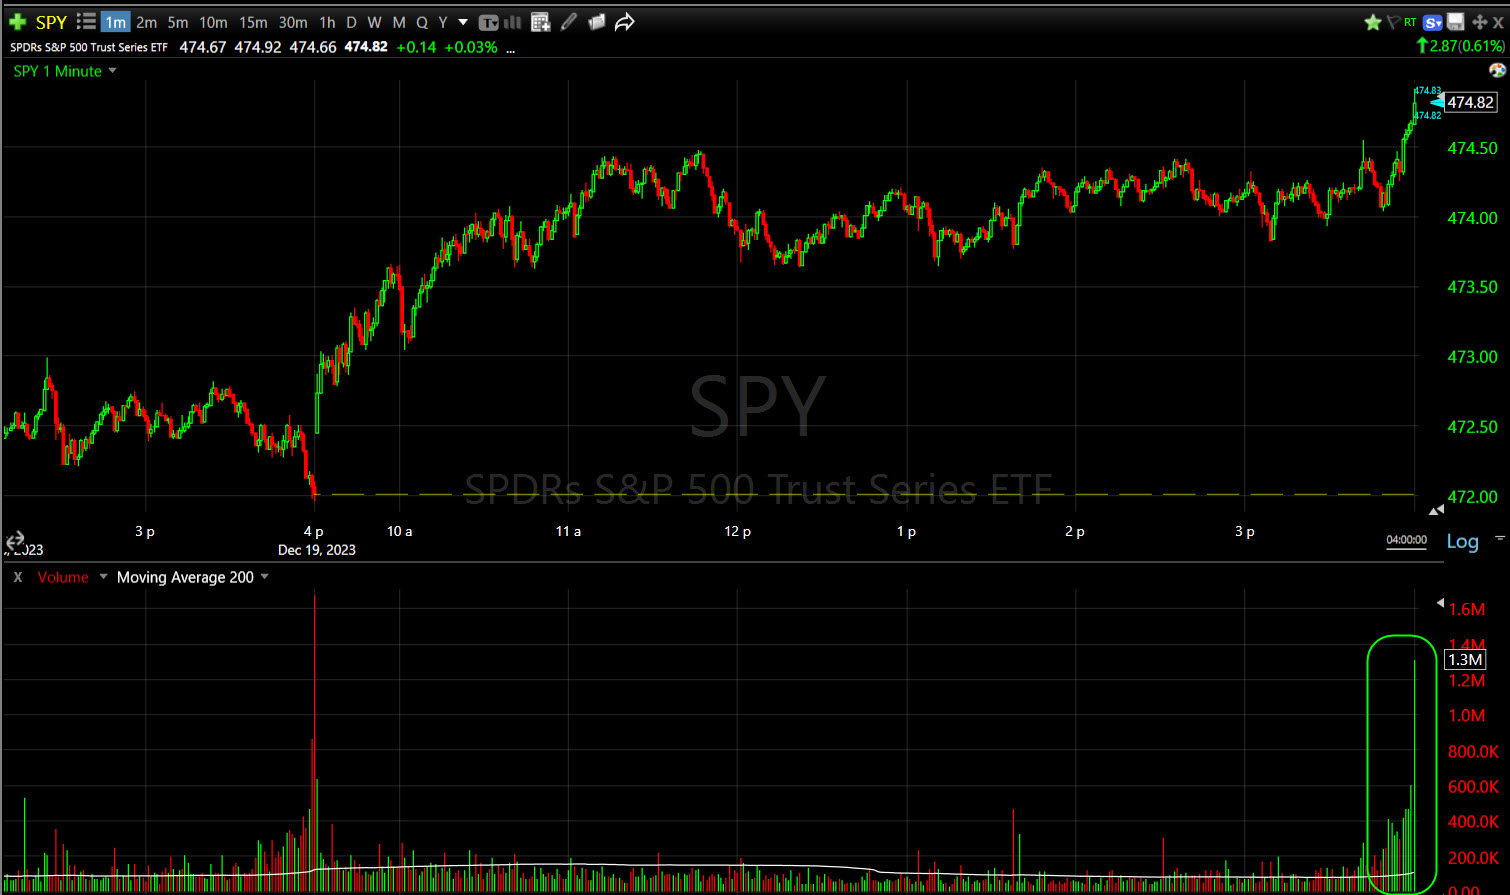 SPY (1m today) – note the heavy green volume into the close.
And…
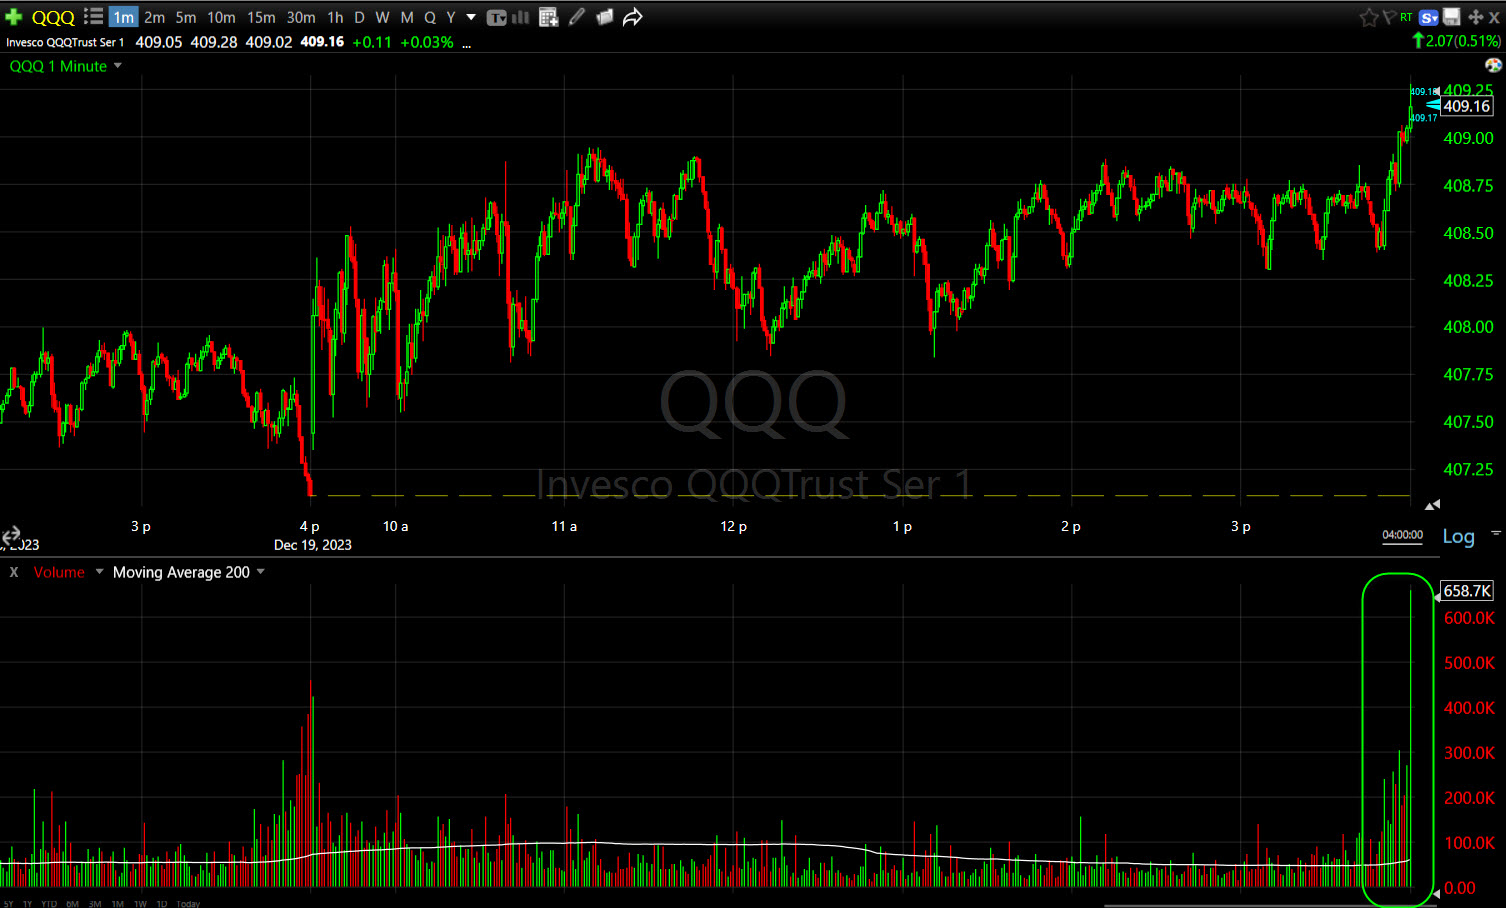 QQQ (1m today) also with heavy green volume into the close.
The Dow got some too, just not to the same extent.
Interestingly, VIX was bid up as well into the close.
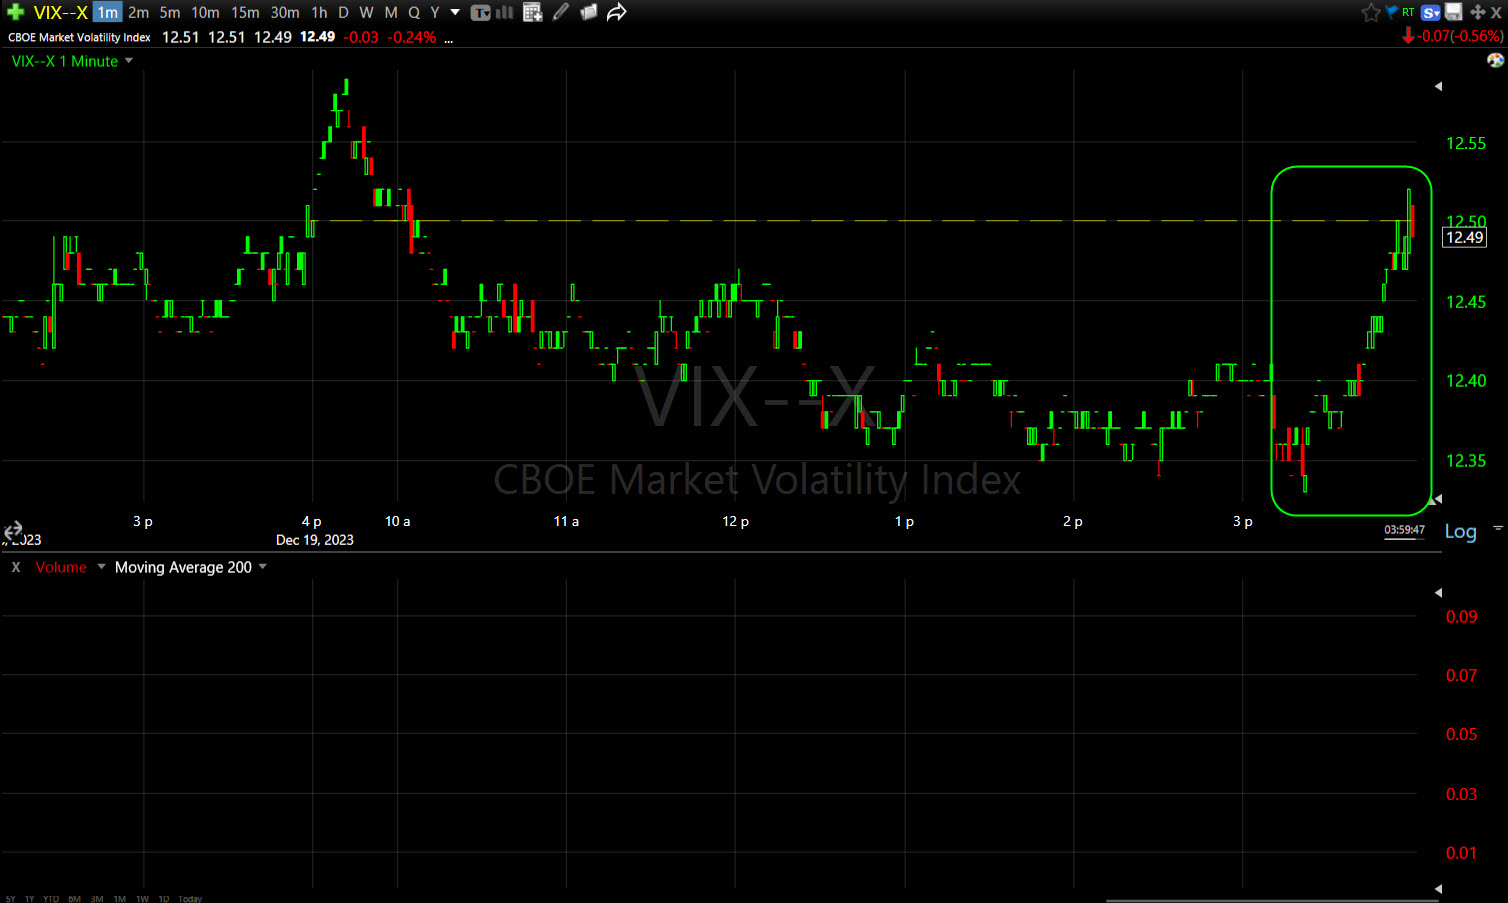 VIX (1m)
VIX (-0.25%) did relatively well on the day. We’ll want to watch for positive correlation between VIX and the S&P at this point. I don’t know if we’ll get it in time, but if so, it denotes a much uglier resolution to this intense rally.
VVIX (+0.1%) continues to trend with modest relative strength. VVIX’s relative performance vs. the SPX tells us what hedgers are doing and very often calls turns in the market ahead of time.
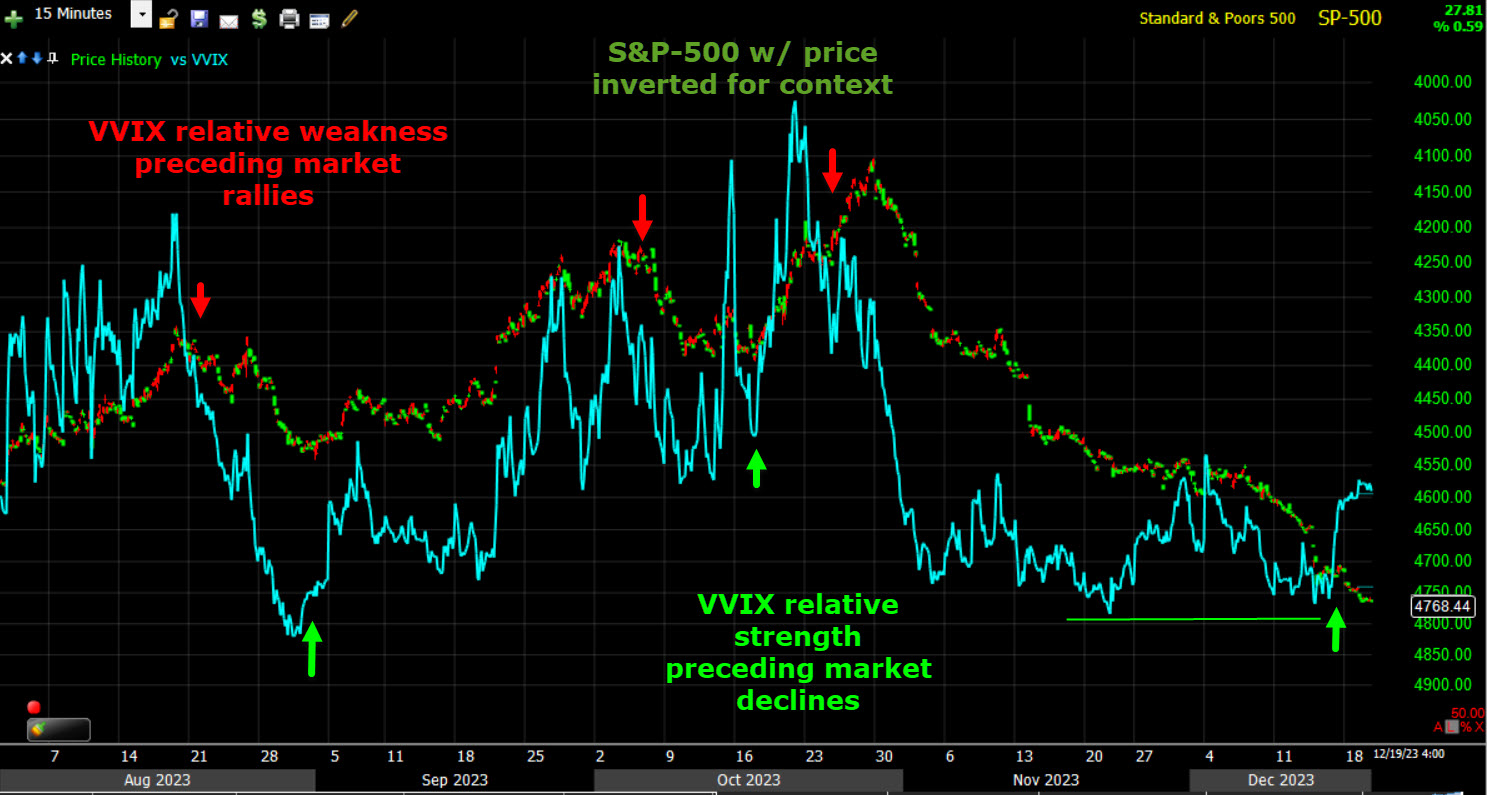 SPX (price inverted) and VVIX (blue) with relative strength (green) and relative weakness (red) calling turns in the SPX. Remember the S&P’s price is inverted for context.
VIX often calls changes in equities early too via relative strength divergences, but VVIX is almost always first…
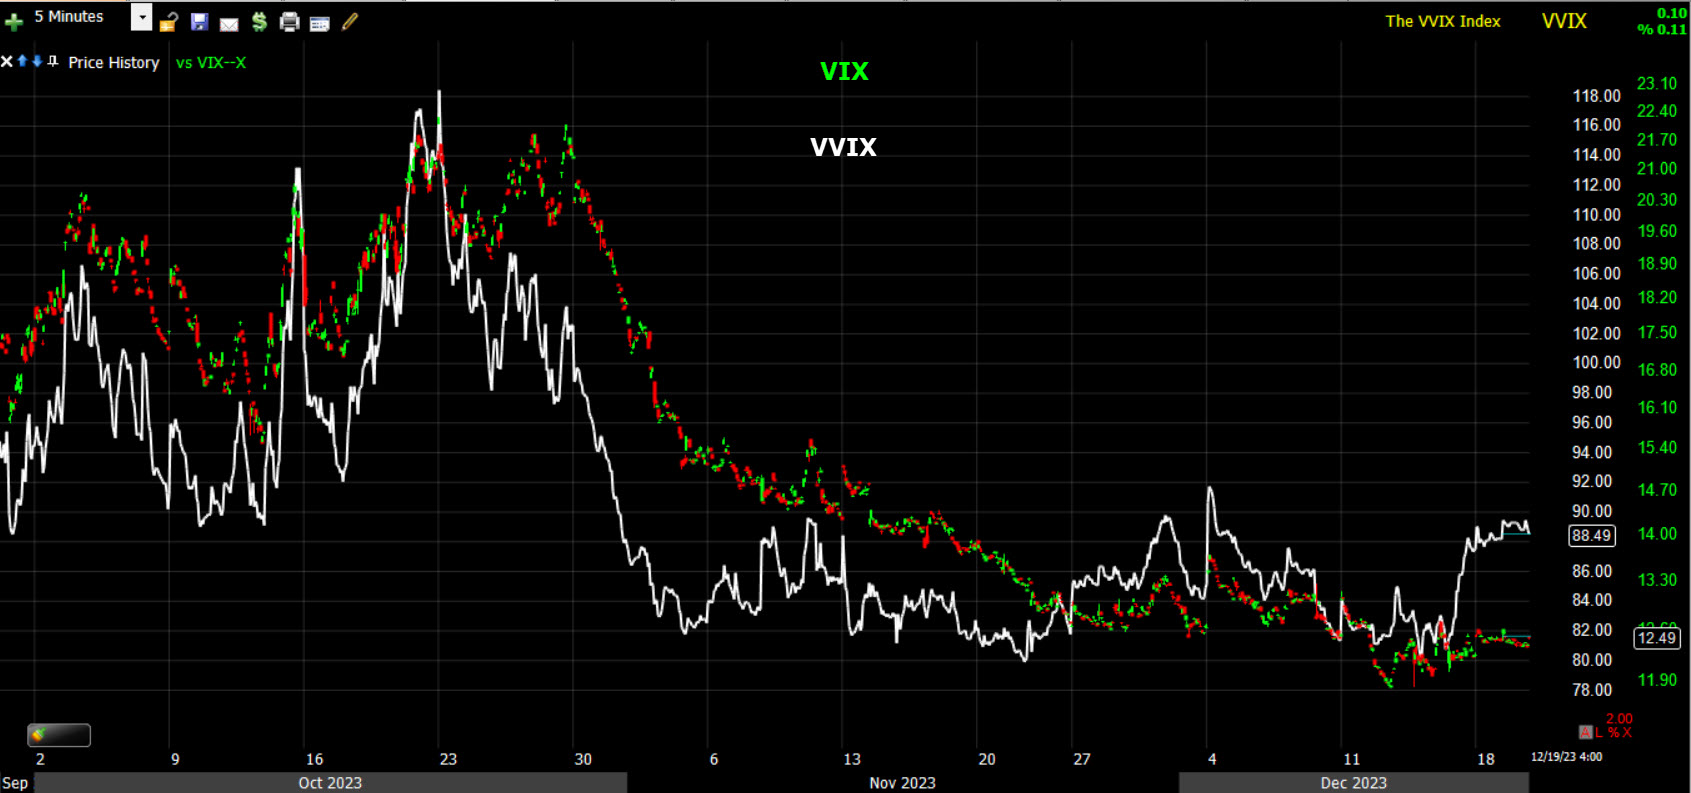 VIX vs. VVIX (5m) – VVIX almost always leads VIX. Right now VVIX’s relative strength over VIX suggests smart money is hedging a big move higher in volatility ( which means lower stocks).
The real standout in volatility is the bullish sentient extreme depicted by Volatility’s Term Structure falling deeper and deeper into extreme contango (investors generally have no fear); an event that depicts market sentiment getting too frothy or euphoric. You can see extreme contango (red) at several of this year’s recent pivot highs on the chart below.
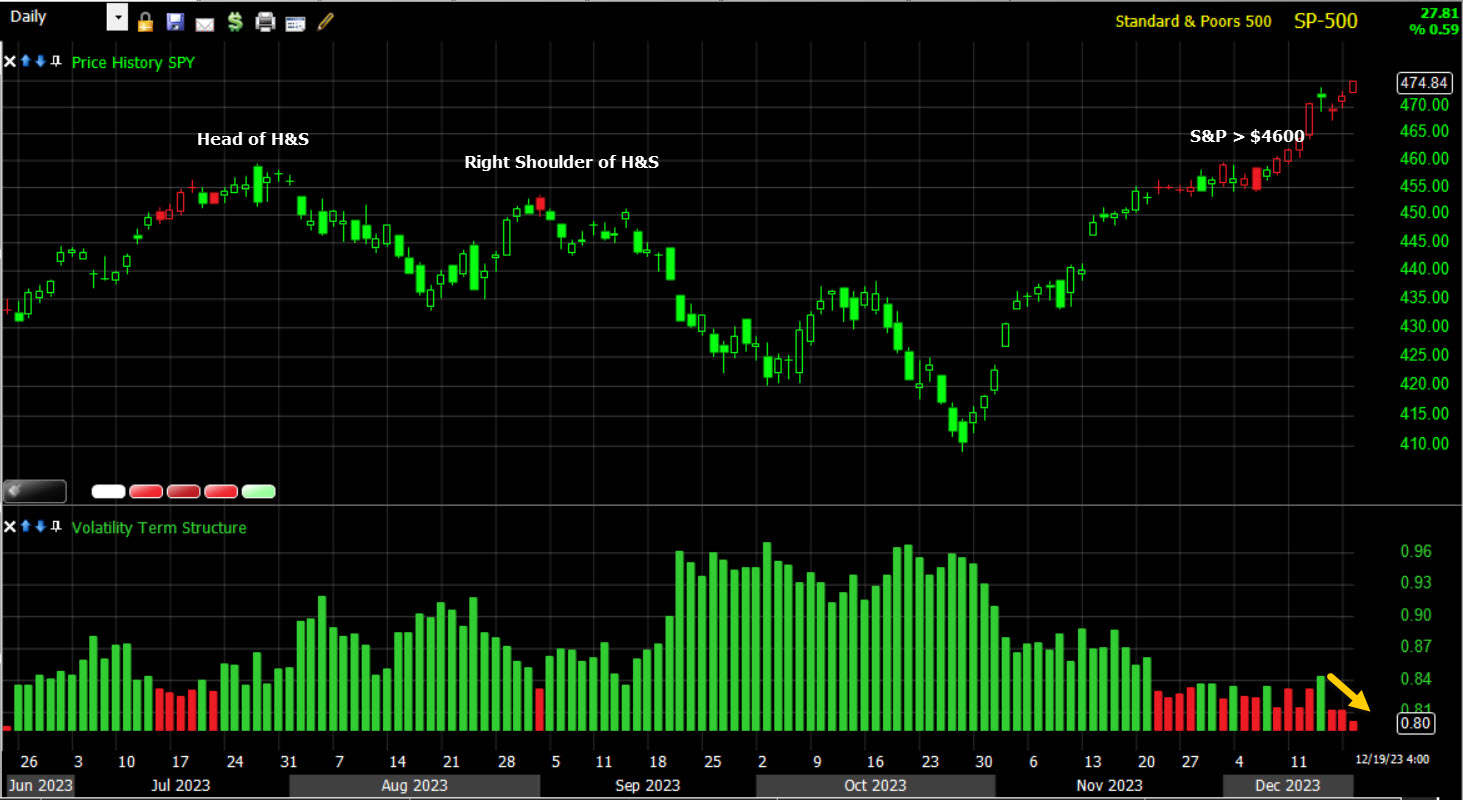 S&P-500 (daily) and Volatility’s Term Structure. Red painted candles are in unusually deep contango depicting frothy sentiment. And it keeps falling further and further.
S&P sectors
All 11 S&P sectors closed with gains. Interestingly not one was close to the gains in the Russell 2000. that’s unusual and speaks to the fact that we’re not witnessing rotation, but rather speculation.
The lightly weighted Materials and Energy sectors led gains along with mega-cap heavy Communications. The mega-caps (MGK +0.45%) trailed the S&P Equal Weight Index by 40 basis points.
Once again, as has been the trend when Small Caps run, the short squeeze favorites outperformed including: Regional Banks (+1.5%), the Retail sector (+2.05%), Homebuilders (+1.4%) and Biotechs (+2.6%).
Materials ⇧ 0.92 %
Energy ⇧ 1.20 %
Financials ⇧ 0.75 %
Industrial ⇧ 0.77 %
Technology ⇧ 0.38 %
Consumer Staples ⇧ 0.20 %
Utilities ⇧ 0.57 %
Health Care ⇧ 0.67 %
Consumer Discretionary ⇧ 0.78 %
Real Estate ⇧ 0.68 %
Communications ⇧ 1.02 %
Internals
The A-D line favored Advancers (2275) by a better than 4-to-1 margin over Decliners (541) at the NYSE and a nearly 2-to-1 margin at the NASDAQ Composite.
However, the Dominant price/volume relationship came in as I suspected, Close Up/Volume Down. This is the most bearish, suspect relationship and with all 11 sectors green and advancers better than 2-to-1, it is a perfect 1-day overbought internals signal.
The broad trend of breadth oscillators remains extremely overbought, and over an unusually long period, just as the market was extremely oversold over an unusually long period coming into November. This is pretty much the basis for the massive pendulum swing in mass psychology, going from too bearish, to now too bullish.
Treasuries
The 2-yr yield fell one basis point to 4.45% and the 10-yr yield fell four basis points to 3.92%.
Atlanta Fed President Bostic (2024 FOMC voter) told listeners at an event in Atlanta that he does not see an urgency to cut rates in 2024, according to Bloomberg.
Since The FOMC last week, yields are down around 27-30 basis points (or one Fed rate cut).
Currencies and Commodities
The U.S. Dollar Index lost about -0.45% today. It’s still trading under the pre-FOMC basing pattern and what it does from here is going to be very informative as to what asset classes perform next year and what the U.S. economy looks like.
WTI crude oil futures added another +1.6% today to $74.01/bbl.
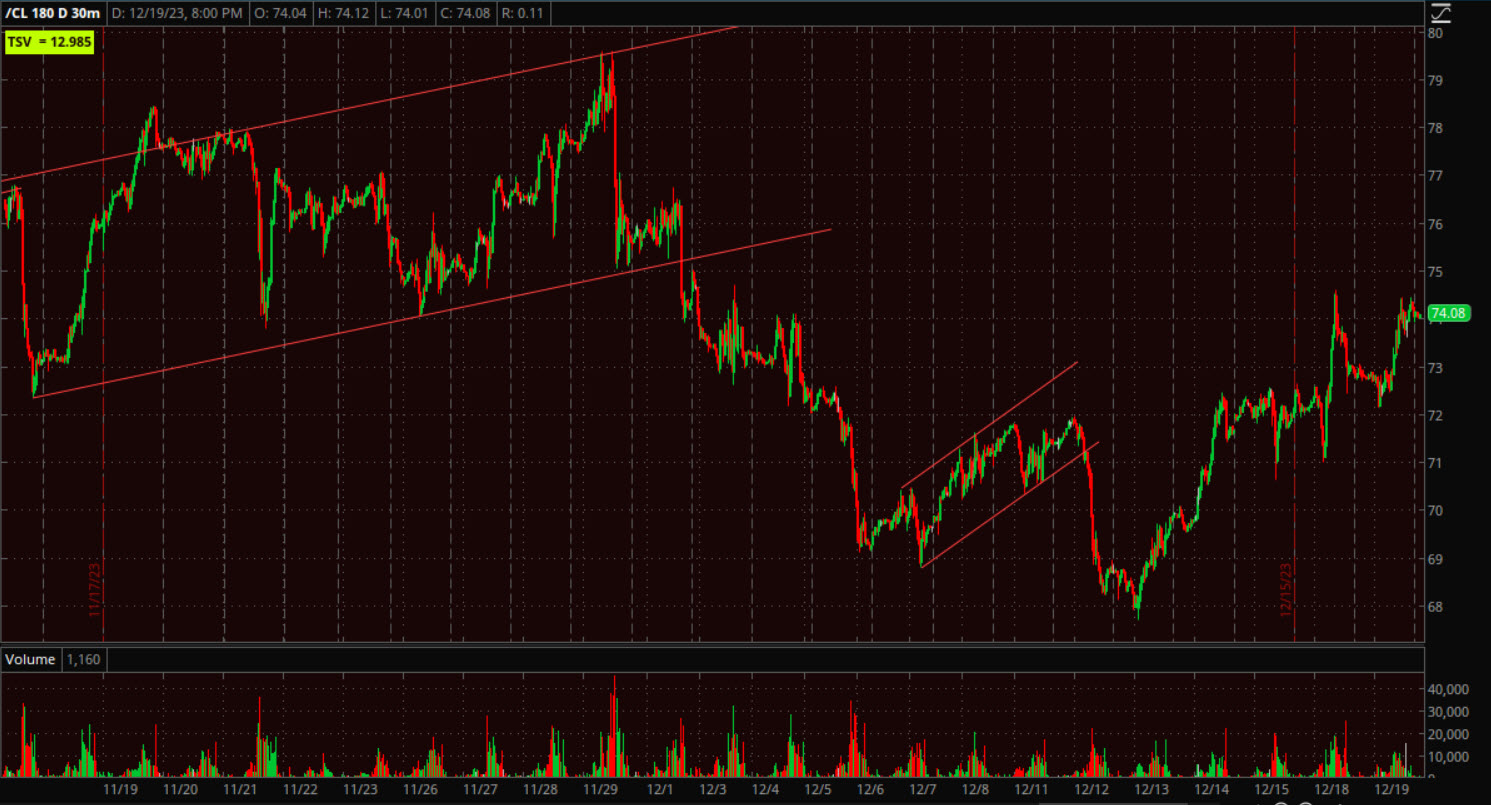 WTI Crude Oil Futures (30m) – I don’t feel like this is the typical bear flag we’ve seen a number of in Crude Oil since its decline from September highs. It’s been a steadily ugly downtrend, even when geo-political tensions between Israel and Hamas sparked up. I don’t feel like a bottom is in either, but I do feel like there’s a higher probability now that oil is in a transitional state. For a bullish play I’d like to see it test recent lows successfully. There’s certainly a lot of shorts piled in and it could spark a big short squeeze. The bearish case would be that price does break down from this consolidation that is similar to a bear flag, but just a little too steep in its incline. For now my call is moving from bearish to neutral. A rally in crude and other energy products could certainly reignite fears of resurgent inflation so what happens here is not in a vacuum. It could have consequences for equities and even the economy.
Gold futures gained +0.6% to $2,052.10/oz, helped on by weakness in yields and the dollar. Gold’s price action is improving to the point I’m tentatively drawing in some consolidation trend lines.
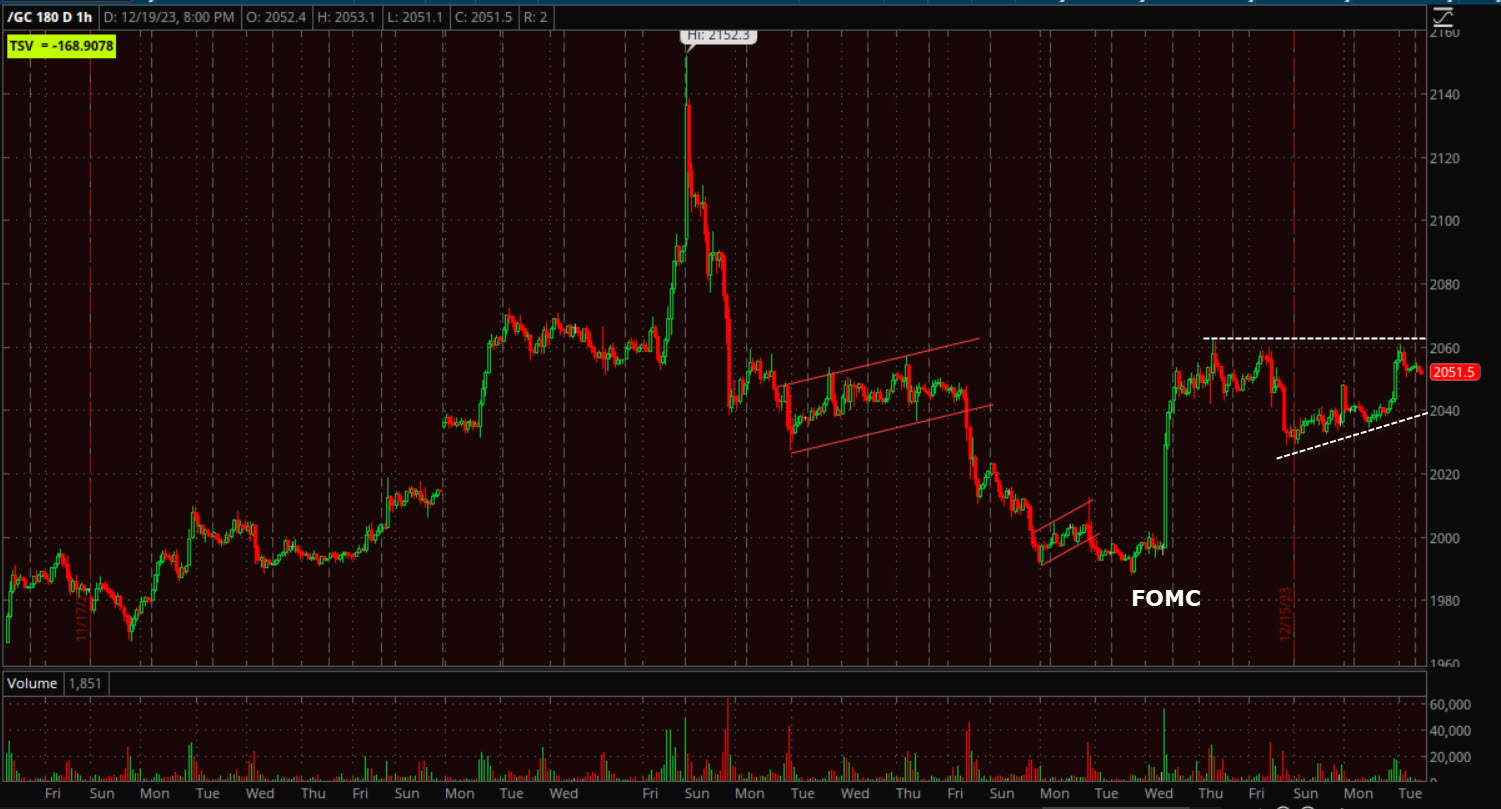 Gold futures (60m) I’ve very tentatively drawn in the trend lines of a bullish ascending triangle. Volume declining recently has helped me feel more comfortable with that tentative call. I’d call $2070 a breakout on the upside which could lead to a +3% to +3.5% gain from the breakout point. As far as breaking down, I’m not too worried about gold pulling back to $2,000 or even a little below. I just want to see a strong bullish consolidation of some size as I think it could set gold up for a very strong run next year. I’d also look at TLT for next year, but only after a pull back. I do think the asset classes that perform well next year are going to be very, very different than this year and I have my eye on both gold and TLT.
Bitcoin extended gains above $43k overnight, then slid down below $42k.
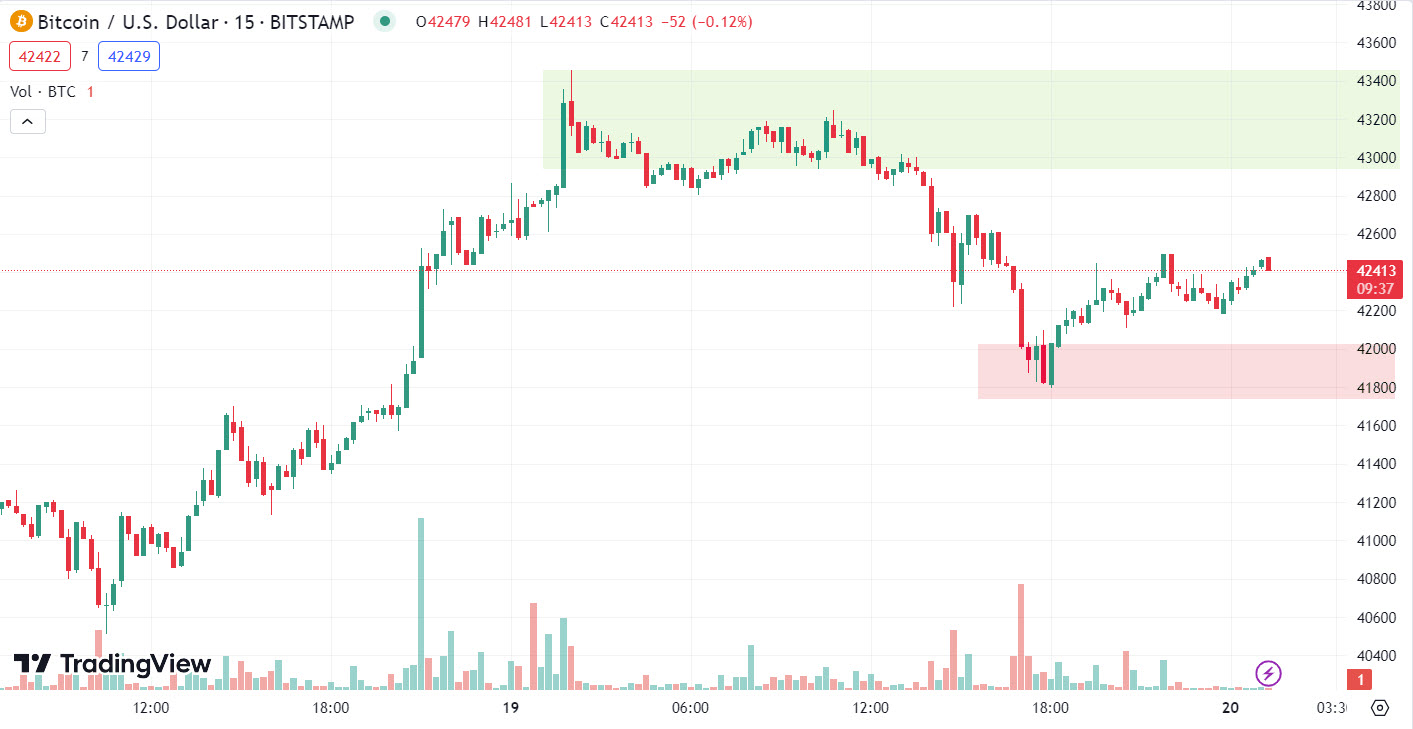 BTC/USD (15m) both of these areas are important to watch for BTC as price remains locked in a bullish consolidation.
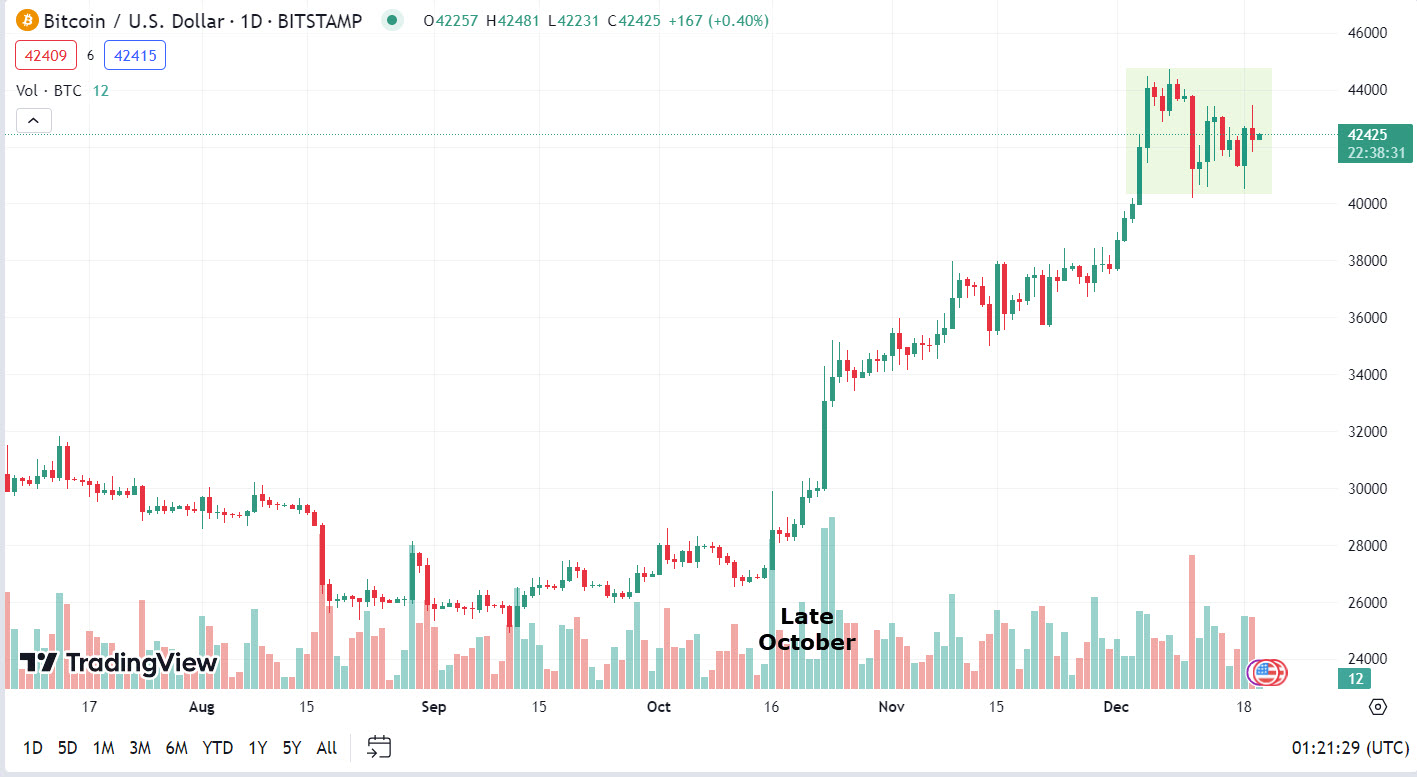 BTC/USD (daily) rallying with broad mass psychology or “risk-on” sentiment. As I mentioned last night, even if you’re not a crypto fan, BTC can be useful in determining changes in risk sentiment and liquidity.
Summary
Even with the very late day rotation out of Small Caps and into S&P, NASDAQ and to a lesser extent the Dow, the very short-term 3C charts that “should” at least be confirming with the averages’ price action, especially as they’ve officially broken out of small bullish post-FOMC consolidations, still are not confirming and even getting worse in some cases (SPY & QQQ).
*Note – SPY and QQQ’s consolidation trend lines look slightly different from the averages because of the quarterly ex-dividend payment on December 15th.
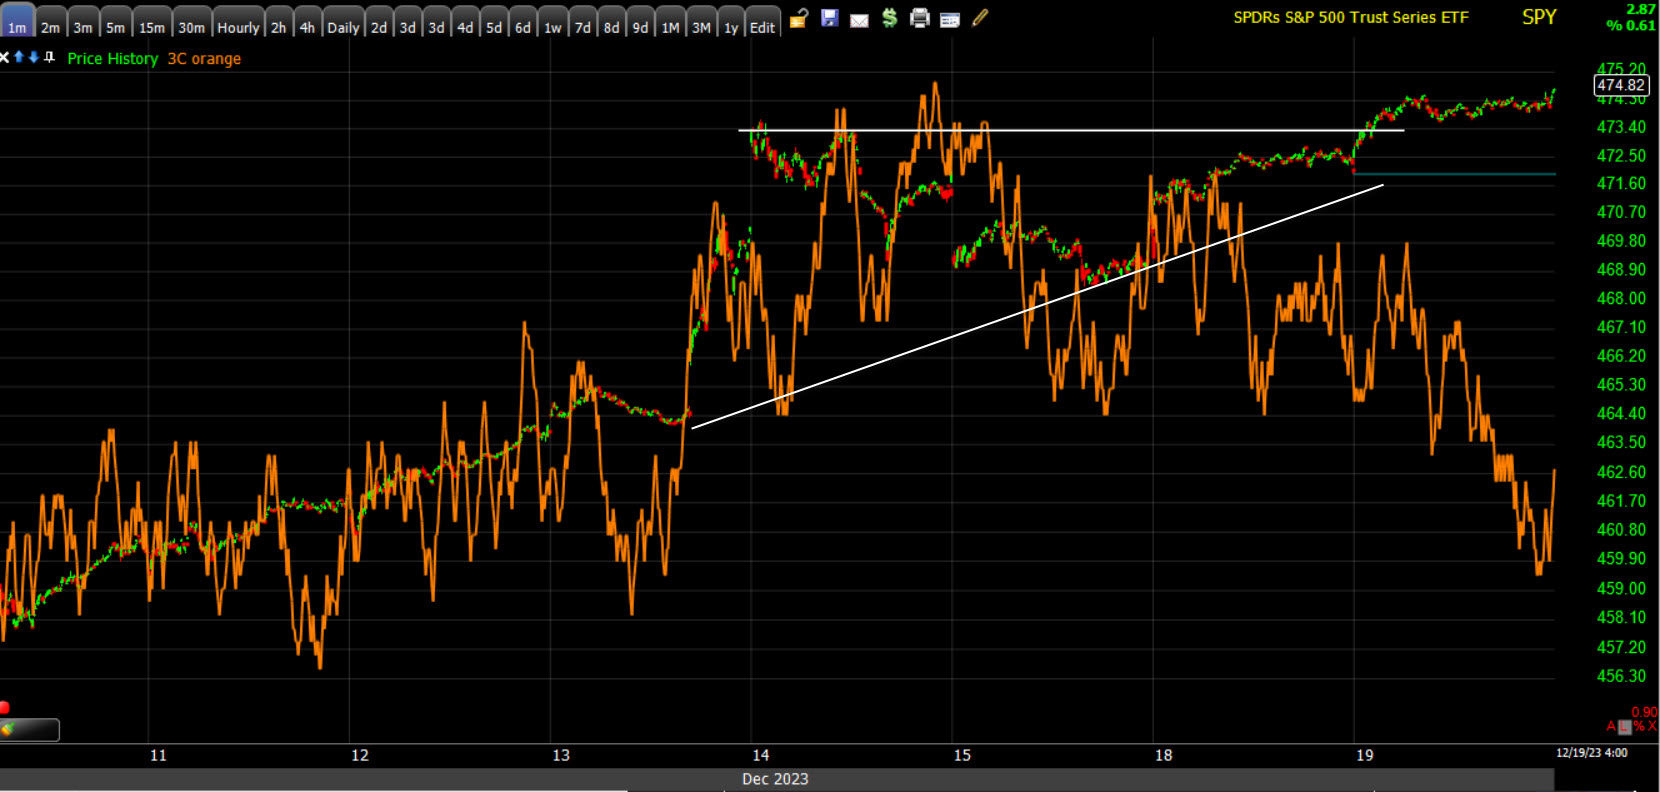 SPY (1m) – As I’ve said the past few days, if it weren’t for the breakout, I probably wouldn’t have even brought this chart up, but now it’s getting weaker and now I would certainly bring it up regardless of the breakout or not.
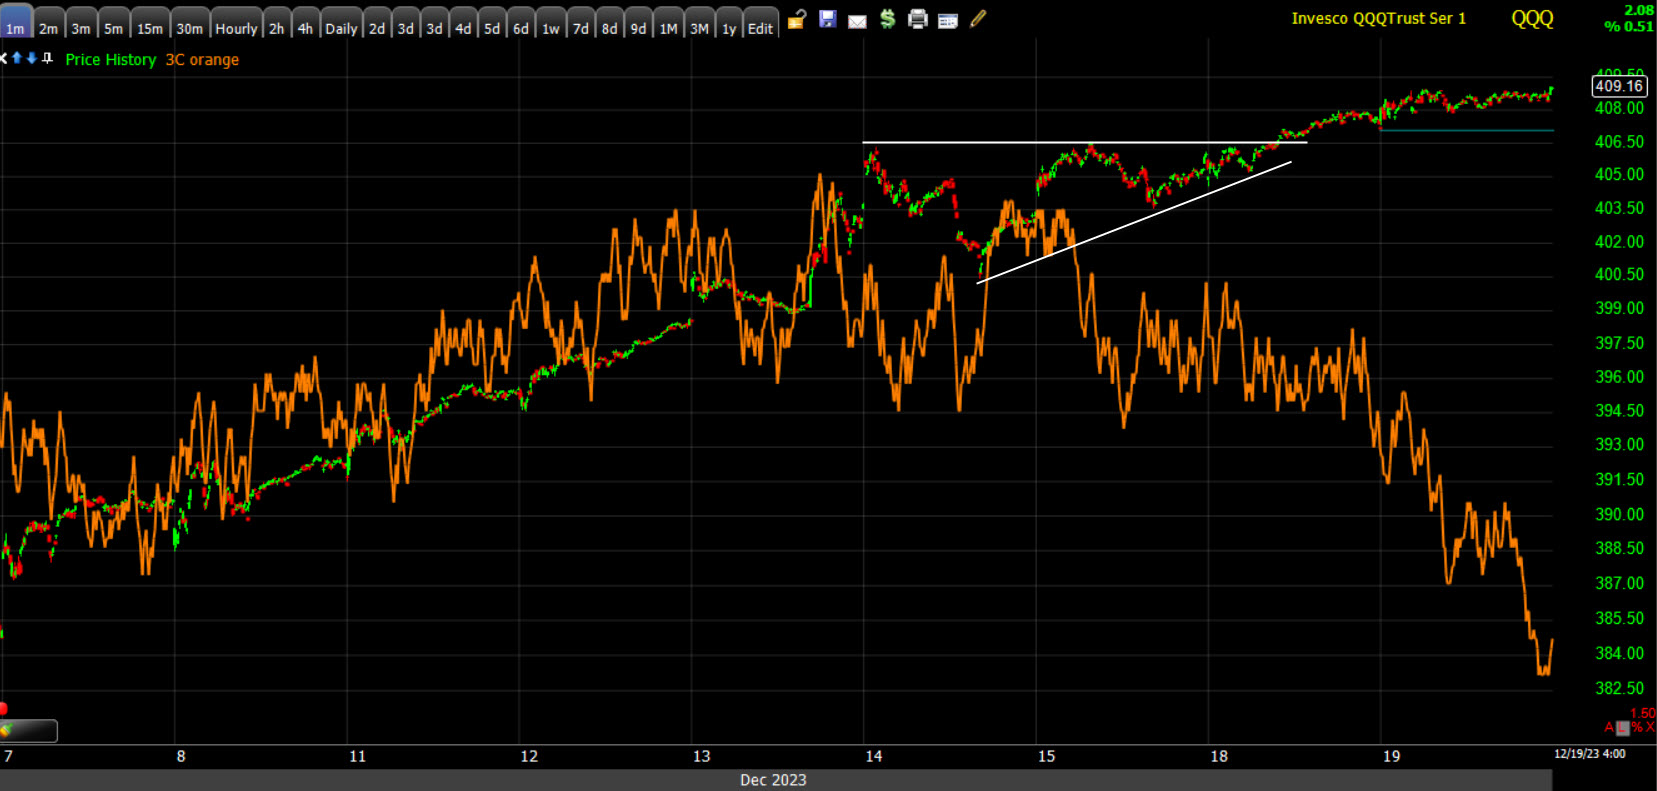 QQQ’s (1m) short term chart is getting noticeably worse. Why? I think the deep pocket buyers have disappeared and the Retail/Hedge fund traders are chasing single stocks that aren’t even in the indices. The mega-caps leadership is clearly gone. On an index level, it’s not too difficult to imagine why these charts are struggling. The dynamic is the exact opposite of the “mega-cap leadership & selling and shorting the trash stocks” that crescendoed in October.
What really matters in an increasingly speculative environment is measures of that speculation and excess. Extremes are almost always faded.
The Fear and Greed Index is in Extreme Greed. It printed in Extreme Greed at 80 on Friday for the first time of this rally off the Oct 27th low. Yesterday it printed 76 (Extreme Greed) and moved up to 80 again today (Extreme Greed). I’ve found no use for this index outside of extreme readings, but at extremes, this indicator/index is nearly always a reliable contrarian signal.
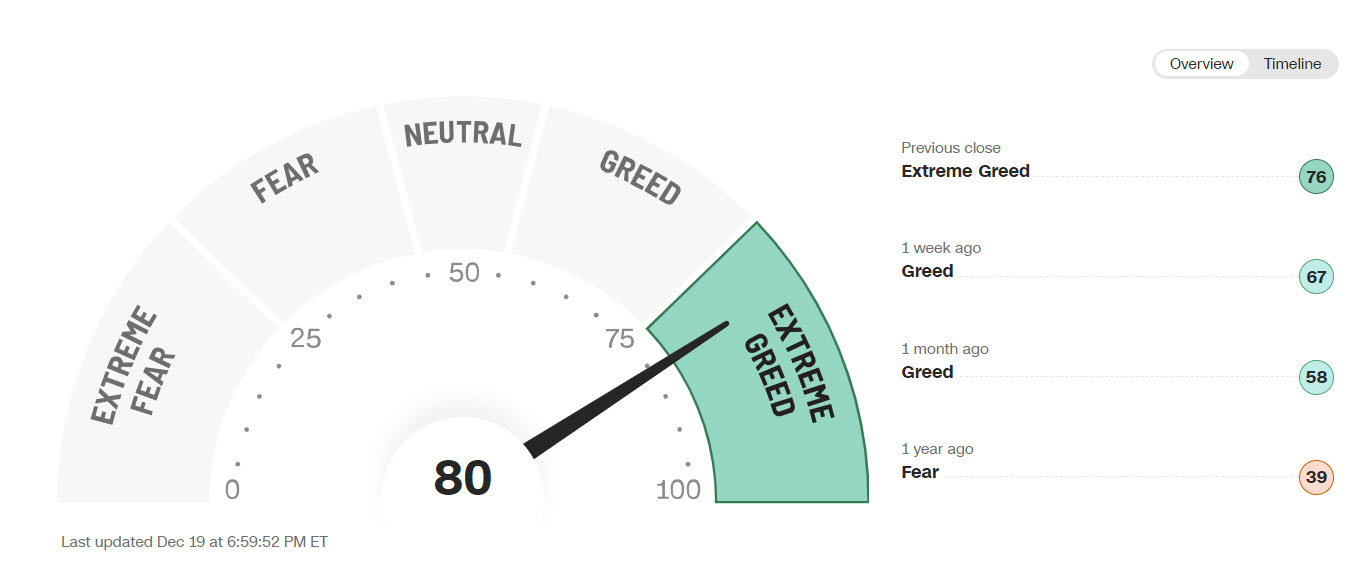
Source: CNN Markets
Here’s the timeline of the Fear and Greed Index from December 20th 2022 to present with extremes in fear and greed highlighted…
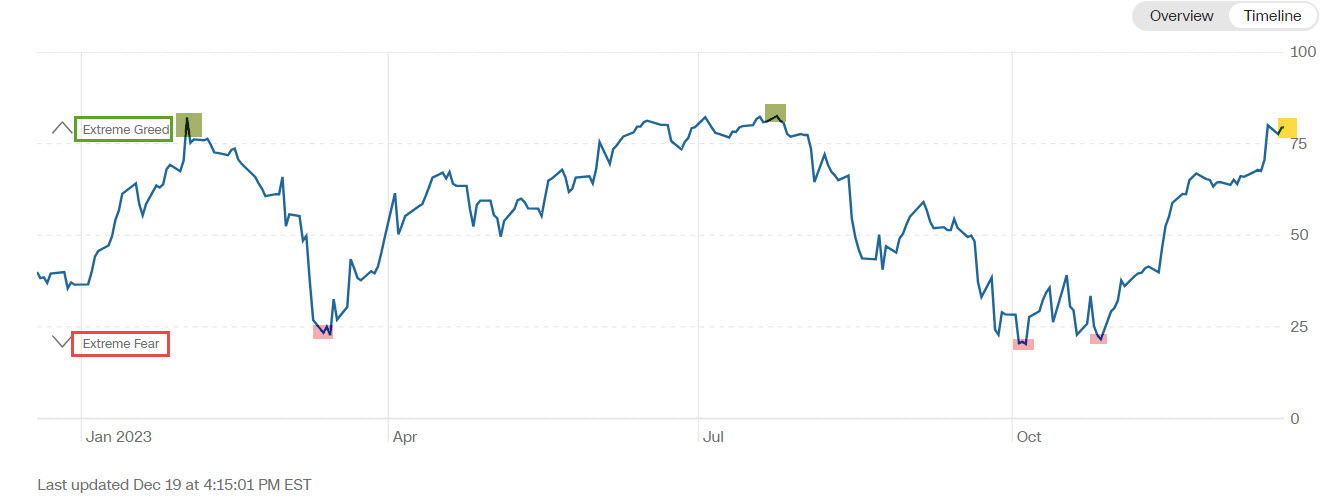 Source: CNN Markets
I wish I could overlay a chart of the S&P to illustrate how unusually reliable these sentiment extremes are. Instead, I marked up a chart of the S&P with the dates, levels and a description of each of the sentiment extremes highlighted on the timeline above. I think you’ll find this uncanny and interesting, as well as useful. Below you’ll find each of the dates and what was happening at the time.
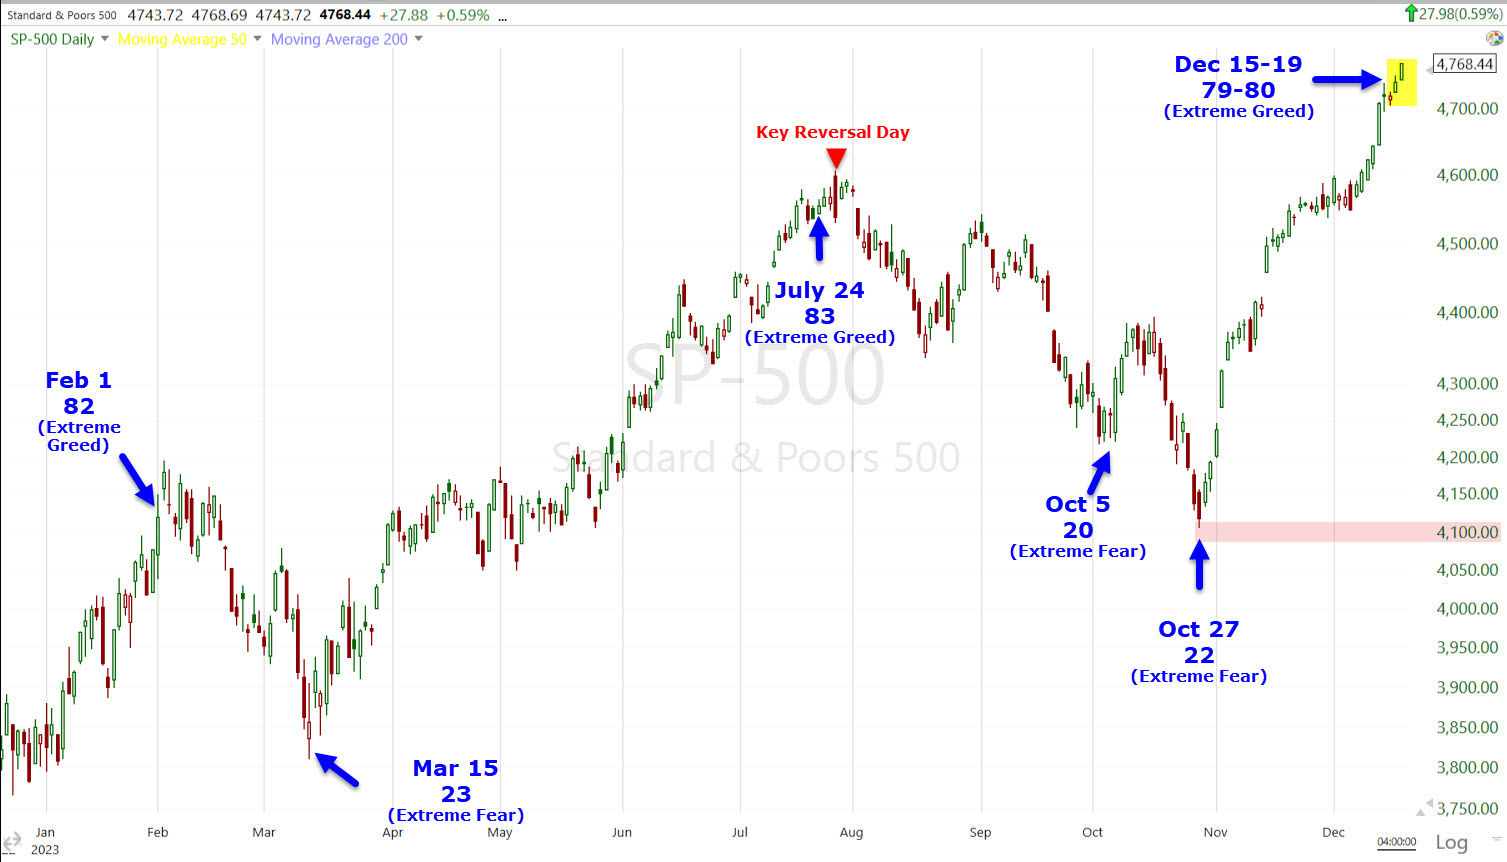
Feb 1 – Extreme Greed (82) After this reading there was one more day of gains and then the averages pulled back fairly deeply. Most averages came down -7% to -8%. Small Caps came down about -15%, but this was during a very strong stage for market breadth, and mega-caps were still building a strong head of steam. This fairly deep pull back was within the context of a lot of large bullish consolidations.
Mar 15 – Extreme Fear (23) – After the pull back from the Greed sentiment extreme, we hit extreme fear and the S&P rallied +19% right up to $4600 and the Key Reversal Day on July 27th. For at least a month before that, we could see the market detiorating, mega-caps undergoing a distribution phase and suspected some mid-sized Head and Shoulders tops were forming. This led right into the next sentiment extreme…
July 24 – Extreme Greed (83) – This reading was 3 days before the S&P’s Key Reversal Day and failure at $4600, putting in the very top of the “head” in the Head and Shoulders patterns. From there, the S&P saw a 3 month sub-intermediate downtrend, falling -10% and met its H&S measured move at $4100. The NASDAQ-100 lost a similar -11%, but Small Caps, which surpassed or overshot their H&S downside target, lost -18% by the end of this decline. Dow Transports, which also surpassed their H&S downside target, lost around -18% too. Thus, it’s not too surprising to see the Small Caps rebounding the most, as they were the most out of favor by the end of October, and had hit a strong, long zone of support going back to June of 2022, that was tested and held 3 times. This episode took the market right into the next two sentiment extremes…
Oct 5 – Extreme Fear (20) – This led to a bounce within the sub-intermediate downtrend (see below) of about +3% for the averages and up to the top of the sub-intermediate downtrend channel. The measured moves for the H&S tops were not met yet, and prices turned lower in the sub-intermediate downtrend back to the bottom of the channel, several blew out the bottom leading to my Channel Buster video which talked about how breaks of the channel like that often lead to a rubber band effect… a short squeeze. There was another sentiment extreme to come.
Oct 27 – Extreme Fear (22) – This was the day the S&P hit the H&S top’s $4100 target (S&P fell -0.1% shy of $4100 on a -10% decline, so I’d call it close enough). This was the channel buster as well, and the end of an extremely deeply oversold phase that lasted unusually long.
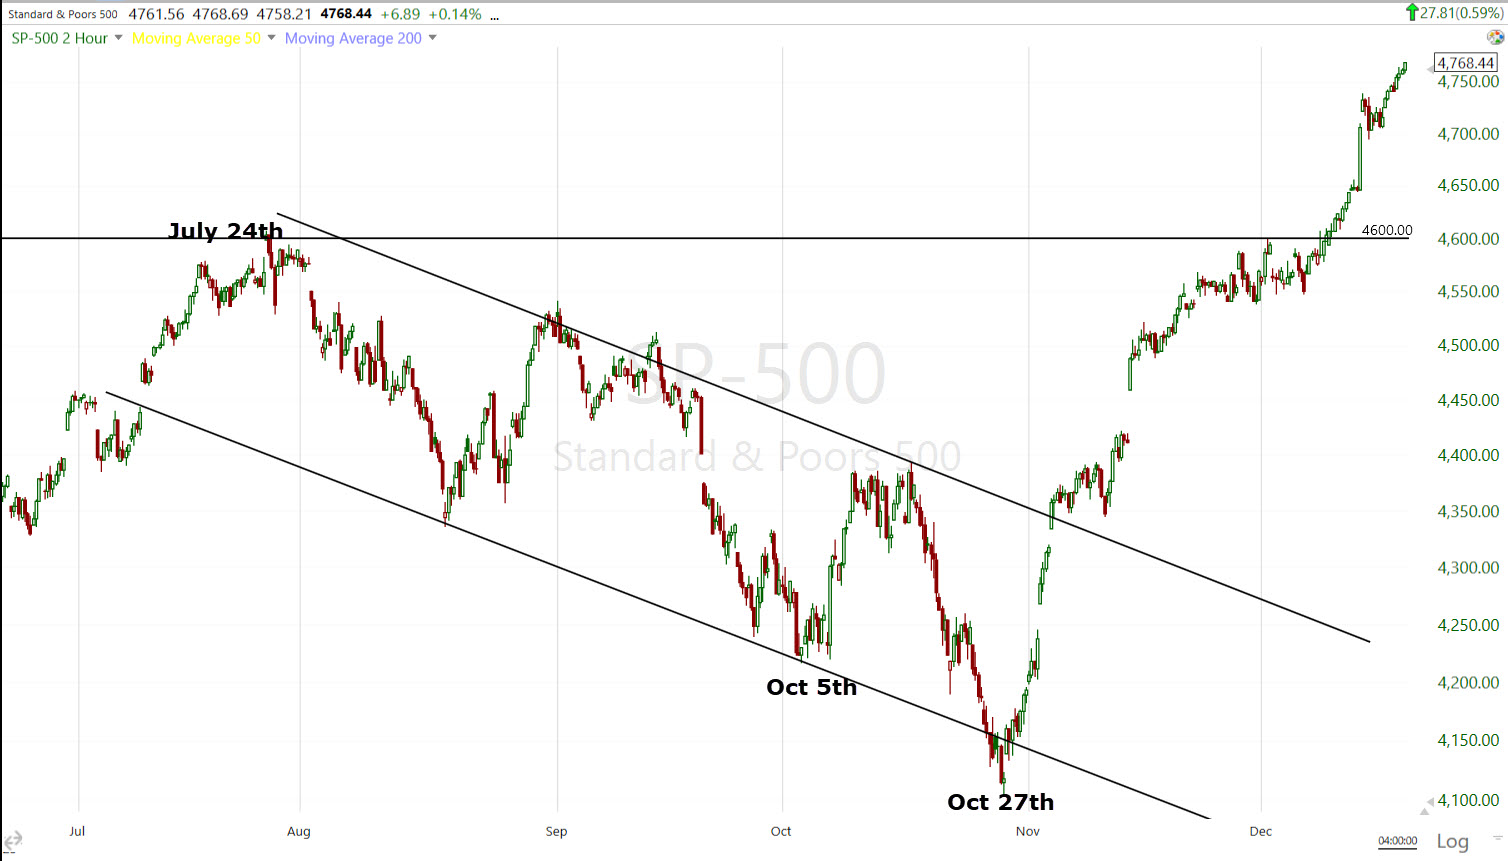 S&P-500 (2h) sub-intermediate down trend from July highs (H&S) to October 27th low (channel buster).
And now…
Dec 19 – Extreme Greed (80) Now we’re in another extremely overbought phase that’s lasted unusually long, and sentiment is moving deeper into Extreme Greed. The seasonal end of year rally/short squeeze is not like the February 1 Extreme Greed reading that led to a -7% to 15% market pull back, and onto a new high at S&P $4600. Market breadth was incredibly strong then. It was even stronger than the bull market rally of 2021. Mega-caps had outstanding support and it was growing. Even the decline from February highs was orderly and printed large bull flags in several indices. Unlike then, I cannot find evidence of rotation or organized, intelligent leadership for the market now. The only obvious source beyond liquidity, buybacks and the normal CTA chase, is short covering and now what appears to be solely the chase of those “Dash for Trash” stocks. It reminds me a lot of late 1999’s speculative frenzy.
I’m not sure when this ends, or what comes right after it, but all signs are that we are moving toward the end of a very different type of rally than anything seen in the past few years, even during the outright bull market that ran into 2021 highs. Highs that are now being tested and opening up the very real possibility of a large double top.
Remember that as dreadful as the name sounds, the Head and Shoulder top patterns of this summer were never large patterns. They were big enough to break the intermediate-trend rally’s or up trend line – which in most cases it did. I even sketched out the probability of a year end seasonal rally before the H&S tops were even complete this summer. The point is, those H&S patterns were never a big scary top that resolved the rally from 2020 lows. They were enough to break an intermediate up trend and let us see what comes next. We may have the answer brewing right in front of us in the form of double tops as we head into 2024.
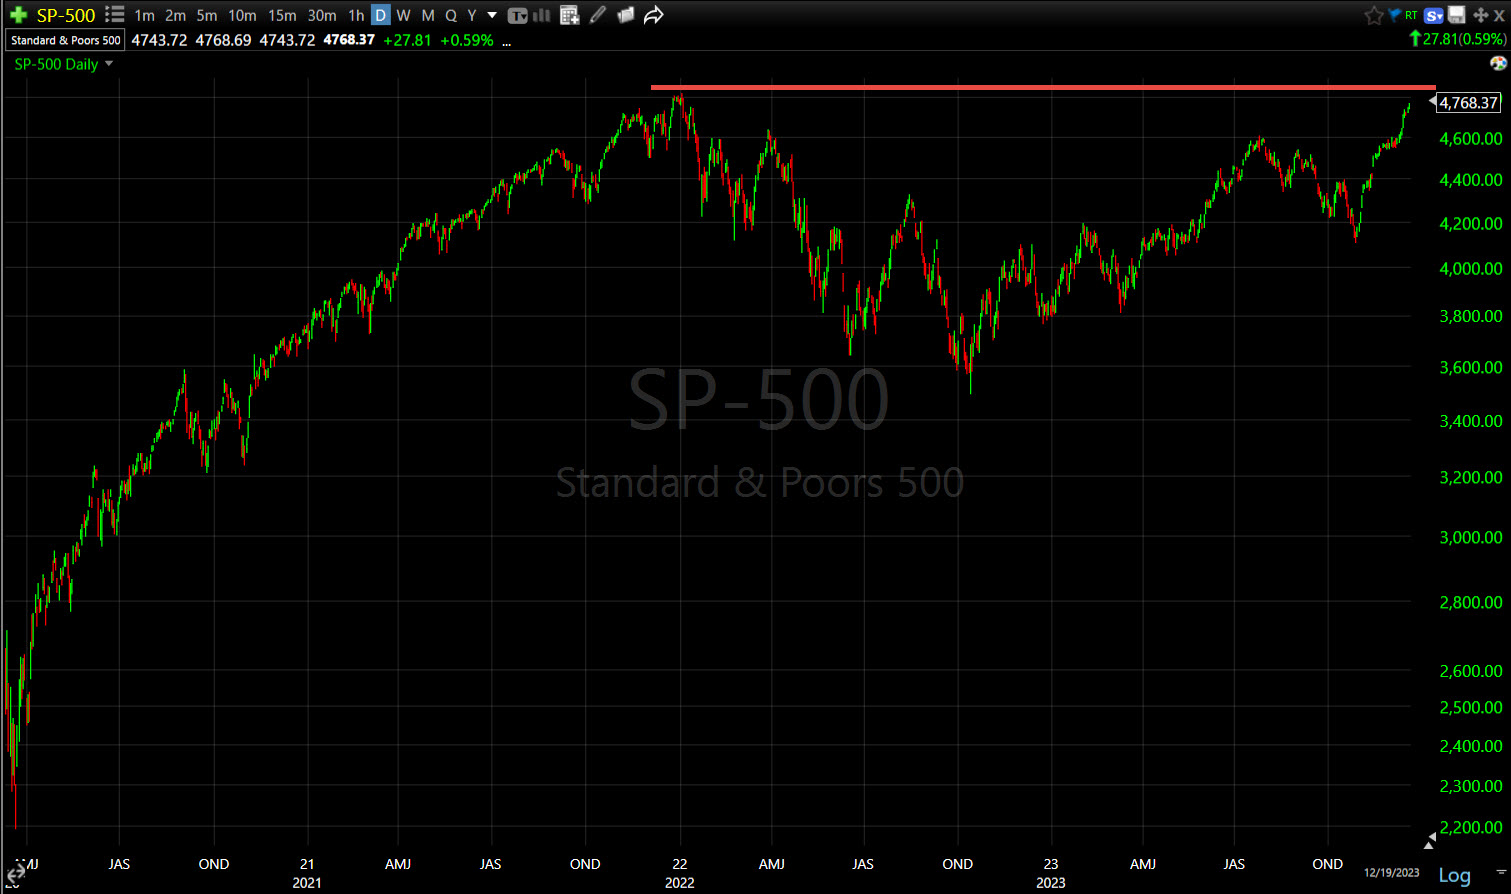
We’re not there yet, but the big picture outline looks like its being fleshed out.