Today’s downside bias in the stock market was driven by a jump in market rates, initially sparked by this morning’s Employment Cost Index for Q1. The Employment Cost Index typically isn’t a market moving data point, but this morning the ECI reflected an inflationary +1.2% increase in compensation costs versus expectations for a 1.0% increase signaling a broader pick-up in inflationary forces. This report piled onto recent worries about sticky inflation, and about the Fed pushing back its rate cut timeline. Subsequent and additional economic data this morning didn’t help. The Case-Shiller Home prices soared far more than expected, despite 30-yr mortgage rates above 7% (inflation); Chicago PMI spooked the market over more deeply faltering economic growth concerns as well as a substantial increase in Prices Paid (inflation); Consumer Confidence fell off a cliff; and the Dallas Fed survey slumped (economic growth concerns).
Chicago PMI
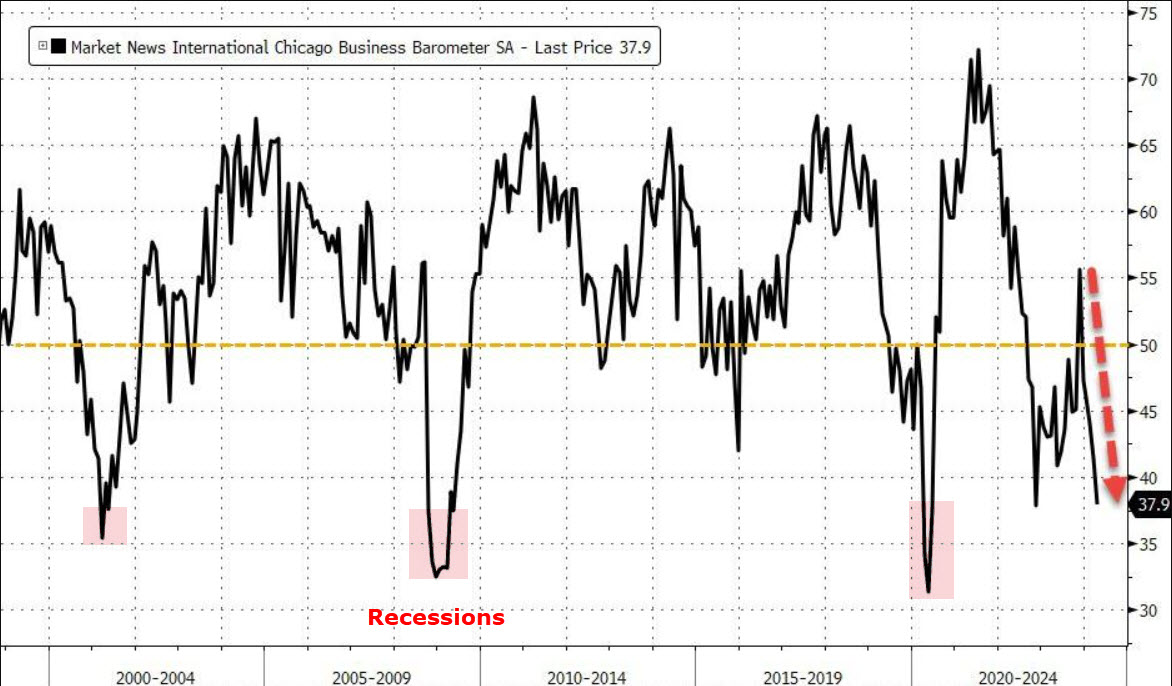
Source: Bloomberg
The morning’s data not only reinforced sticky inflation, but confirmed recent data depicting a slowdown in economic growth (Q1 GDP most notable among them), making Stagflation a legitimate and serious concern that boxes the Fed in and leaves fewer options available to the central bank. Recent economic data simply is not helpful just ahead of the FOMC tomorrow, and today’s data put an exclamation point on that fact as stocks, bonds, gold and Bitcoin sank, while rates and the Dollar rallied.
While stocks retreated all day, the final sharp move lower in front of the close was related to last minute selling into month-end and likely de-risking ahead of Amazon earnings after the close.
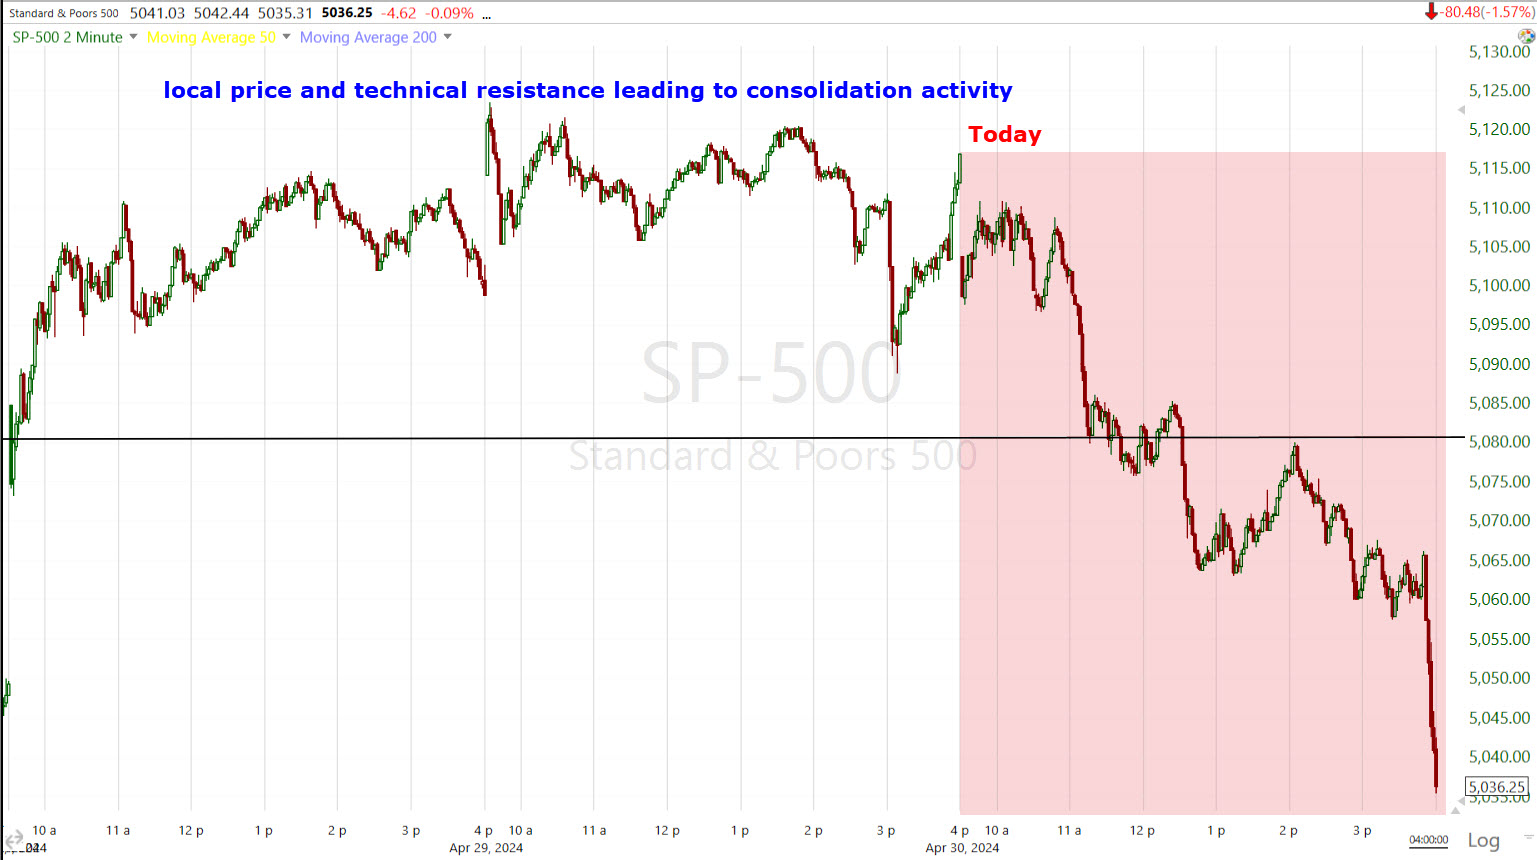
SPX (2m this week)
Just about everything participated in the broad retreat today from Momentum -1.5%, to Growth -1.7%, to Value style factors -1.4%.
Averages
Yesterday’s outperforming Russell 2000, along with Dow Transports (-2.0%) and the NASDAQ Composite (-2.0%) lost the most, trailing the S&P 500 and Dow Jones Industrial Average.
S&P-500 ⇩ -1.57 %
NASDAQ ⇩ -1.92 %
DOW JONES ⇩ -1.48 %
RUSSELL 2000 ⇩ -2.09 %
April was the first down-month for stocks since the Fed Pivot (Oct 2023). For the month of April the S&P 500 logged a -4.2% decline, the NASDAQ-100 lost -4.5% (worst month since Sept 2023), the NASDAQ Composite registered a -4.4% loss for the month, the Dow Jones Industrial Average was -5.0% lower this month, and Small Cap Russell 2000 lost the most for the month, down -6.85%.
Compare that to Chinese stocks: FXI up +5.9% in April and +15.4% since I posted the idea of an FXI long trade on February 8th. The S&P is up +0.75% and NASDAQ-100 down -1.95% over the same period.
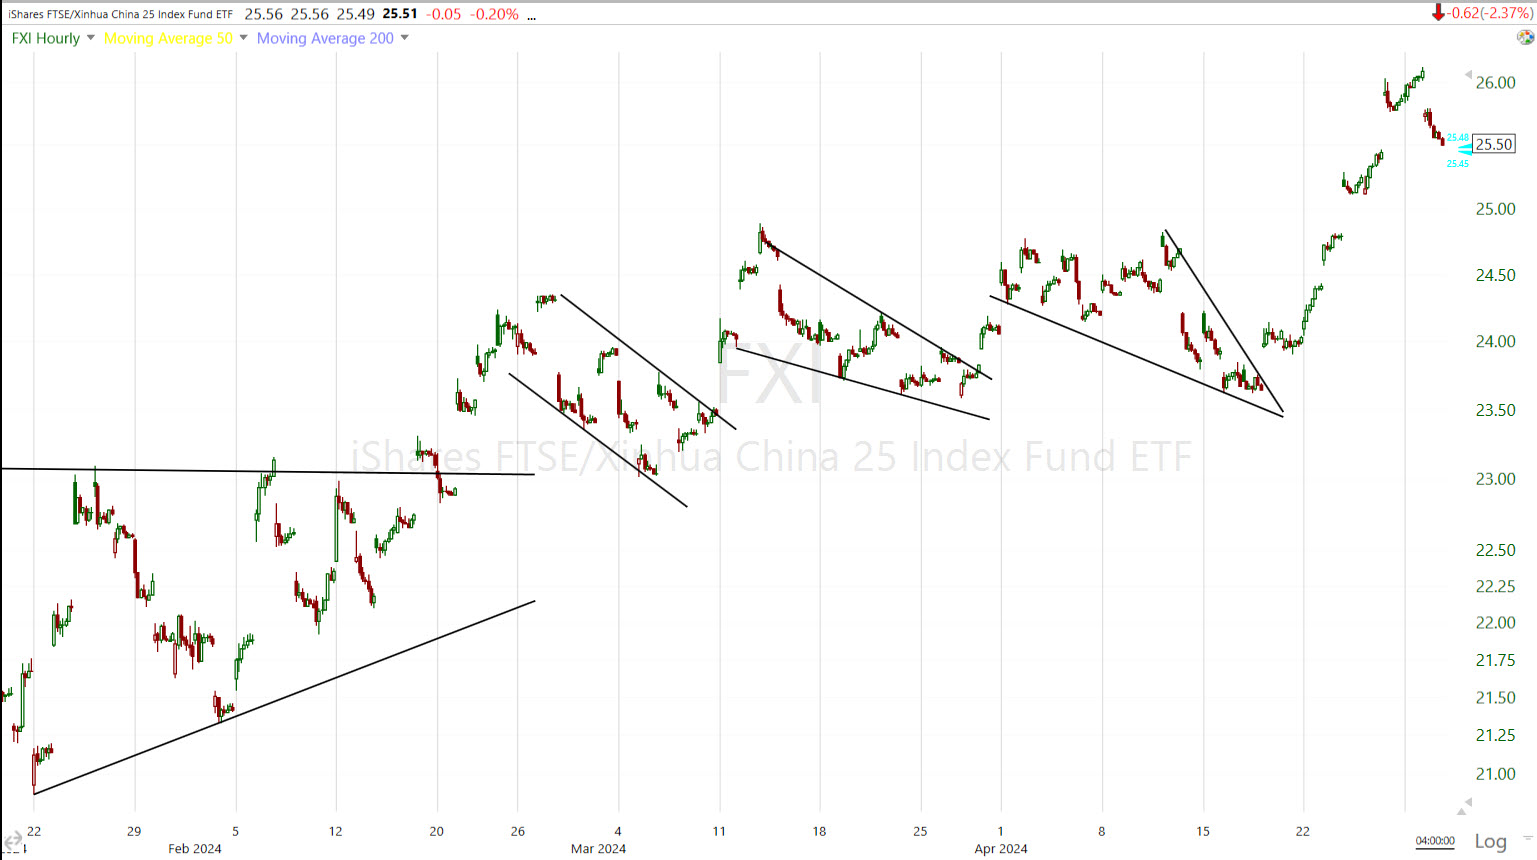 FXI (60m) first introduced before breaking out of the large bullish ascending triangle to the far left side of the price chart.
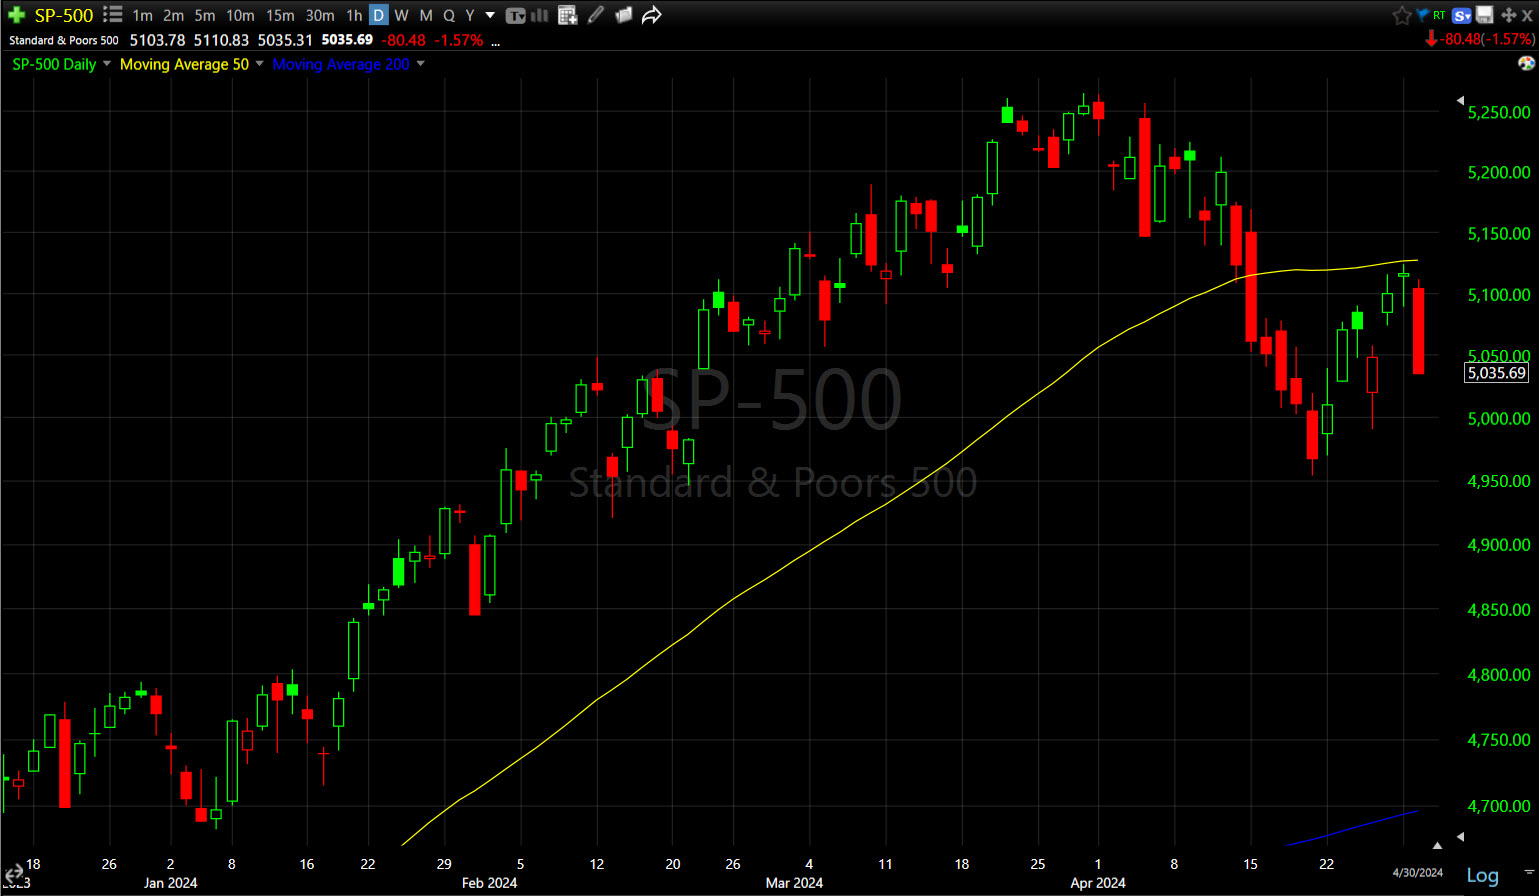 SPX (daily) with a very ugly bearish price candle on heavy volume after running into price and technical resistance yesterday. We’ll have to see what the Fed says tomorrow, but we may already have the lower high in place – the kiss of death for an up trend.
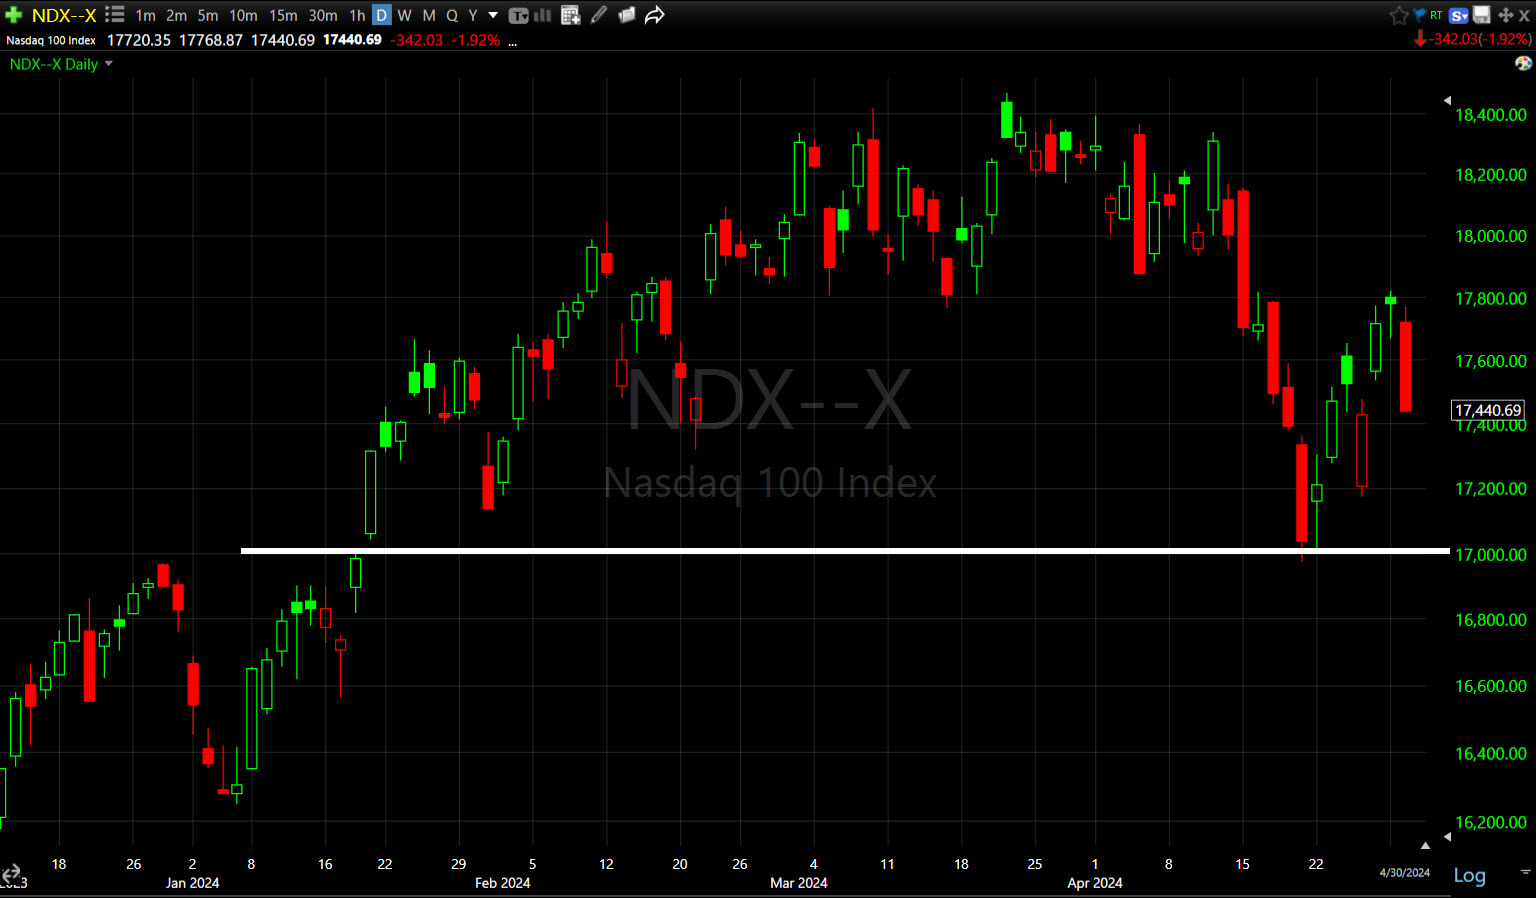 NASDAQ-100 (daily) looks like it’s forming a top with a neckline around $17k.
And look where NDX’s price was turned down…
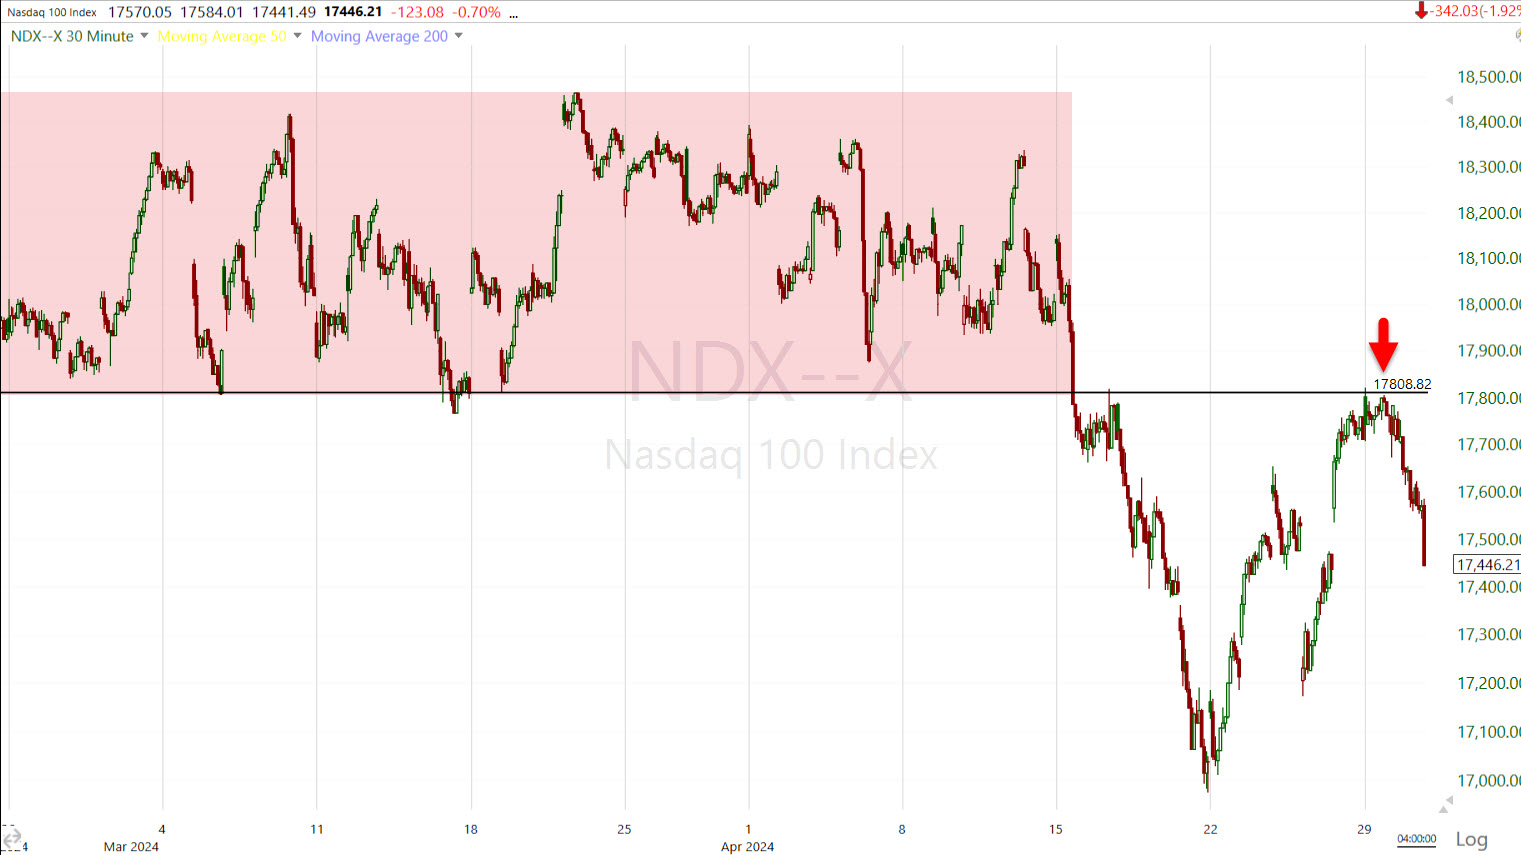 NDX (30m) – At former support of the 7-week lateral price range, now acting as resistance. That’s going to be a troublesome level for the NDX, and it’s a lower high.
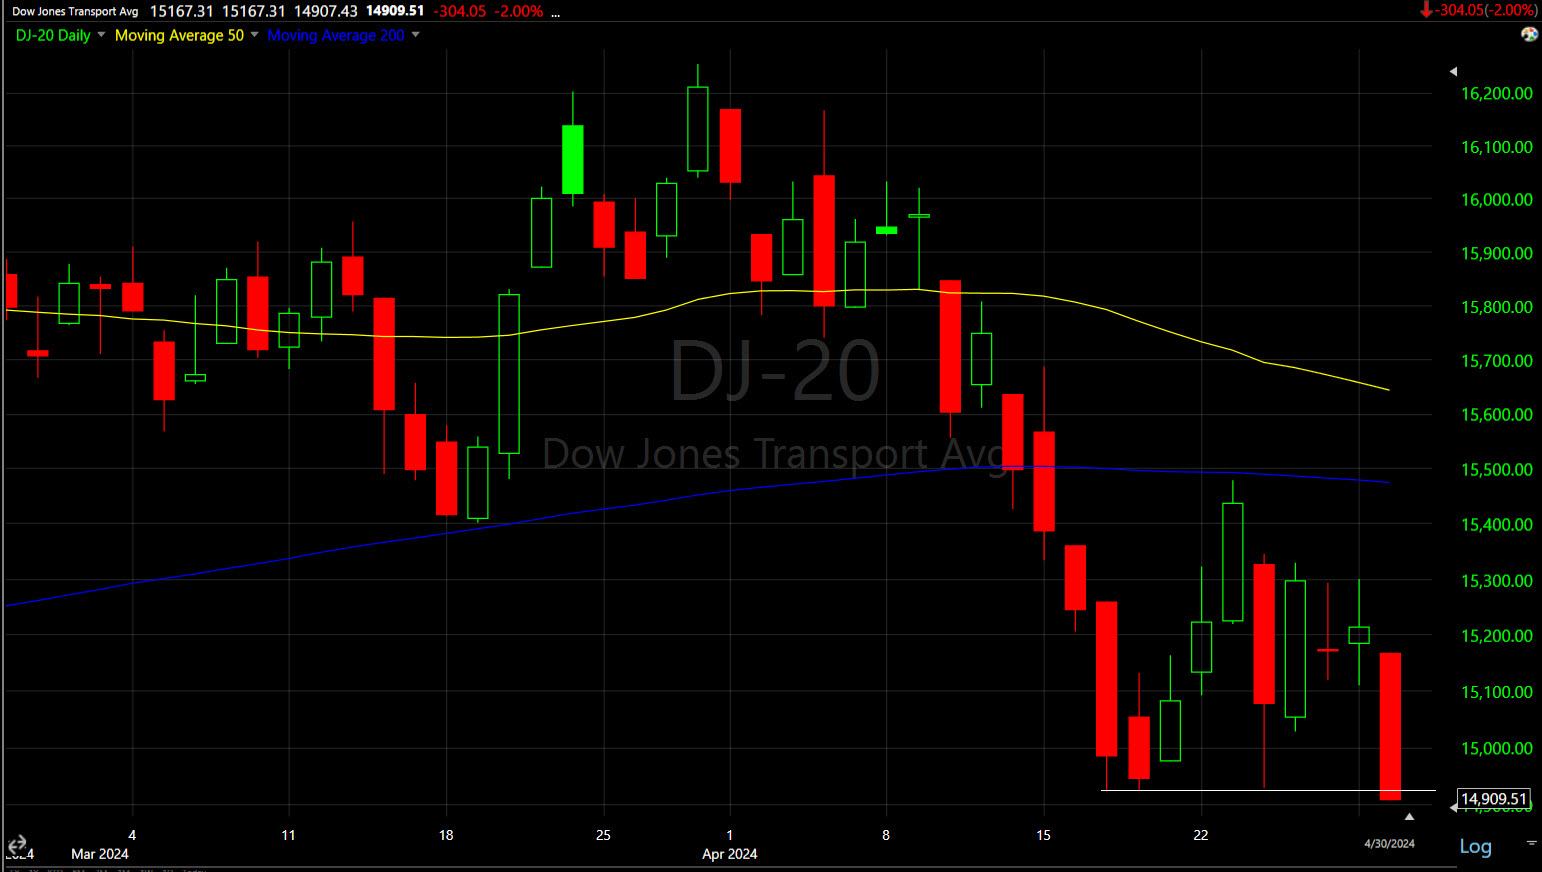 Dow Transports (daily) made a very slight lower low today, not exactly definitive, but as a leading index this is one to watch very carefully.
My Most Shorted Index dropped a the open, but saw a moderate, steady stream of covering (profit taking) through the afternoon, likely due to uncertainty of tomorrow’s risk event… the FOMC.
SPX/MSI (1m)
VIX (+6.7%) was on the relative weak side today and has come pretty close to the $14 level I anticipated price tagging a few weeks ago with a low of $14.63 yesterday. VVIX (+4.6%) was a bit more relatively weak today, likely reflecting the typical weaker volatility into the FOMC.
The Absolute Breadth index ended at 38.
S&P sectors
All 11 S&P sectors closed lower with Energy, Consumer Discretionary and Tech at the bottom of the leaderboard with losses from -2.2% to -3%. The defensive Health Care, Utilities and Consumer Staples sectors were down the least, despite a rise in market rates that most of them tend to be sensitive to, suggesting investors taking a more cautious, defensive tact.
The major indices had been holding up better this morning before some mega cap and semiconductor stocks reversed initial gains. NVIDIA (NVDA -1.5%), which was up as much as +1.2% at its high, and Meta Platforms (META -0.6%), which was up as much as +1.6% at its best level, were among the losing standouts among the two groups.
The mega-caps (MGK -1.8%) started the day outperforming the Equal Weight S&P (-1.5%) by 60 basis points, and ended the day down a similar amount.
Semiconductors (SOX) gave up an early gain of +0.75% to end the day lower by -1.95%.
Eli Lilly (LLY +6.0%), Corning (GLW +5.0%), and 3M (MMM +4.7%) were some exceptions following pleasing earnings results.
Materials ⇩ -1.82 %
Energy ⇩ -2.98 %
Financials ⇩ -0.98 %
Industrial ⇩ -1.59 %
Technology ⇩ -2.20 %
Consumer Staples ⇩ -0.44 %
Utilities ⇩ -0.52 %
Health Care ⇩ -0.07 %
Consumer Discretionary ⇩ -2.43 %
Real Estate ⇩ -1.84 %
Communications ⇩ -1.67 %
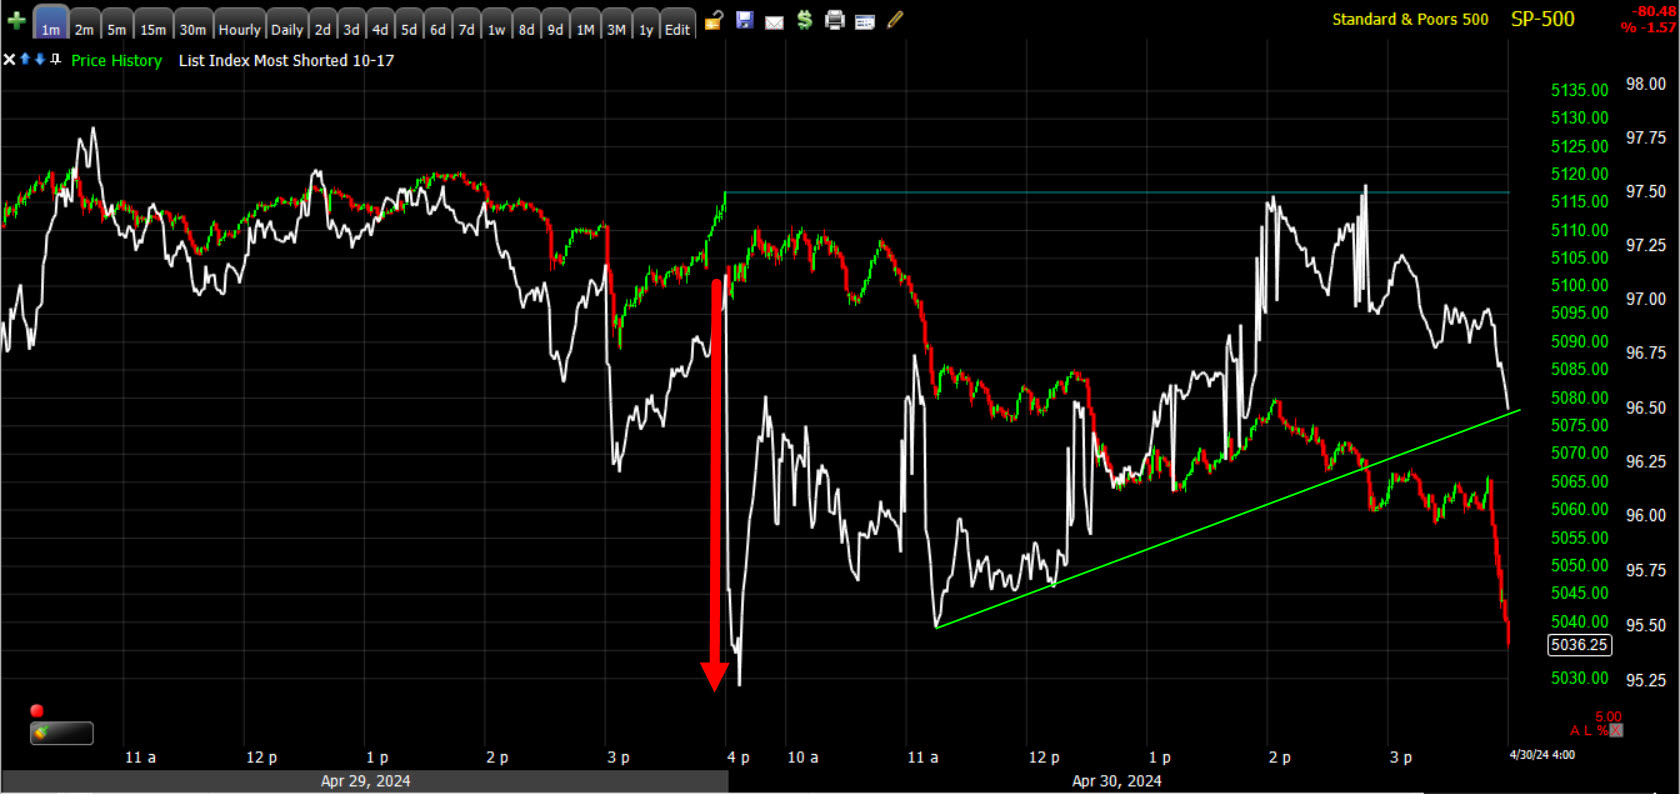
More so than mega-caps or defensive sectors, my equal weight list index of cyclical sectors saw some of the weakest performance today.
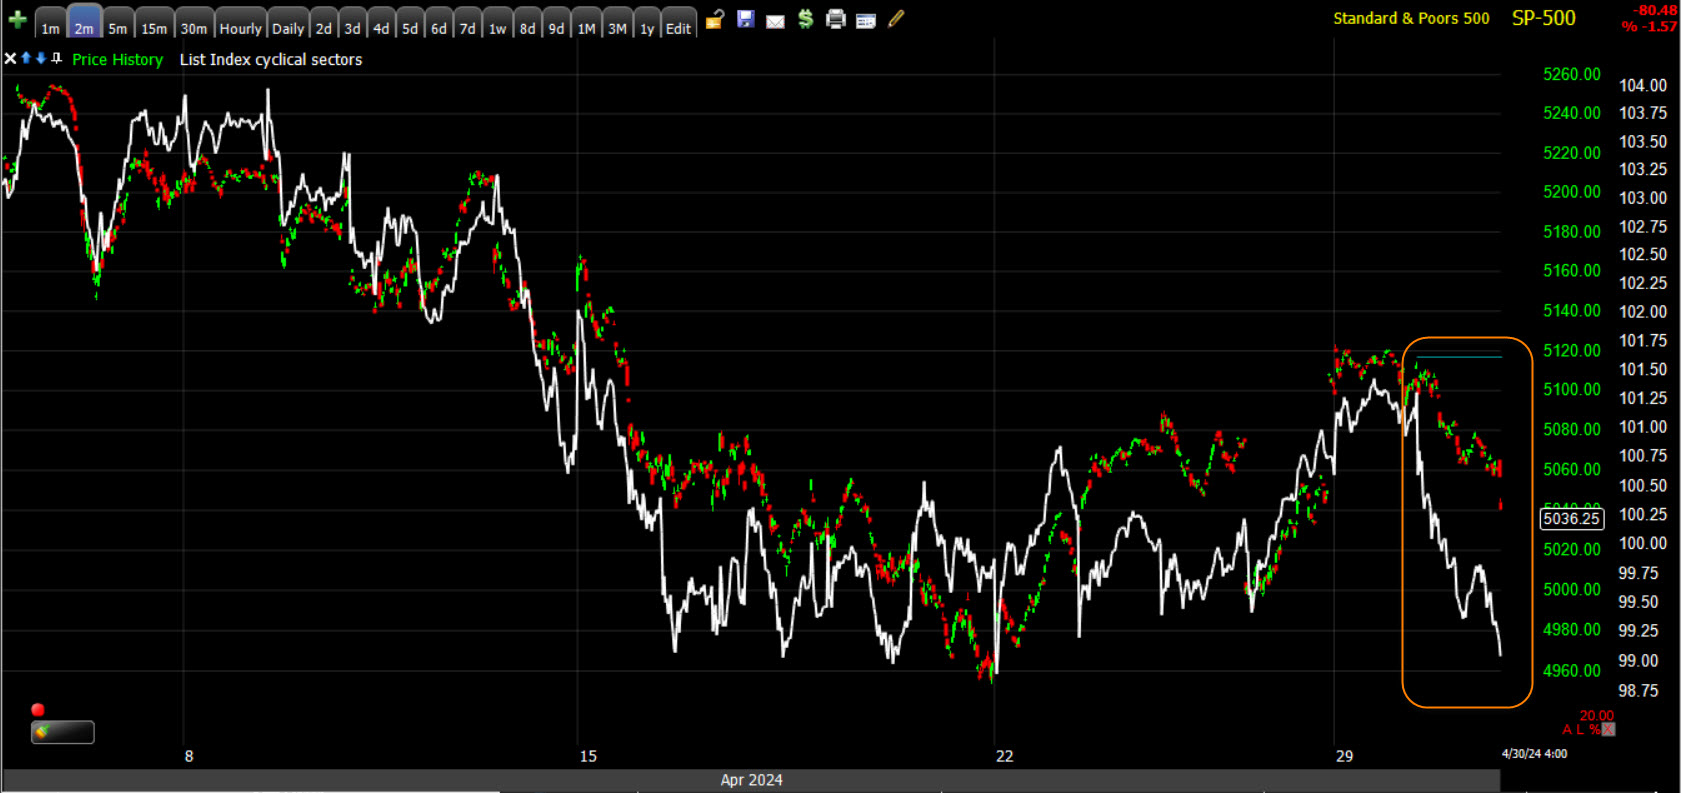 SPX (2m) and Cyclical sectors – While this could be due to month-end rebalancing dynamics, my gut feeling is that this morning’s economic data, that came in solidly stagflationary, was likely responsible. Cyclical sectors ae the ones you want to own at the start of a new economic expansion cycle and my take on the chart above is that today’s weakness in cyclicals is a reflection of investors starting to throw in the towel on hopes of a soft landing… Something I’ve noted dozens, if not hundreds of times, the Fed has always shoots for, but never achieves.
Internals
Decliners (2273) held a better than 4-to-1 edge over Advancers (479) on a notable pickup in Volume at 1.1 bln shares (largely due to month-end).
I’ve rarely seen the NASDAQ-100’s advance/decline line negatively diverge from the index. I suspect I’ve seen entire years when there wasn’t a single negative divergence, but since late February as the NDX started entering a more lateral/slideways price trend, I’ve seen it more and more often.
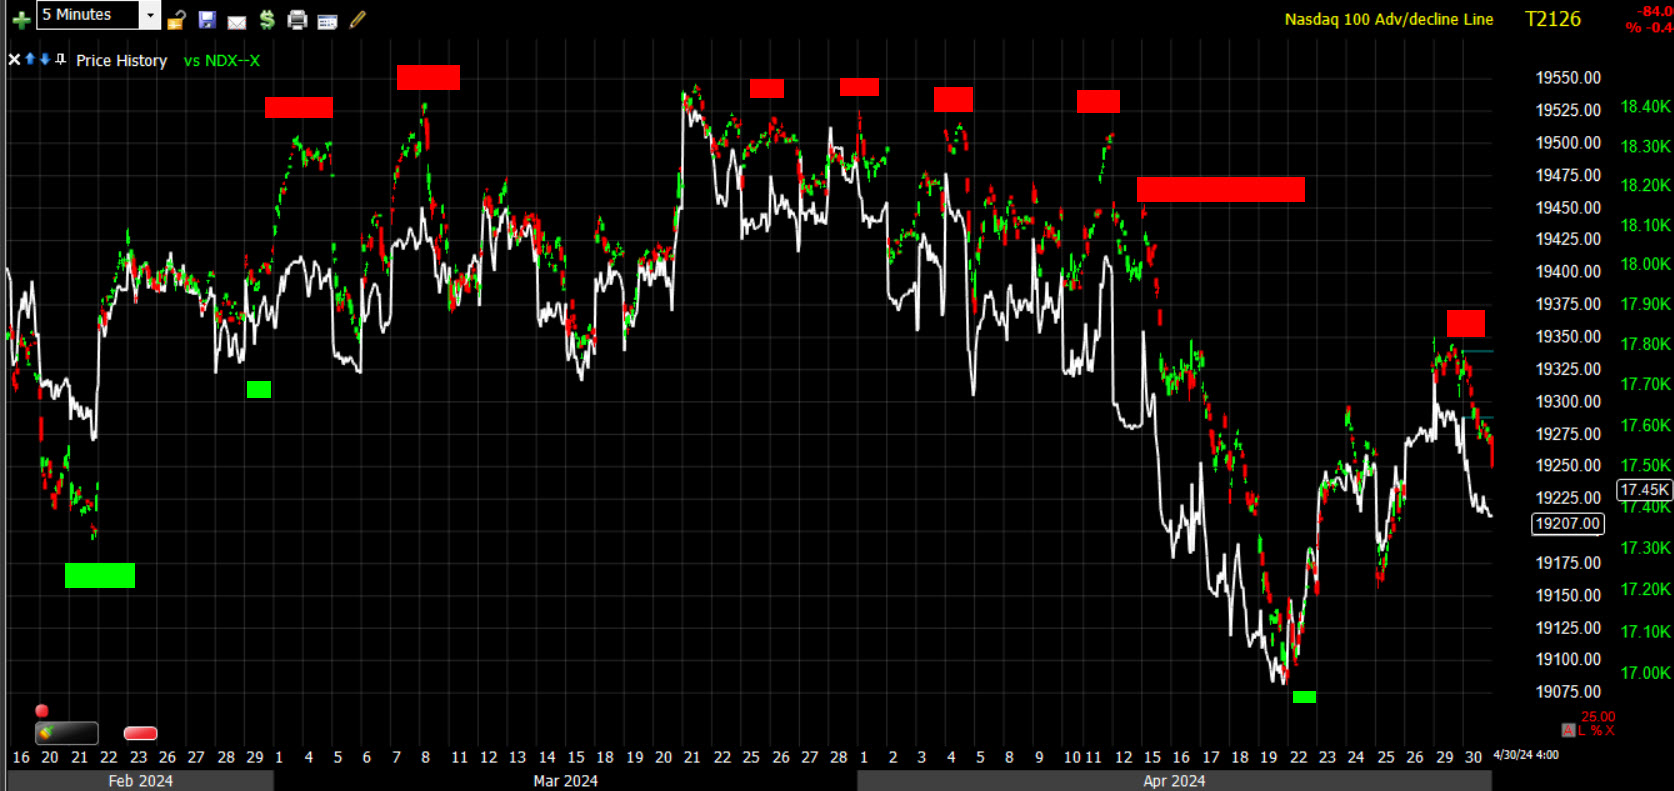 NDX (5m) and its A/D line – I suspect I’ve seen an entire year without one of these red block negative divergences, and here there’s a nest of them. While not as visually stunning as the NASDAQ Composite’s badly faltering A/D line. Negative divergences here are just straight up very rare, and this is the index full of 2024’s mega-cap and semiconductor leaders.
While it’s been much more common to see NASDAQ Composite’s A/D line negatively diverging, the extent of that divergence since the market pulled into 2021/early 2022 record highs/top is just off the charts.
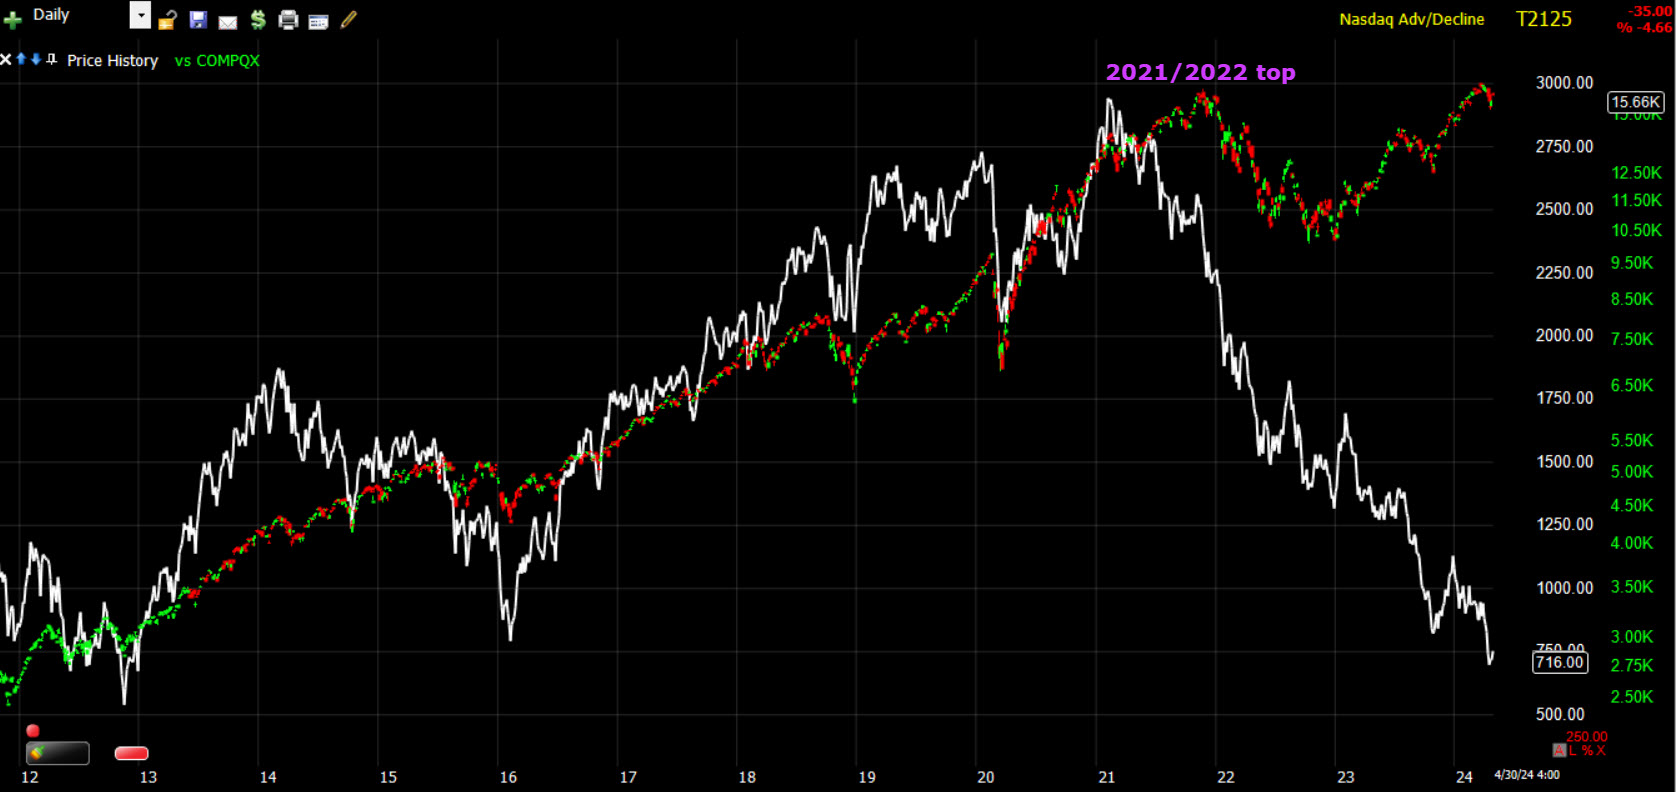 NASDAQ Composite and it’s A/D line (daily) – The mega-caps and semis have been able to hold the market together and keep it moving higher, but as they give way, there’s literally no other stocks in the market to take up their slack.
The Dominant price/volume relationship was exceptionally strong with roughly 70% of component stocks among the major averages falling into the Close Down/Volume Up category of the 4 possibilities. Internals would normally round out a strong 1-day oversold condition, but month end volume is always heavier. Still, I’d say there’s a pretty high probability of 1-day oversold internals (75%).
Breadth oscillators went from the 80’s yesterday, back down into short-term oversold territory at 19 today.
Treasuries
The 2-yr yield, which is most sensitive to changes in the Fed funds rate, settled eight basis points higher, breaking out above 5.00% at 5.05% after having tested 5.00% numerous times recently.
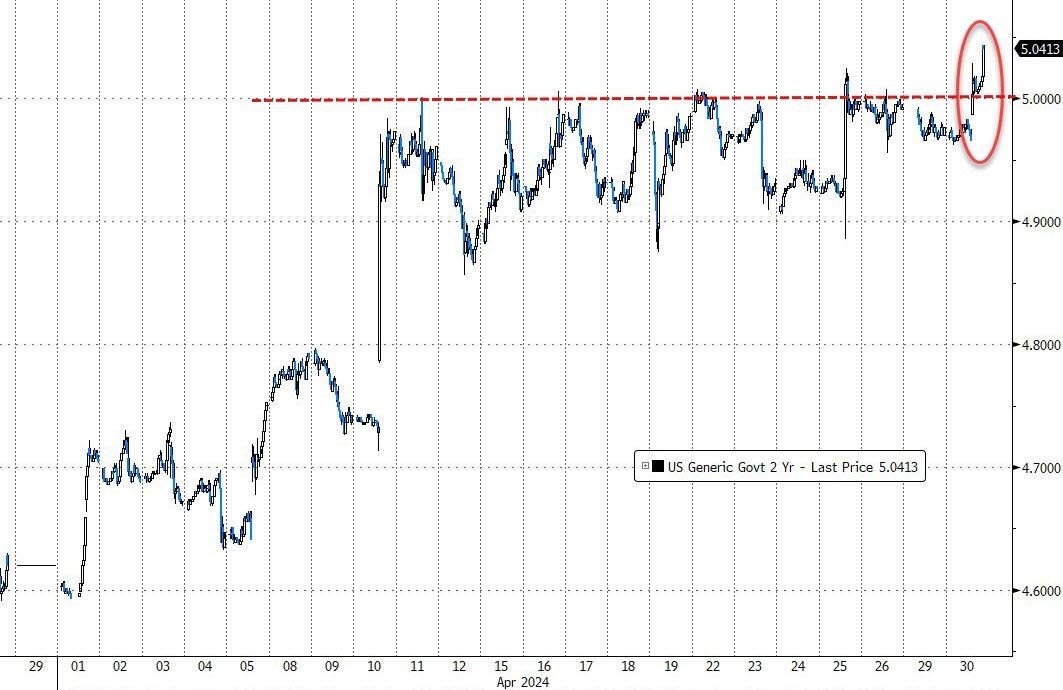
2-yr yield
The 10-yr yield, which already broke out a week ago and has pulled back subsequently, settled seven basis points higher at 4.69%, just below the definitive 4.70% level.
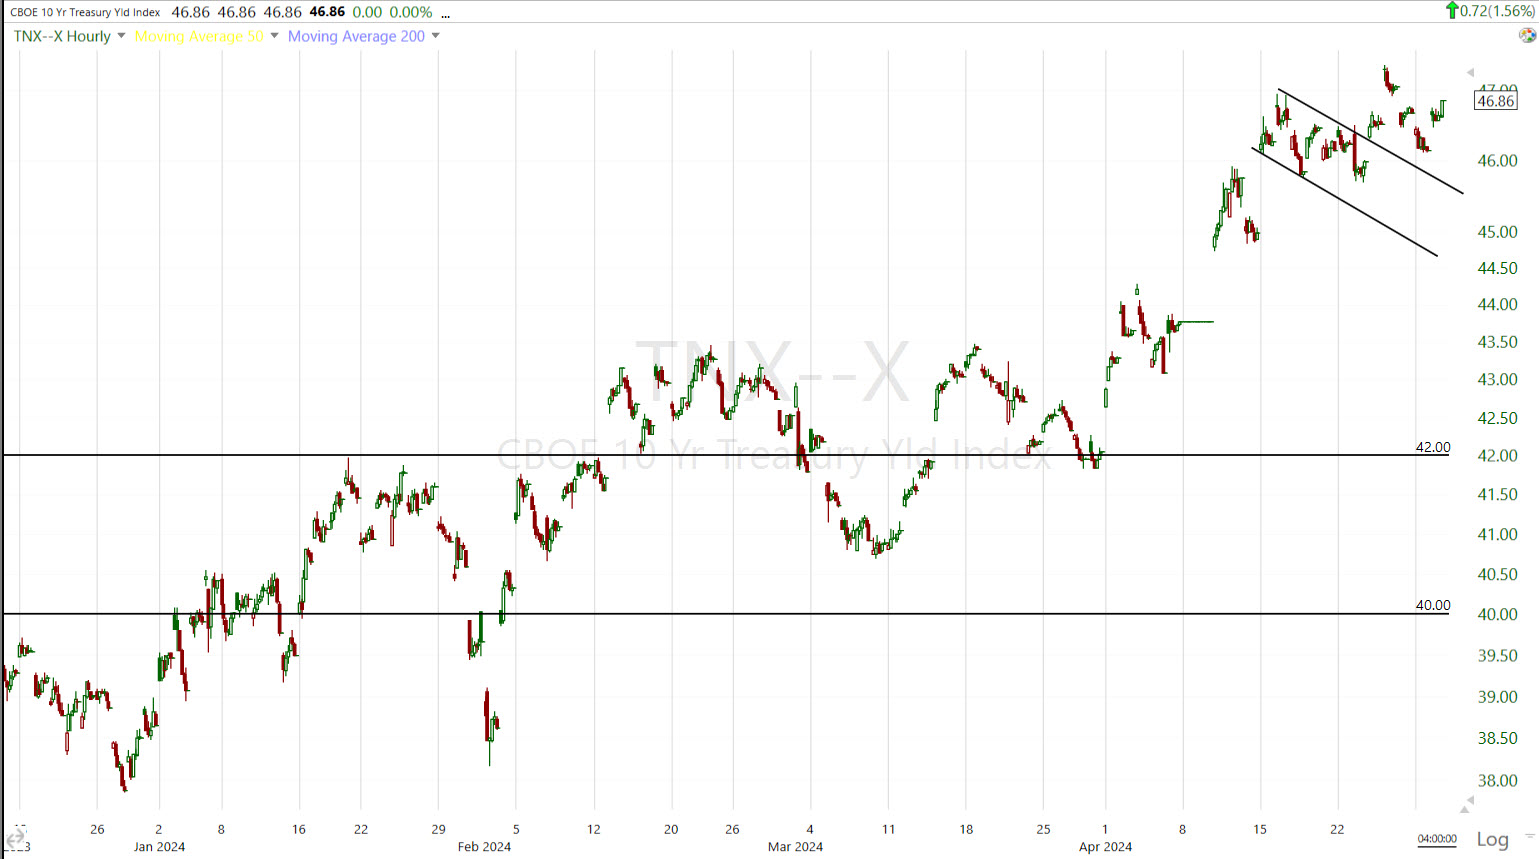 10-yr (60m) after the decline from October highs supported the equity rally into December, rising rates in 2024 are a literal depiction of the reflationary bump we’ve been following since Crude oil first showed signs of reversing its decline in mid-December.
The 10-yr yield is up 45 bps for the month of April. Historically a 60 bp jump in the 10-yr over a 30-day period has had a strong tendency to shock stocks lower (Oct. 2018’s SPX -20% crash).
Currencies and Commodities
The U.S. Dollar Index gained +0.6% on the hot inflation data, ending the day just starting to breakout of the 2.5 week bull flag consolidation…
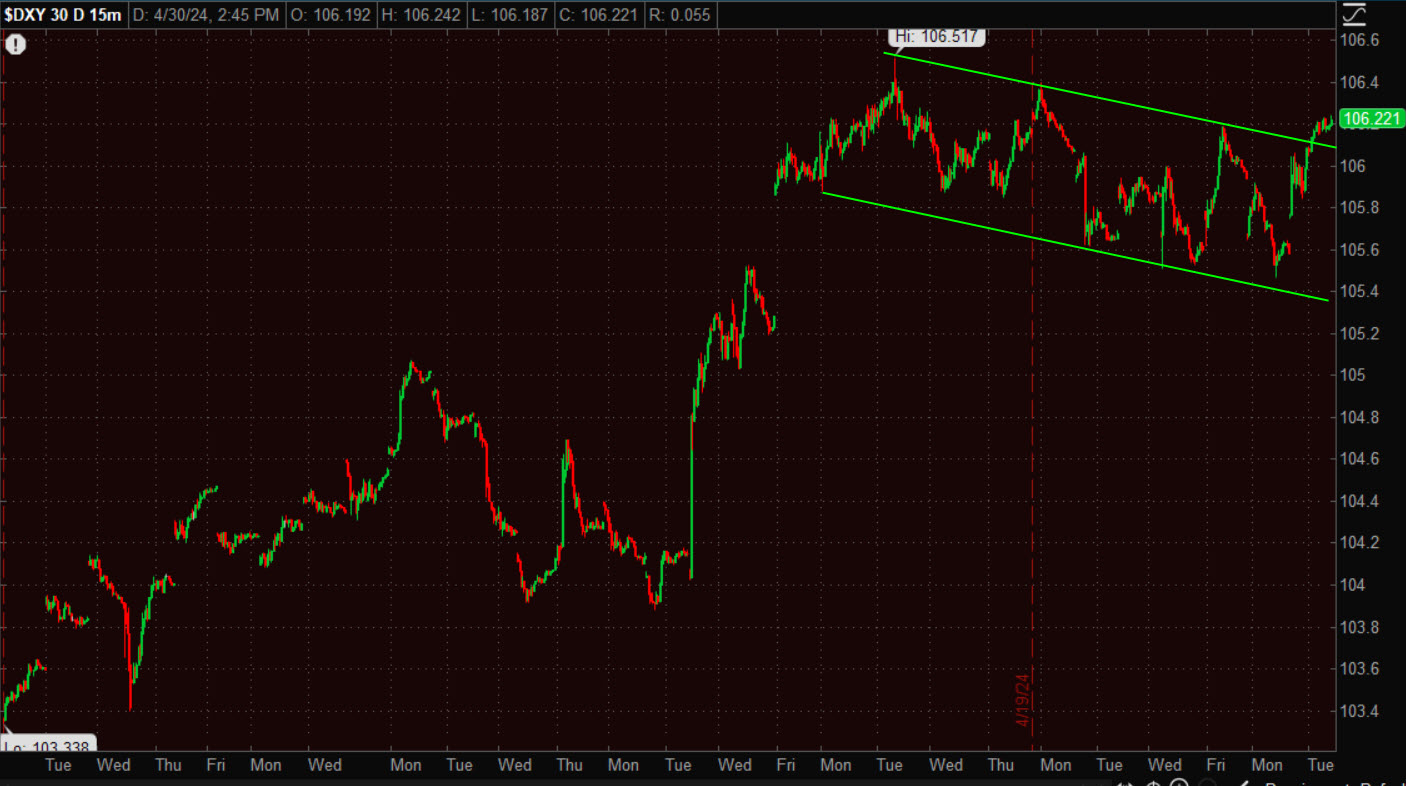 Dollar (15m)
…and up for the 4th consecutive month in stark contrast to equity market gains over most of the same period.
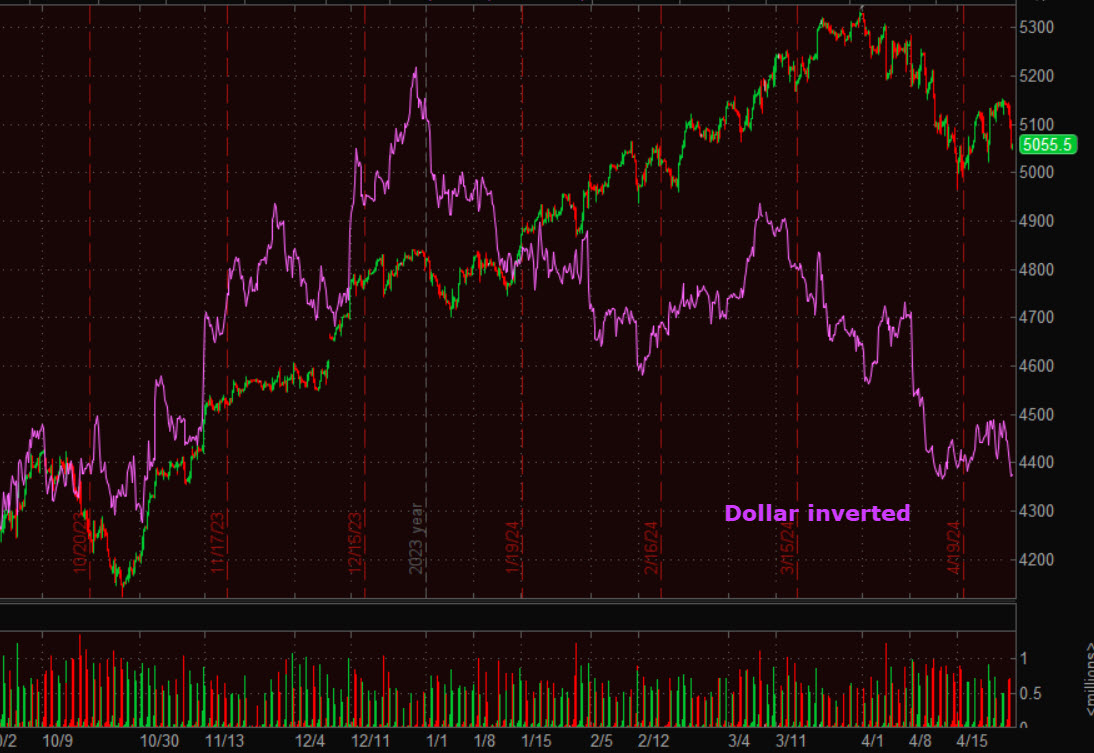 S&P futures (4H) and Dollar (inverted) – In other words, stocks have ignored the reflation impulse, the Dollar has not and is leading stocks lower.
As shown last night, Copper has soared (inflationary), up around +14% to two year highs as the reflation impulse reemerged.
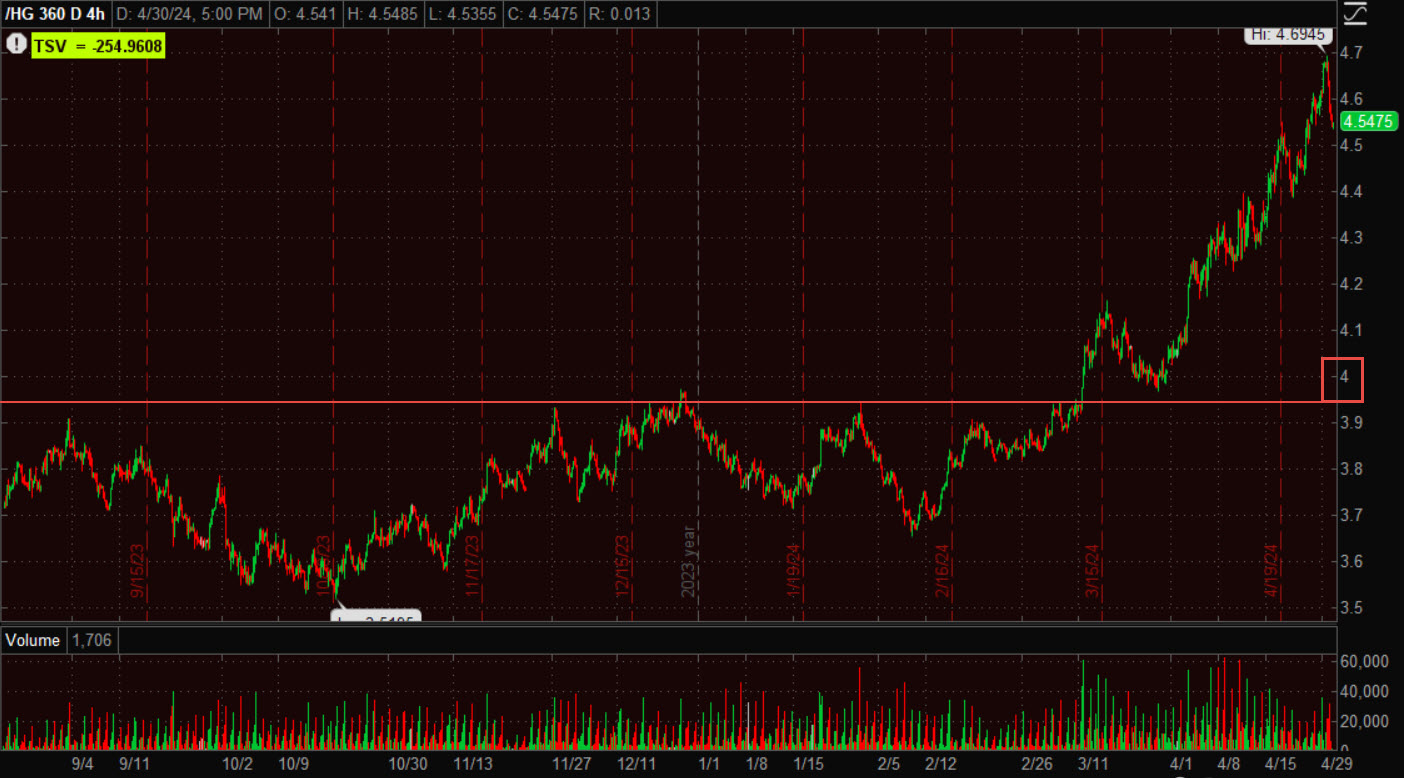 Copper futures (4H) trading above $4 which is pretty rare for copper. Some will say higher copper prices ae because of AI demand, but it doesn’t really matter why, it’s inflationary.
Gold futures settled lower by -2.3% to $2,302.90/oz, but still up about +2.9% on the month to take YTD gains to about +11.2%. Gold was was pressured today specifically by rising bond yields and a stronger dollar ahead of the FOMC’s policy decision tomorrow afternoon. In other words, gold’s inverse correlation with yields and the Dollar from March 2022, that it has been ignoring the last couple of months (like stocks), seems to be coming back.
Here’s an excerpt from the Early Update,
“As posted last night, “Gold is still not settled into a consolidation and at risk for further downside until it does.”
Gold futures are down -2.15% and close to trading under $2300 at $2307.
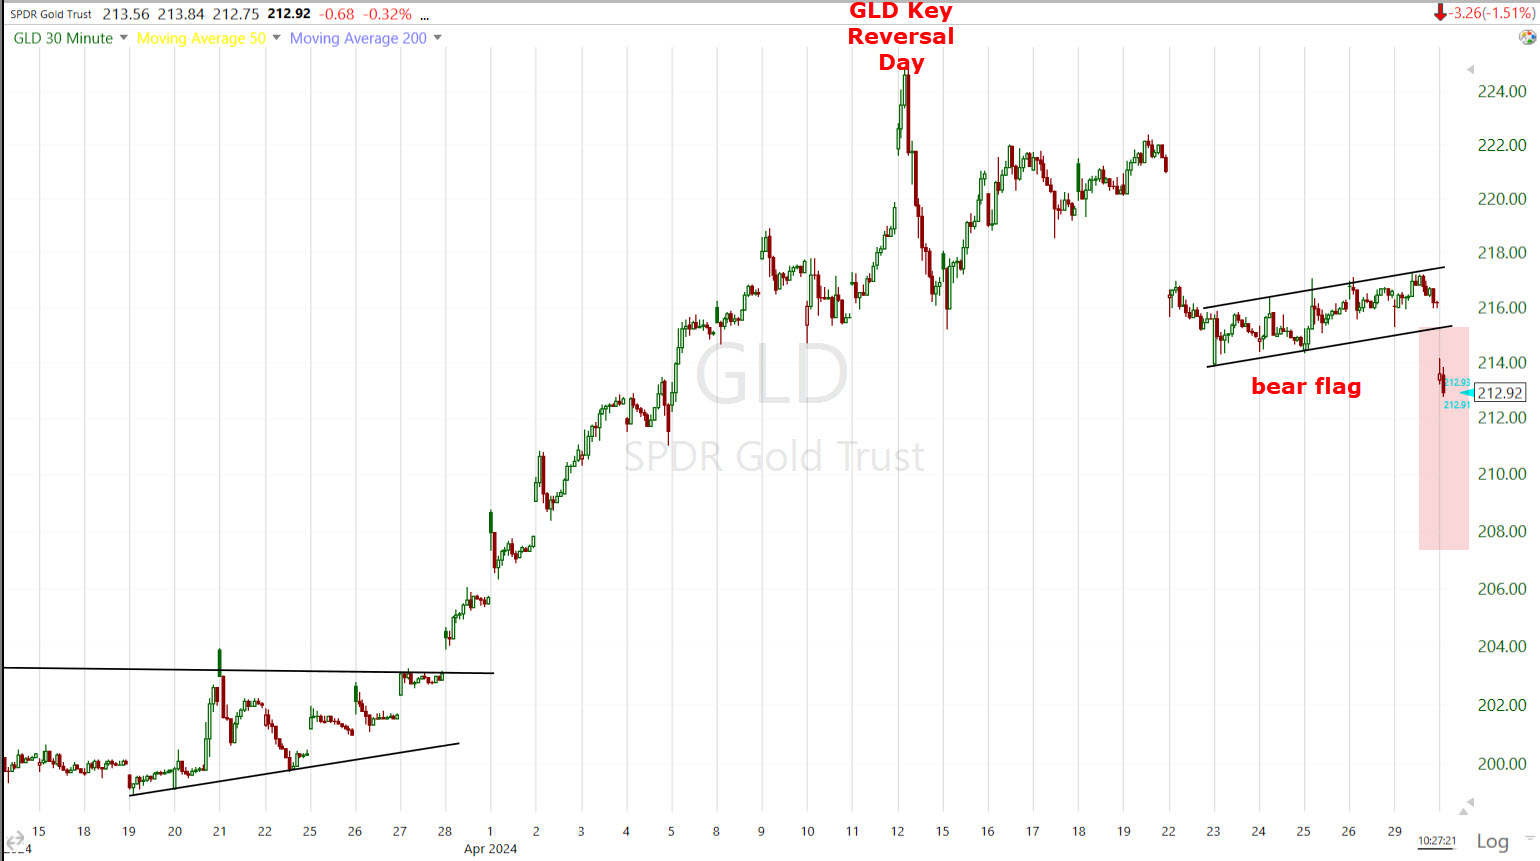 GLD (30m) – The measured move on this second leg down is -3.5%, with roughly another -2.1% of downside to go from this morning’s levels.”
From the close, gold’s measured move has just about another -2% of downside to go.
Bitcoin lost about -15% in April, but remains in a range (consolidation or top I’m not quite sure yet).
Summary
The two primary metrics that go into macro economic analysis are Growth and Inflation. Inflation has been on a steady rise throughout 2024, and more recently economic growth has been slumping at an accelerating pace. That is the literal definition of stagflation and it’s a central bank’s nightmare scenario as it constrains central bank policy. Anything they do to try to tame inflation exacerbates slowing economic growth; and anything they do to address slowing growth exacerbates inflation.
I’m not certain that the market’s oversold rebound is over. Today was ugly, but other than the Dow and Dow Transports, we still have a short-term up trend of higher highs/higher lows since CTA selling dried up. We’ll want to be watching those short term trends closely for a trend change and Dow Transports for a more definitive break of recent lows.
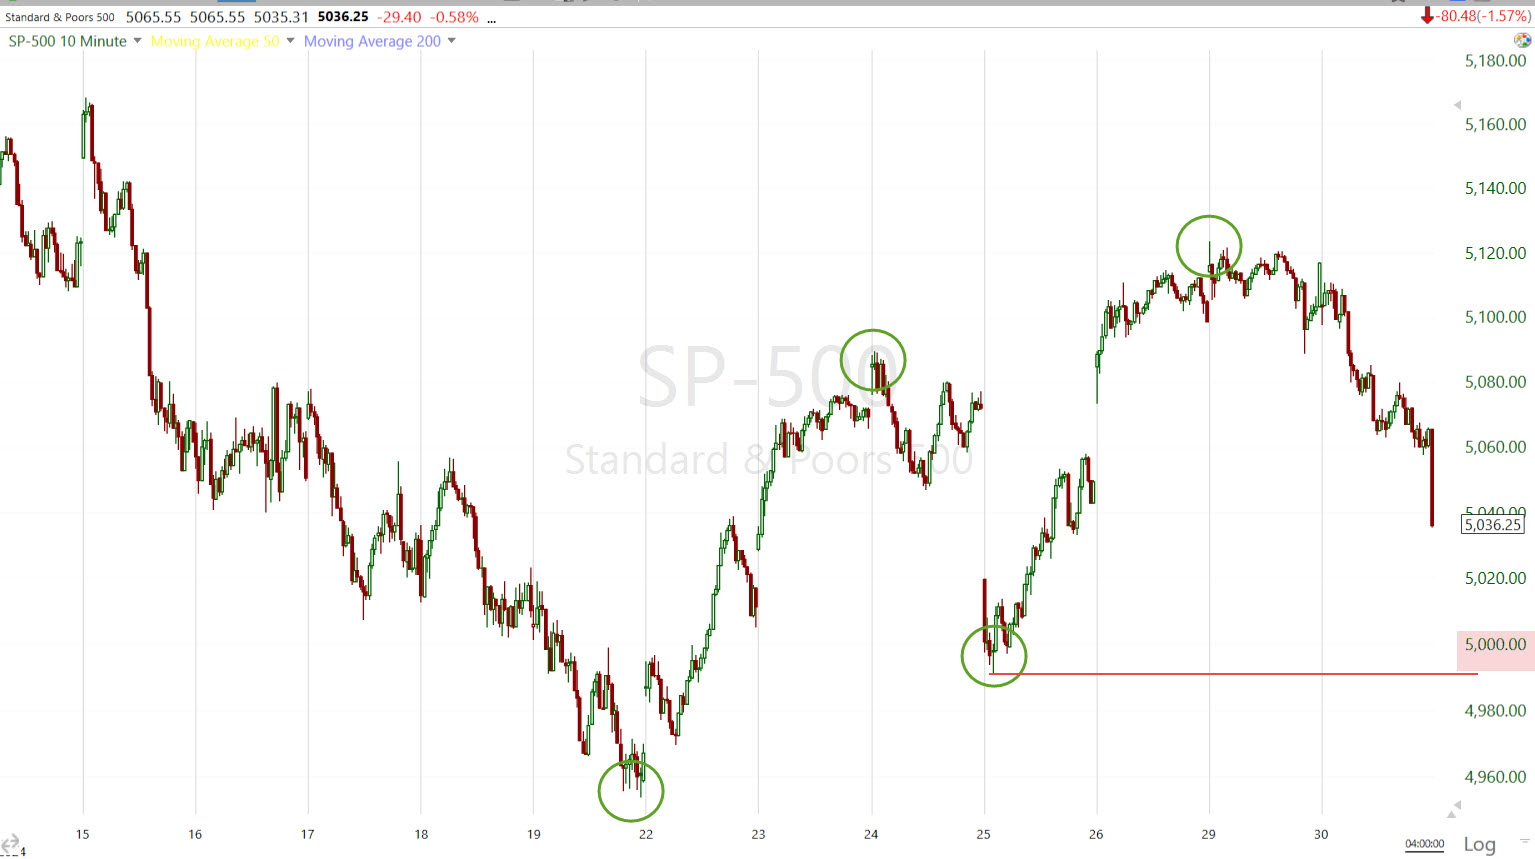 SPX (10m) short-term up trend –and more to the point, whether coincidentally or not, as mentioned in Early Update, which is worth a read if you haven’t already,
“the S&P is a comfortable safe distance from the bulk of CTA sell thresholds (medium and long term) which are mostly clustered at or just below SPX $5,000. The threat of forced systematic selling from the CTA community is less of a risk for the time being. According to Goldman’s models, “CTAs are buyers of global equities & SPX in every scenario over the next week” and only a 2.5-sigma market decline over the next month would force CTA selling.”
The S&P making a short-term lower low would also trigger CTA medium and long term sell triggers, which would be much uglier than the selling we saw about 2 weeks ago as short-term CTA sell triggers were hit.
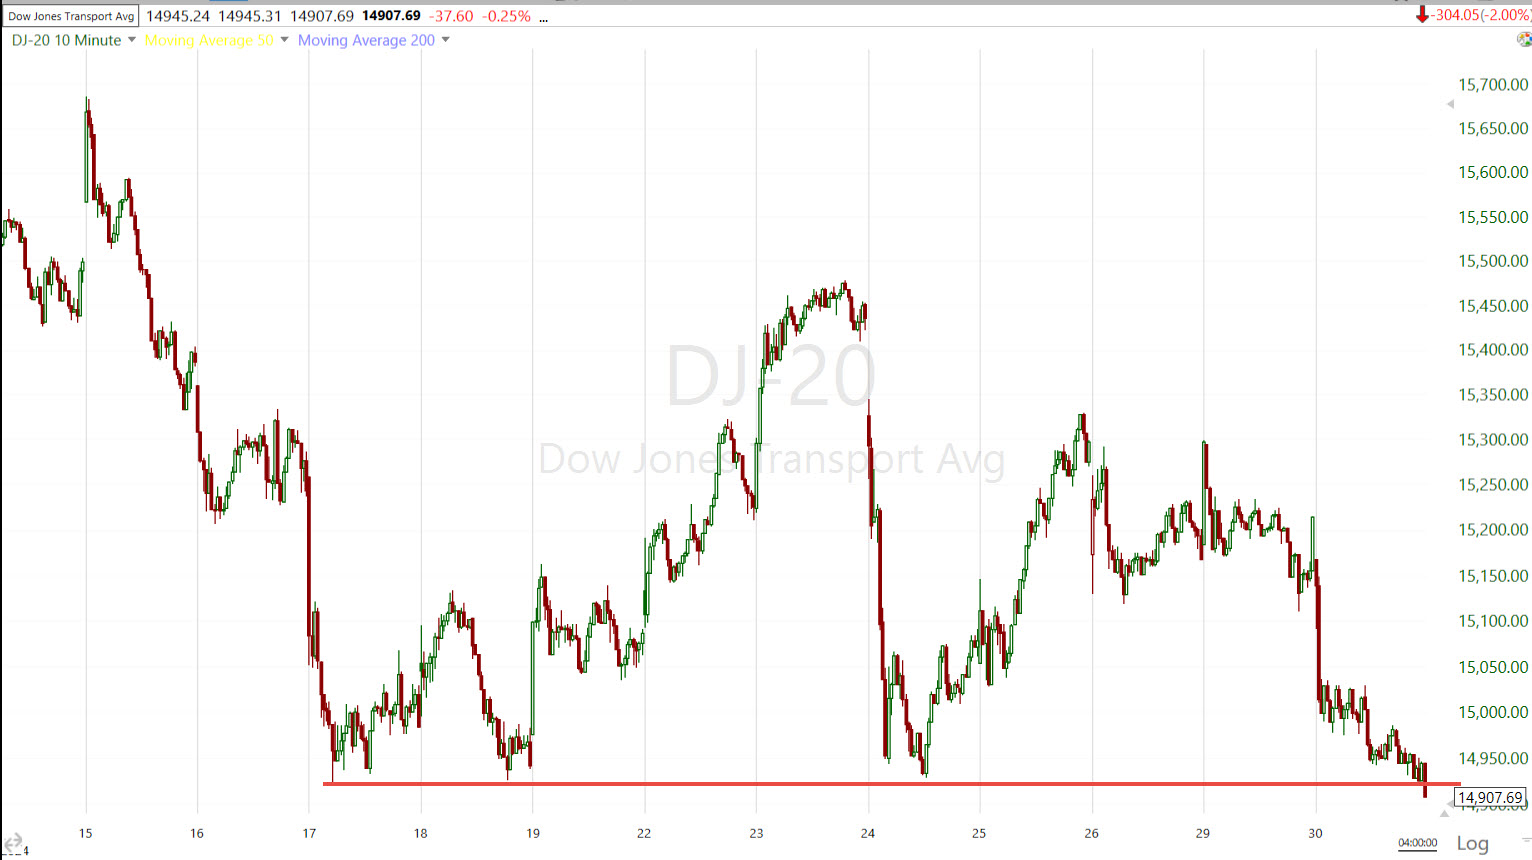 Dow Transports (10m) with a very modest lower low, not definitively yet. Watch for either support at this area, or a break below on a more definitive basis.
While the index isn’t full of mega-caps or semiconductors, there’s a reason Dow Transports “Should” confirm Dow Industrials. When Transports don’t, as we’ve seen all year and we’re seeing on a short term basis here, the message is… Economic Growth is faltering. With equity valuations at the historical high range (U.S. 12 month forward P/E multiples in the extremely elevated range at 20.6x,) and inflation surging, the last thing the market needs is economic growth falling toward recession as well. Inflation has the probability of weighing more heavily on the high valuations of stocks like 2022’s bear market. Things will get ugly fast and I expect they will this year.
Looking ahead, there is a FOMC policy announcement tomorrow followed by Fed Chair Powell’s press conference. Since this FOMC meeting has no Summary of Economic Projections (SEP), market participants will be focused on the tone Powell takes and any shifts in rhetoric following recent sticky inflation readings, and the more recent downward trajectory in economic growth – the nightmare scenario of central banks… Stagflation.
Overnight
S&P futures are down just shy of -0.2% in a consolidation of the cash session’s losses.
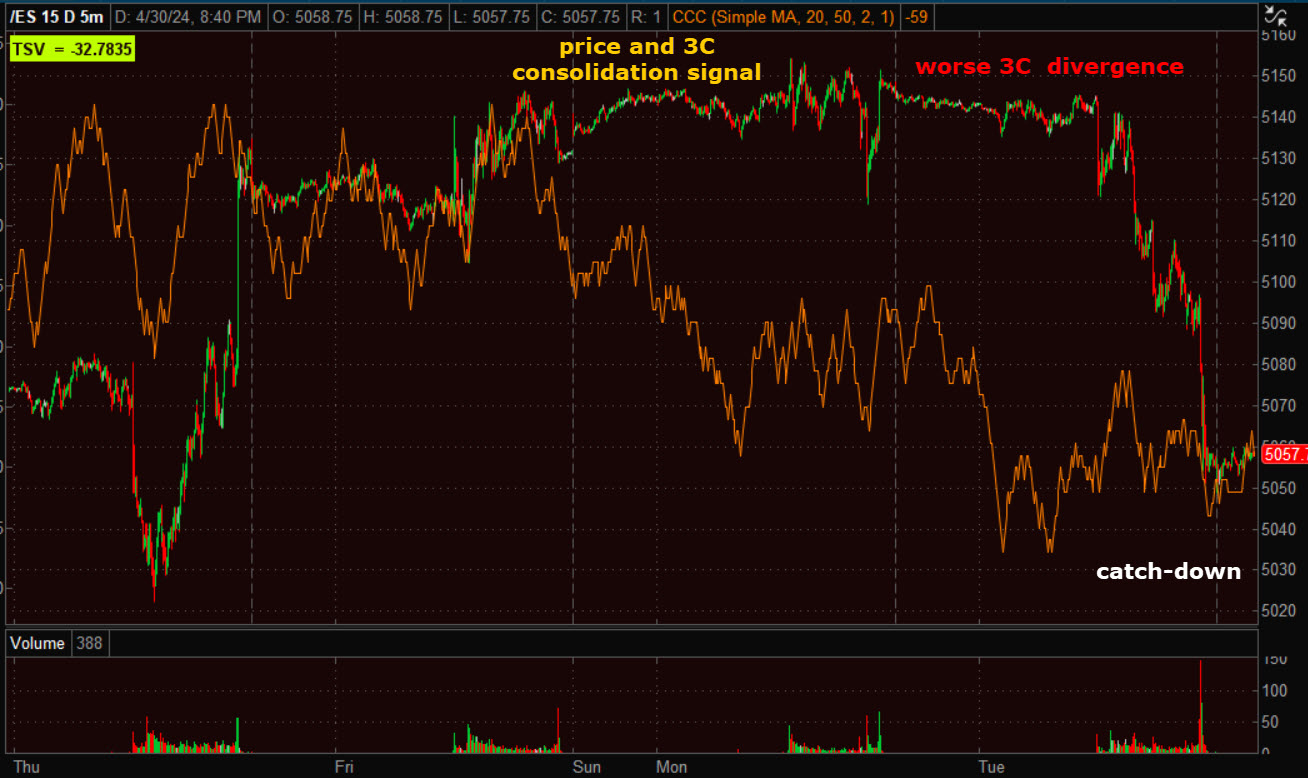 S&P futures (5m) with 3C signaling price/technical resistance yesterday and weaker 3C tone overnight. This morning’s economic data was too much for the market to bear, acting as a downside catalyst. Note the heavy volume at the close. Usually I’d say this is indicative of short-term oversold dynamics, but it’s impossible to determine with typical heavy month-end volume.
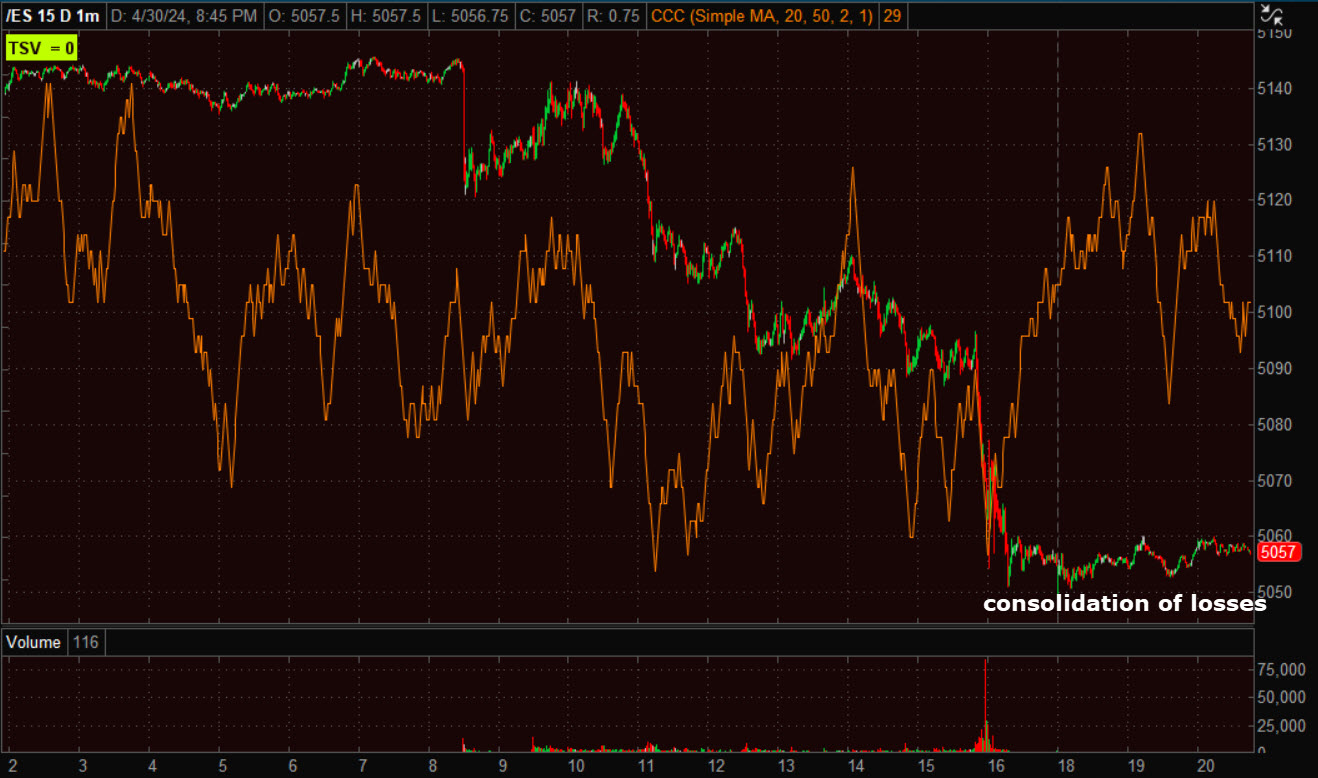 S&P futures (1m) consolidating cash session losses tonight.
NASDAQ-100 futures are down -0.4% as Amazon is down-2.1% after reporting earnings after the close.
Dow futures are down -0.1%.
The U.S. Dollar Index is up +0.15%, apparently anticipating a more hawkish Fed tomorrow.
WTI Crude Oil futures are down -1% to $81.11/bbl.
Gold futures are down -0.2%, below $2300 to $2298.40/oz.
Bitcoin futures are up +1.75%
The 2-yr yield is down -2 bp and 10-yr yield down -1 bp.
Looking ahead, market participants will receive the following economic data on Wednesday:
- 7:00 ET: Weekly MBA Mortgage Index (prior -2.7%)
- 8:15 ET: April ADP Employment Change (prior 184,000)
- 10:00 ET: March Construction Spending (prior -0.3%) and April ISM Manufacturing Index (prior 50.3%)
- 10:30 ET: Weekly crude oil inventories (prior -6.37 mln)
- 14:00 ET: May FOMC Decision (prior 5.25-5.50%)