This is a post from Wolf on Wall Street Trade, my current subscriber website. The Technical Take will be online to replace WOWS shortly. This is the Daily Wrap for Thursday, May 18th, 2023.
Today the stock market built on yesterday’s gains, which saw the S&P-500 trade up to the 7-week lateral range upper trend line, then consolidate bullishly the last 2 hours of the day just below. The S&P-500 followed through with buying interest easily taking out that trendline and ultimately ending the day just 2 points below $4200 ($4198.05). At session highs the S&P traded above $4200 at $4202.20. Today was the first time the S&P breached the $4200 level since August 2022. The S&P 500 closed at its best level of the year.
The real story though was the mega-caps leading the NASDAQ-100 to its highest close in more than a year, all the way back to April of 2022. As suspected in last night’s Daily Wrap,
” This suggests that mega-caps may have an easier time rotating into leadership tomorrow as we have seen all week (cyclicals one day, mega-caps the next).”
And rotate in they did. The mega-cap index (MGK +1.65%) outperformed the Equal Weight S&P-500 by 90 basis points. Mega-cap names like Microsoft (MSFT +1.44%), NVIDIA (NVDA +4.97%), Alphabet (GOOG +1.68%), (META +1.8%) all reached new 52-week highs today. Meanwhile, Netflix (NLFX +9.2%) jumped nearly 10% after the company said that its ad supported tier now has 5 million global monthly active users.
While the mega-caps led the market throughout the day, the afternoon saw participation broaden out with all of the cyclical sectors closing green as well.
In corporate news, Walmart (WMT +1.3%) reported better than expected Q1 earnings results, yet acknowledged that its shoppers are focusing more on consumer staples than discretionary items which speaks to my view we will almost certainly see an economic recession start by the second half of this year.
On the debt ceiling, House Speaker McCarthy said he “sees a path” to getting the debt limit bill on the House floor for a vote next week, yet other press reports suggest a debt ceiling deal won’t be easy to reach.
Economic data was mixed including lower-than-expected weekly initial jobless claims, a better-than-expected Philadelphia Fed Index for May, and weaker-than-expected existing home sales and leading economic indicators for April.
There were a handful of hawkish sounding Fed speakers today. Their comments will be covered in the Treasury section below.
Averages
All of the averages closed higher, but the Tech heavy NASDAQ-100 was the best by far, while the Dow had the slimmest gains. Dow Transports (+0.45%) were similar to Dow Industrials as mega-caps and growth were preferred over cyclicals and value.
S&P-500 ⇧ 0.94 %
NASDAQ ⇧ 1.81 %
DOW JONES ⇧ 0.34 %
RUSSELL 2000 ⇧ 0.58 %
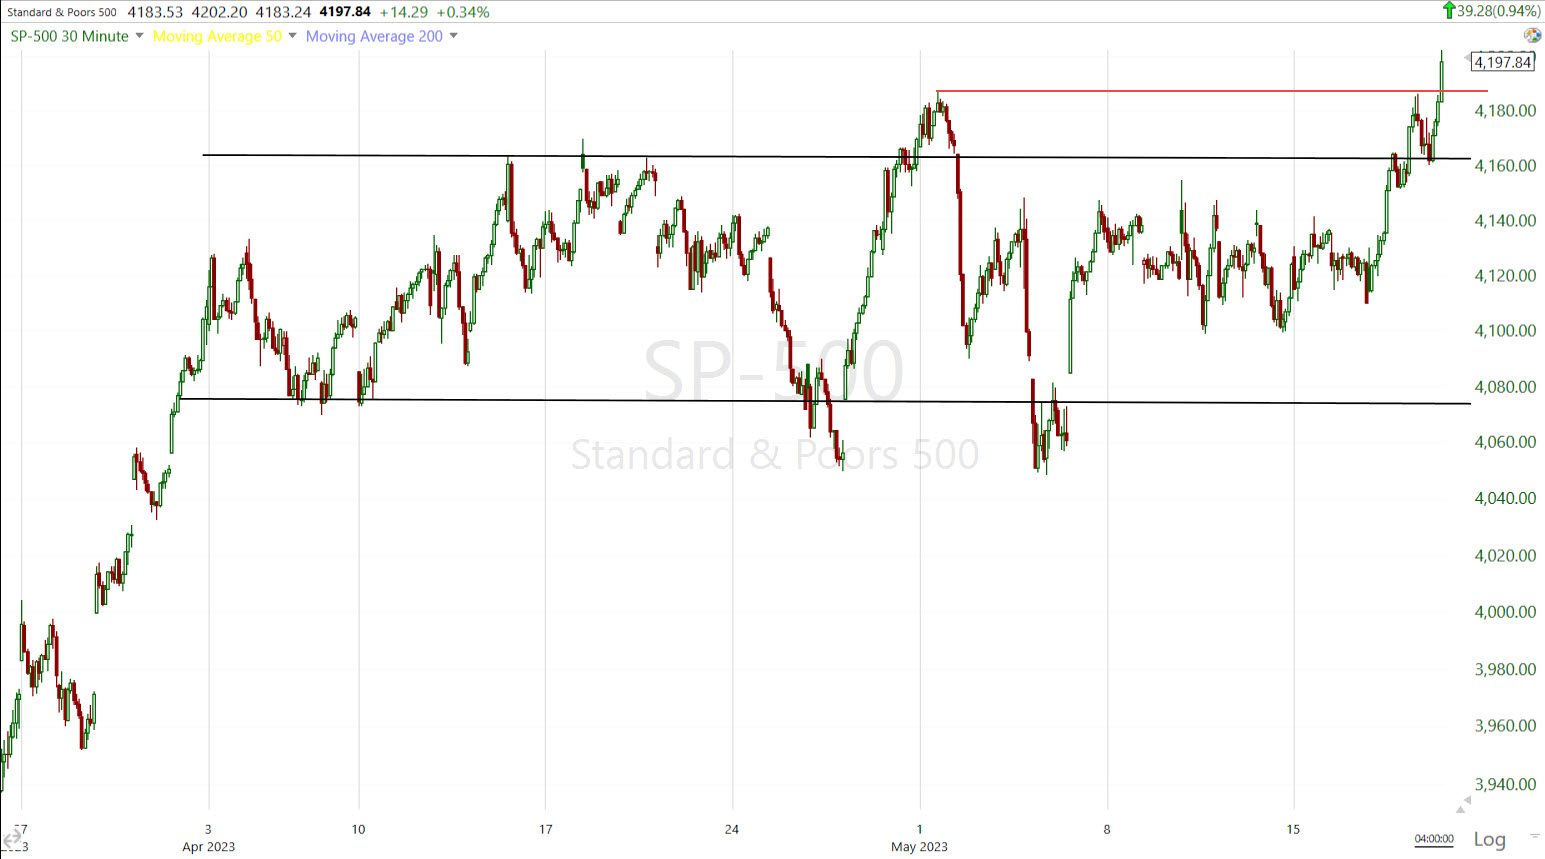 SP-500 (30m) cleared the 7 week lateral range and the early May high/resistance, just a whisker shy of $4200 at the close.
NASDAQ-100 remains the standout year to date, up over +26%. By way of contrast, the Dow Jones Industrial Average is up just +1.15% over the same period. As touched on in last weekend’s market video update, getting the broader market’s direction right doesn’t help if you are in the wrong areas to take advantage of it.
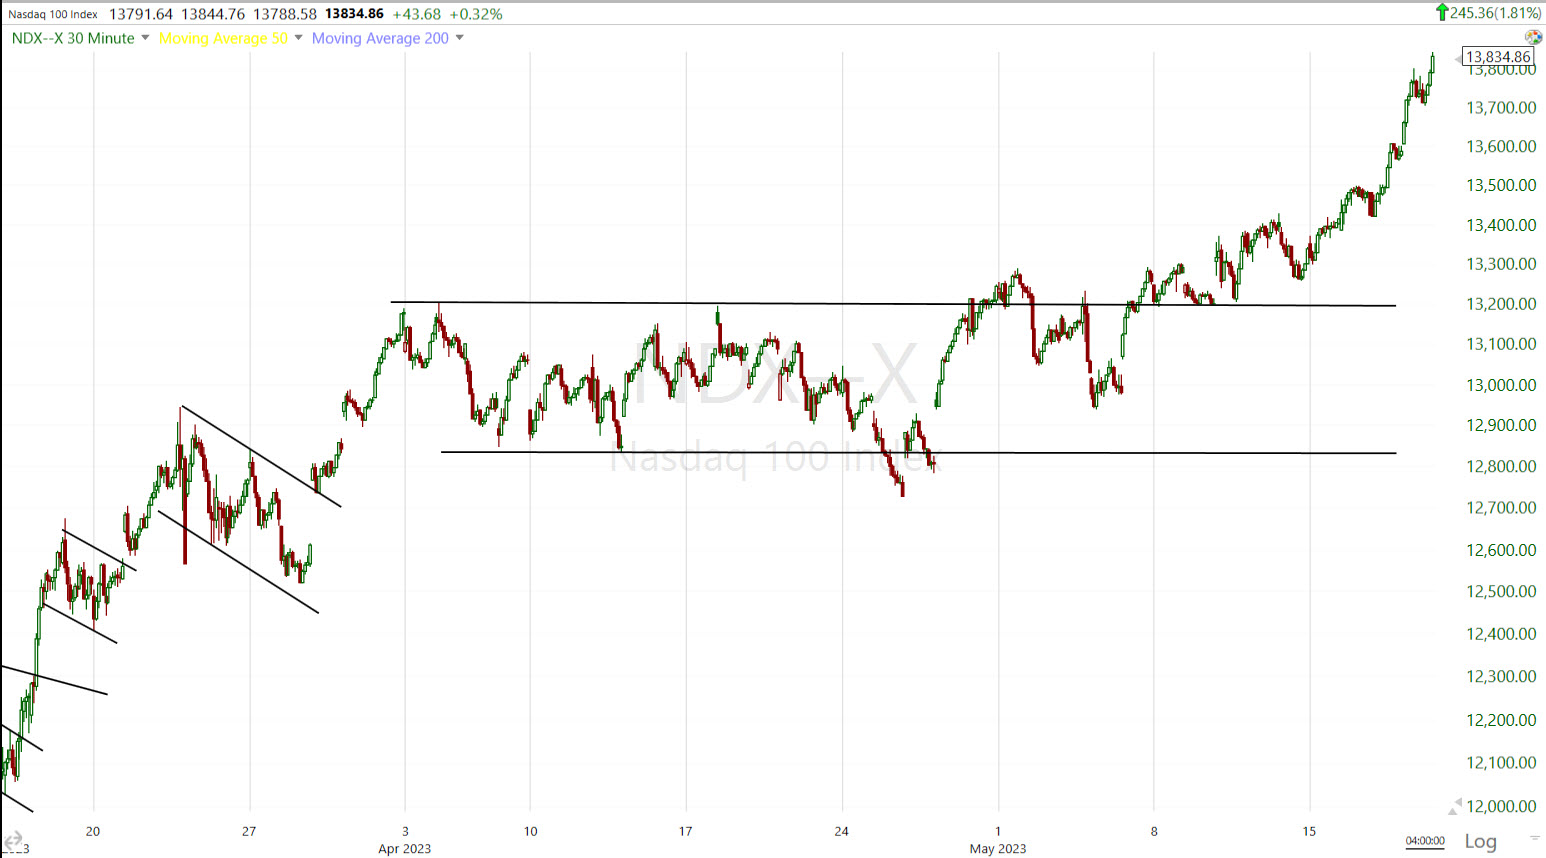 NASDAQ-100 (30m) was the first average to breakout of the lateral range. The S&P joined today, but the Dow has not and Small Caps are far from this performance.
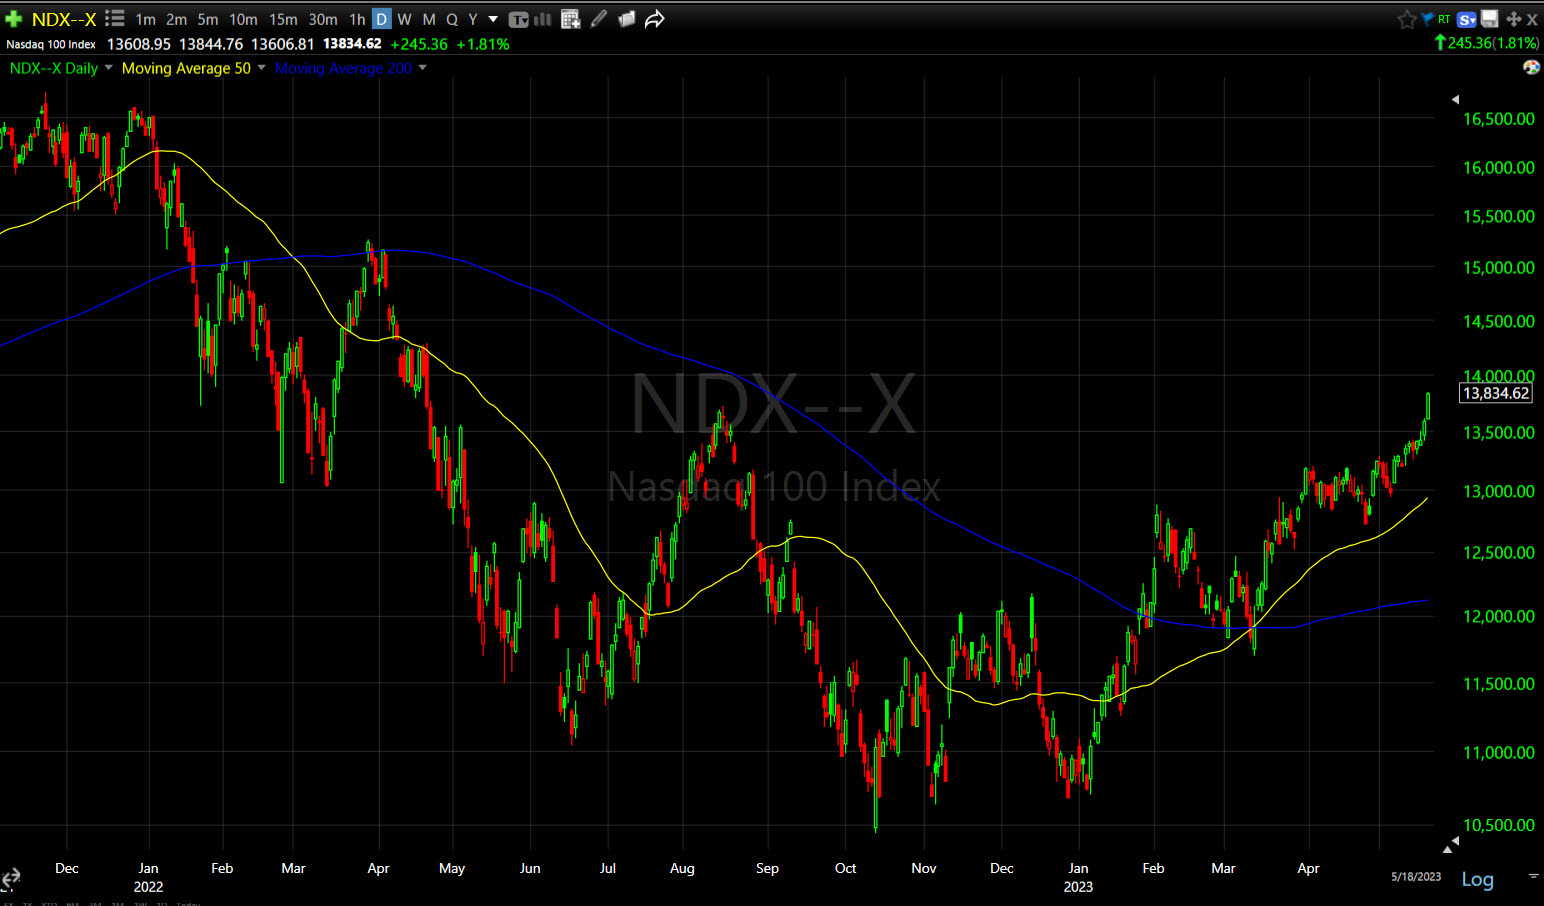 NASDAQ-100 (daily) looking at this chart with the golden cross (50-day above 200-day), you can almost see what looks like a larger “W” base from August highs. I can see why the hedge fund/Tech shorts might be terrified looking at this price chart. Personally I think this rally is starting to get a little too ahead of itself and may result in a blow-off phase. Now we can certainly see the intermediate lateral price trend in the NASDAQ that was forecast for the broader market last fall, turning from a primary downtrend or bear market.
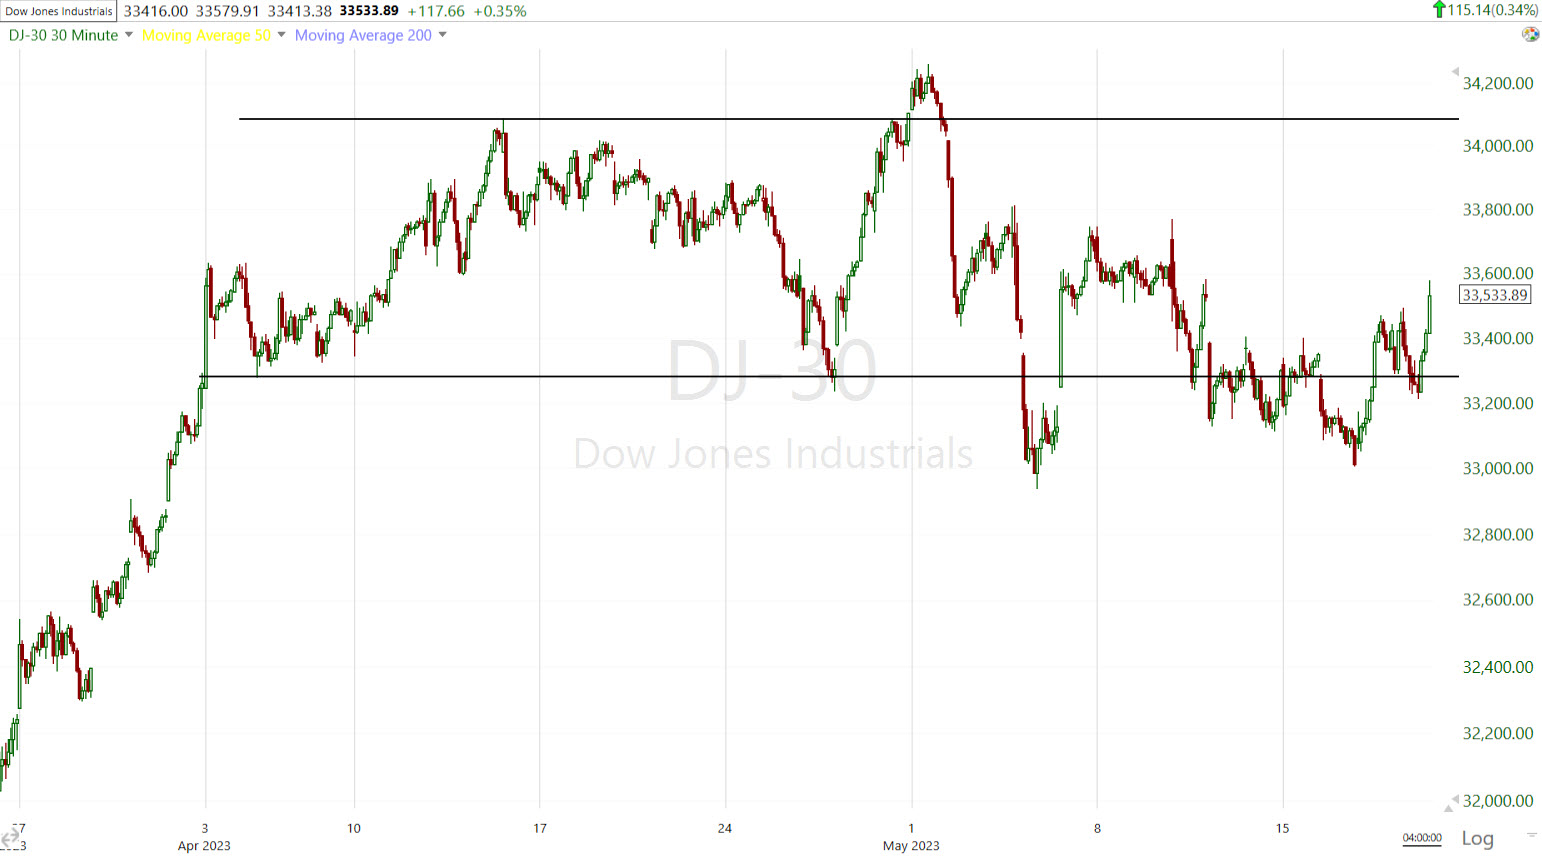 The Dow (30m) remains toward the low end of the 7 week range.
Small Caps “may” be working on a horrendously ugly inverse H&S base, but they have a lot to prove still before I’d call that a probability. Furthermore, it doesn’t even make sense to have cyclically dominant and domestically focused small caps building a base to rally from as the economy moves closer to recession, but here’s what I’m watching…
 IWM (60m) the first, more probable inverse H&S invalidated itself as it rallied from the bottom of what was then the right shoulder, to the neckline (shaded yellow). This is the most crucial area for volume to confirm an inverse H&S price pattern, and volume confirmation is crucial. Volume had to rise on this rally (yellow shaded area) and it didn’t. The “potential, but unlikely” new inverse H&S base has a left shoulder, head and right shoulder at the blue hash marks.
Once IWM broke out above the smaller diagonal trend line to the far right, volume picked up so that’s something, but it has a lot to prove still.
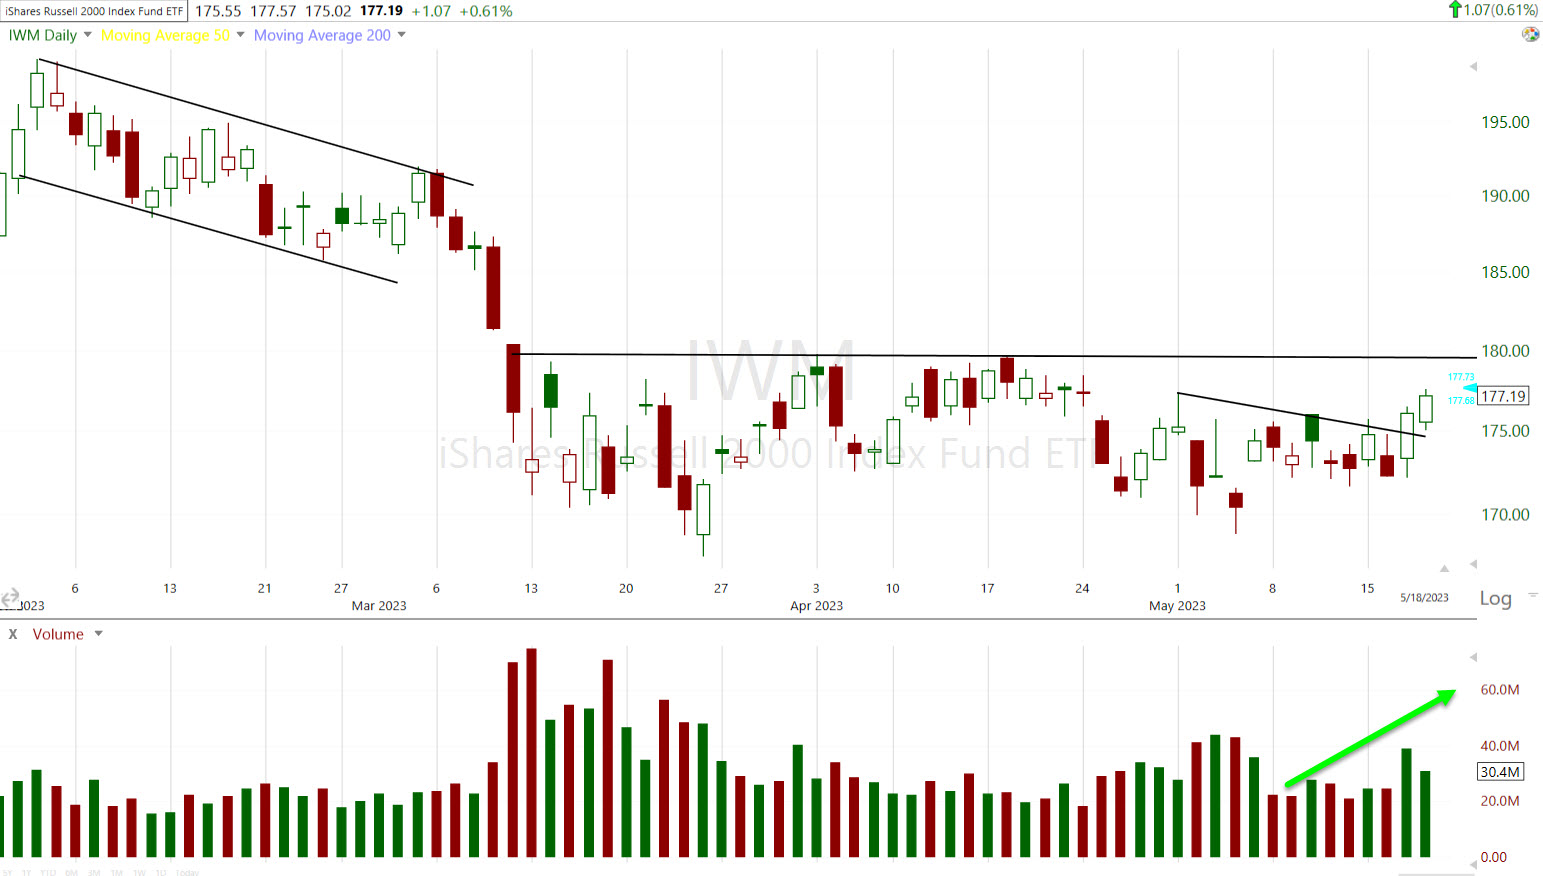
IWM (daily) the volume should rise with price up to the neckline from here (green arrow). While both yesterday and today’s volume is heavier, the trend should be rising volume and today was a bit lower. Of course 1 day lower in not a trend so we’ll see what happens next.
My Most Shorted Index didn’t do anything of note today, it’s really been that rising trend (short covering) earlier in May that was highly unusual. I suspect, however, that with a close above S&P $4200, we’ll see short covering pick up and likely roll into a short squeeze.
VIX (-4.85%) and VVIX (-4%) both displayed relative weakness around 2 p.m. (see this intraday update) as the S&P pulled back to former resistance (now support), which was an early sign that the level would hold.
The Absolute Breadth Index has become very popular with my subscribers recently. On an intraday basis earlier today it moved as low as 12.76 (a sub-14 print), but as market breadth improved with cyclical sectors joining the afternoon rally, the ABI ended the day at 16.33. There have been a lot of questions about the ABI recently. Tomorrow I’ll spend some time looking for a comprehensive post I did on the ABI a couple of years ago. Hopefully it’s still in the data base, but for now let me just copy and paste my reply to a subscriber from earlier today.
“Ideally from a backtesting point of view, the [ABI] close below 14 works the best – or lower. The lower the better, but these are levels I’ve established on my own (I don’t think anyone else uses the ABI for predicting volatility surges) so there’s not an exact level or intraday/close.
It probably helps to look at the ABI from a bird’s eye perspective. It is actually a market breadth indicator. Low readings are telling us that market breadth is consistent with a slow topping process. When it hits multi-year lows (which it’s pretty much doing now), those tend to be the times when there’s a high probability move in volatility (up) and markets (down). Until 2021 when market breadth was so bad we had probably a half dozen signals [that year], these sub 14 signals were rare, maybe once every couple years, or once a year.
I think this fits really well with where I think we are in the market’s rally/lateral range from October of last year, being near the end. The other caveat is that late last year when I expected the mega-caps (which were the worst performing stocks last year due to higher rates) to rotate into leadership next, as they have since January 3rd, I also knew that market breadth was almost certainly going to get weaker. Money flows out of other hundreds or a thousand other stocks and into a dozen or so mega-caps. So this isn’t unexpected either. Because of the mega-caps weight, they can keep the NASDAQ rally alive and help S&P trade above $4200, which would be my highest probability scenario, but I’m thinking institutional money that moves markets are seeing the same things I am and would be selling into price strength given the opportunity.”
I hope that adds some perspective.
S&P sectors
7 of 11 S&P sectors close higher. Obviously the 3 mega-cap heavy sectors (bolded in green below) led the rally, but this afternoon saw cyclical sectors join in, albeit none of the cyclicals (except Consumer Discretionary which I always count as a mega-cap heavy sector) even kept pace with the benchmark S&P-500 Index.
Semiconductors (SOX +3.15%) were a strong area of outperformance again, continuing to outperform the Technology sector that they often lead.
The defensively oriented sectors all closed lower for the day, which was another sign that risk sentiment remains positive. The counter-cyclical Consumer Staples sector was among the top laggards, despite an earnings-related gain in Dow component Walmart (WMT +1.3%).
Materials ⇧ 0.59 %
Energy ⇧ 0.73 %
Financials ⇧ 0.74 %
Industrial ⇧ 0.73 %
Technology ⇧ 2.05 %
Consumer Staples ⇩ -0.49 %
Utilities ⇩ -0.30 %
Health Care ⇩ -0.24 %
Consumer Discretionary ⇧ 1.55 %
Real Estate ⇩ -0.63 %
Communications ⇧ 1.80 %
Regional Banks (+0.6%) which were one of yesterday’s big winners, took a breather today with the cyclical sectors.
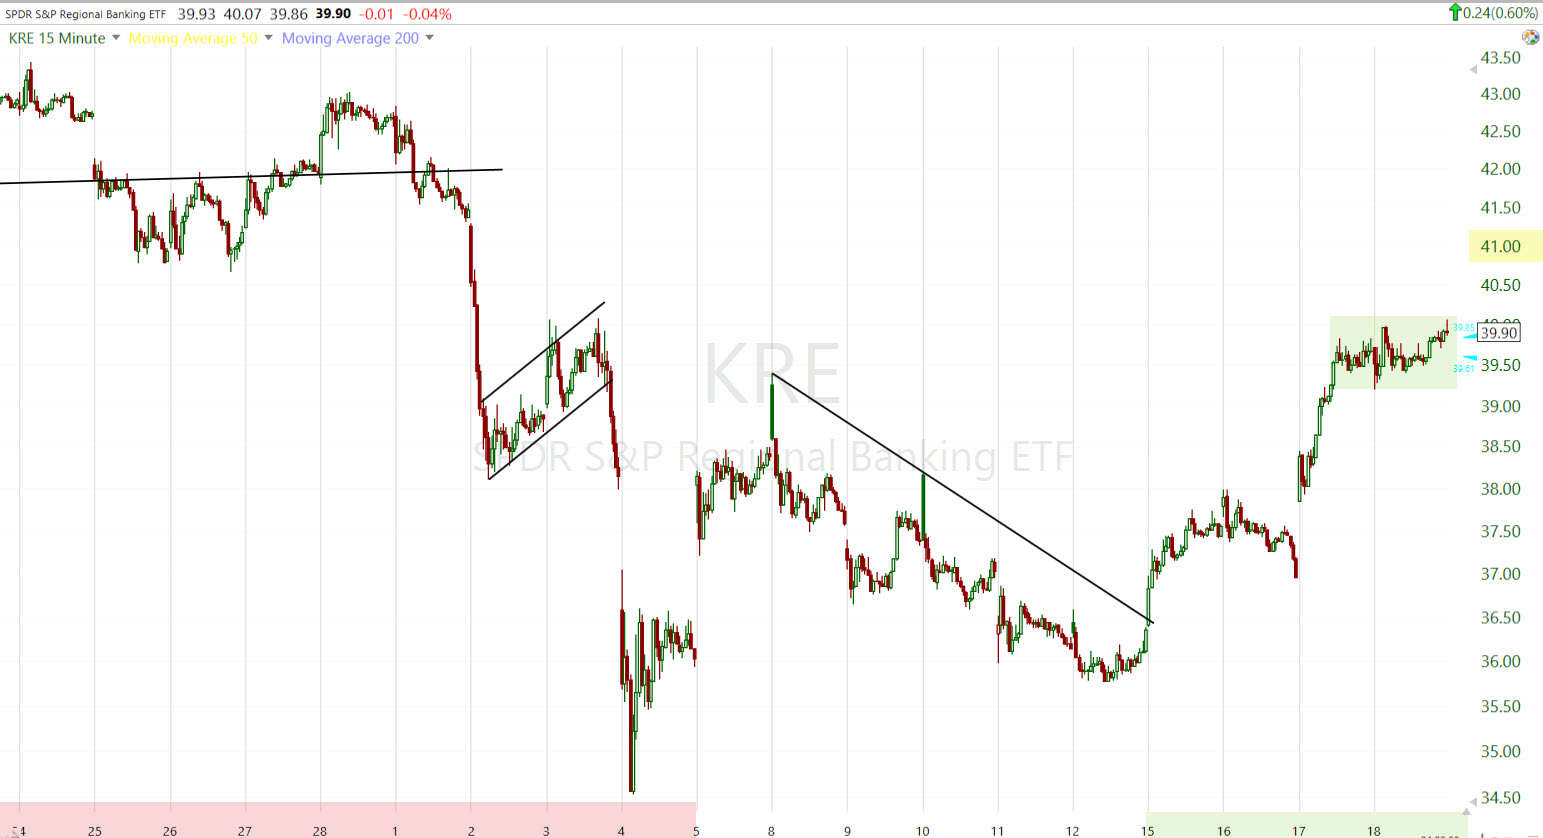 KRE (15m) since the Regionals have transitioned from bearish (red) to more bullish (green) price action, they’ve been acting well. Yesterday afternoon and today form a something of a sloppy bullish ascending triangle consolidation (price shaded green), which suggests they have more upside to go. However, I do think they’ll have trouble as KRE approaches $41 which is a downtrend line above current price stretching back to mid-March (not visible here), and the rapidly declining 50-day sma ($42.16) should be around the same area by the time KRE approaches $41, adding technical resistance as well as price trend resistance.
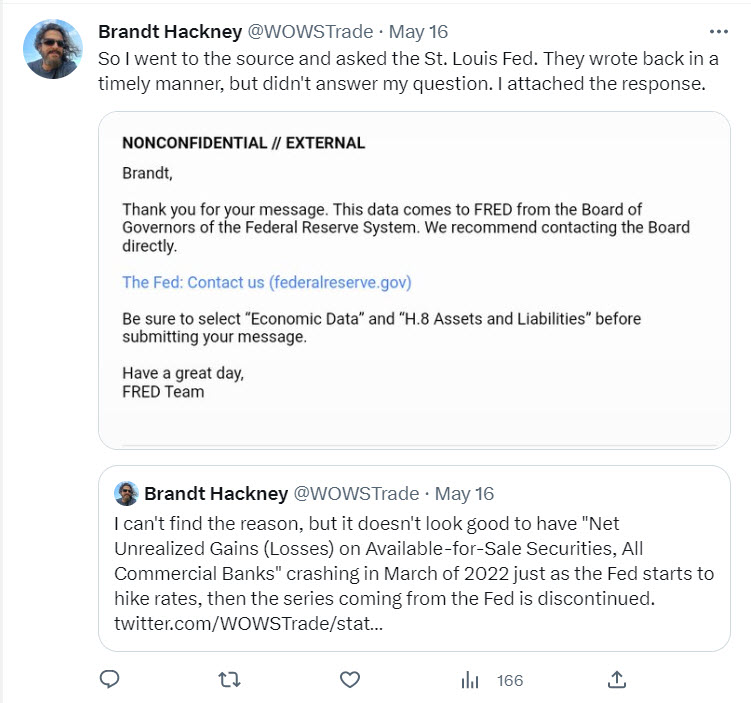
I don’t know if you saw this chain of tweets (you can follow me on Twitter here) that I recently posted. The gist of the tweet is that I couldn’t find the reason the St. Louis Fed’s database (FRED), discontinued a data series called “net unrealized gains (losses) on available-for-sale securities, all commercial banks“. In brief there are 3 types of assets banks hold – Trading (short-term), Held to Maturity (longer term), and this group in the middle – Available For Sale securities. The data on this stopped as of February 2022, just as the Fed started hiking rates the next month in March. So… I wrote to the St. Louis Fed that makes the data available (FRED) and asked them,
“I’m wondering why the data, “Net Unrealized Gains (Losses) on Available-for-Sale Securities, All Commercial Banks” (NUGACBW027SBOG), was discontinued?”
And the below tweet shows the St. Louis Fed’s answer…
In any case, this is what the series looked like as of February 2022, as inflation was already embedded and just before the Fed’s first rate hike in March.
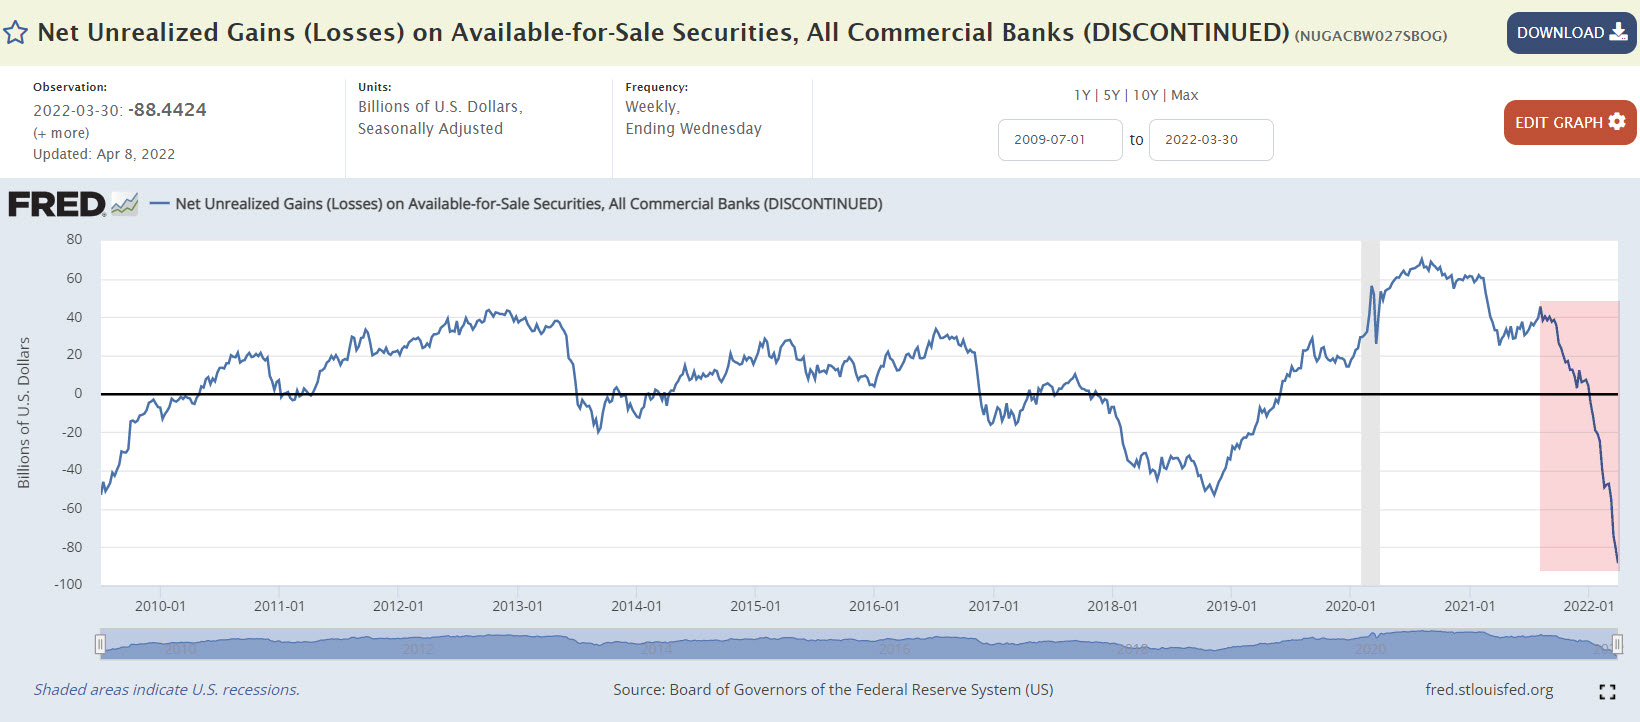 I’m no expert on this, but I know some of the assets the banks hold in this category are mortgage backed securities and Treasuries. Well, say you’re a bank and you need to hold a certain level of reserves, and it’s a year earlier when the Fed is saying inflation is transitory, and you have a bunch of Treasuries bought when the Fed funds rate was ZERO. What do you think happens to the value of those assets after inflation, and then a 525 basis point rate hike cycle by the Fed? What happens to bond prices when yields decline? If this chart were available today, I think it would be a horror show that makes the 2008 Financial Crisis look like a cake-walk, at least from the perspective of this data series.
I didn’t write to the Fed’s Board of Governors because I don’t think I’ll get a more satisfactory answer, but it might be fun just to see what they say. It seems pretty obvious why the series was cancelled just as the Fed started hiking rates. They didn’t want the public to see what their hikes would do to the banks. So… Yeah, I don’t think the banking crisis is behind us.
Internals
Market breadth was not very broad today with Advancers leading decliners by a 5-to-3 margin at the NYSE and an 11-to-10 margin at the NASDAQ – both less than a 2-to-1 ratio. Volume was lighter too at 867 mln. shares.
Only the NASDAQ-100 had a Dominant price/volume relationship at Close Up/Volume Up, the most bullish of the relationships. None of the 3 factors that go into 1-day overbought internals qualified as such today.
Treasuries
Treasuries settled with losses across the curve after digesting some better than expected initial claims data, and a lot of Fed-speak as was expected this week.
- Dallas Fed President, Logan (FOMC voter), said that the current data does not yet support a pause in June.
- Fed Gov. Jefferson said “Inflation is too high, and we have not yet made sufficient progress on reducing it,”, adding “Outside of energy and food, the progress on inflation remains a challenge… a year is not a long enough period for demand to feel the full effect of higher interest rates.”
- St. Louis Fed’s Bullard said that “it may warrant taking out some insurance by raising rates somewhat more to make sure that we really do get inflation under control…”, adding, “Our main risk is that inflation doesn’t go down or even turns around and goes higher, as it did in the 1970s.”
The Fed-sensitive 2-year yield rose 11 basis points to 4.27%. The 10-year yield rose 7 basis points to 3.65%, its highest level since mid-March.
As expected due to a heavy dose of Fed speakers this week, and just the general volatility in Fed Funds Futures, especially near term, the market adjusted hawkishly today. On Friday the Fed Funds Futures had priced in less than a 1 percent chance of the current 5% to 5.25% Fed funds rate would be the same by the end of the year. That’s now up to 11.2%
My broader custom credit index continues to see detioration, along with HY Credit.
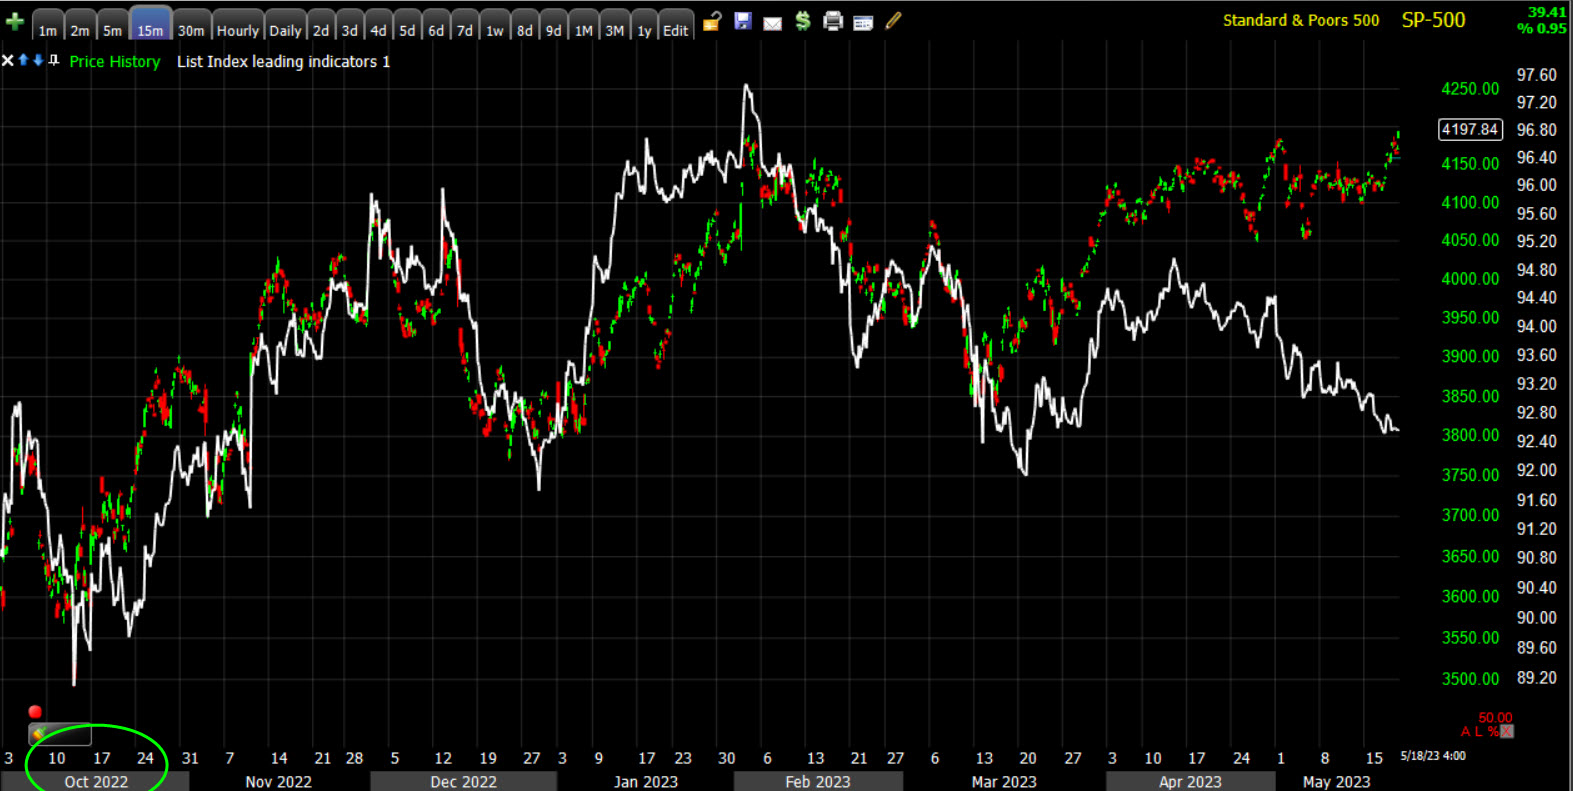 SP-500 (15m) from the October market low and bases that kicked off what is now a 7 month rally. Recently, credit is not confirming.
Currencies and Commodities
The U.S. Dollar Index gained +0.7%, which normally would have been headwind for stocks, so their gains today were impressive in the face of a higher dollar and yields.
WTI crude oil futures fell -1.3% to $71.84/bbl. I’m not certain yet and I’ve waivered on this, but Oil may be putting in a larger bear flag. I’ll use USO for a proxy as it’s easier for to to draw trendlines on TC2000.
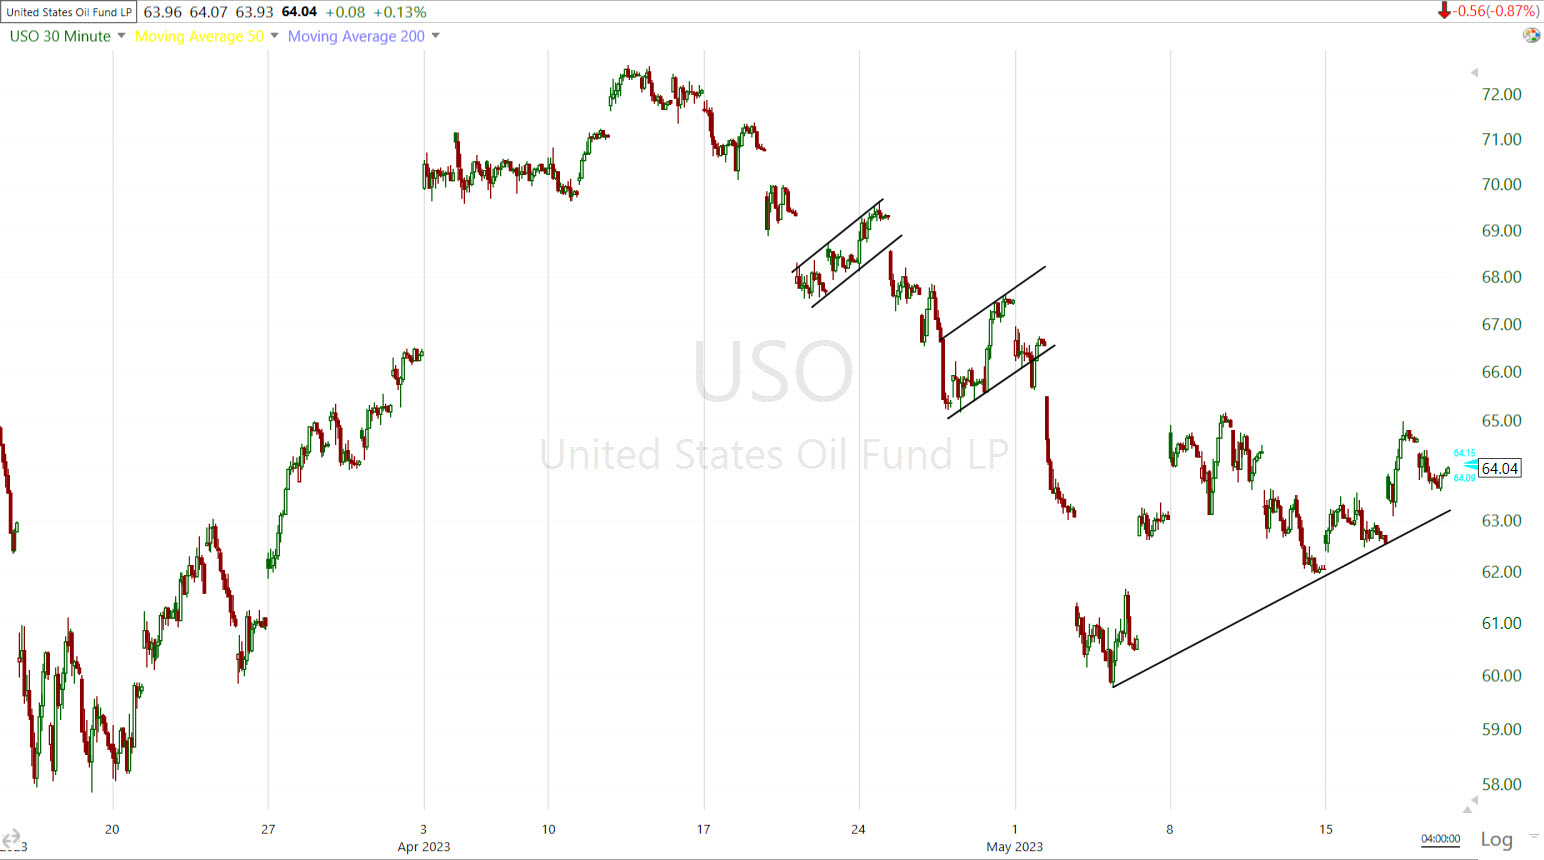 USO (30m) we had two solid bear flags, but this last correction was much larger and now it’s starting to hint that it may be a bear flag. I don’t have the evidence in the form of another pivot on the upper end to draw in the top trend line, as bear flags are almost always remarkably symmetrical. If this ends up forming a bear flag, it would have a next leg down measured move of roughly -9.5% and by the time it fully developed to include an upper trend line, the break down (which would be at higher levels than now) would take price down to test the mid-March low that can be seen to the left side of the price chart.
Gold futures fell for a 3rd day, closing under $2,000 after a loss of -1.3% to $1,959.80/oz, pressured by gains in the dollar and rising yields following comments from government officials that reaching a debt ceiling deal by Sunday was “doable”, and hawkish Fed commentary. In last night’s Daily Wrap I posted this chart of GLD as a proxy for Gold futures, with the following excerpt.
“Gold futures were down -0.36%, but the price action (more visible on the GLD ETF) looks like Gold could have another -2% of near term downside.
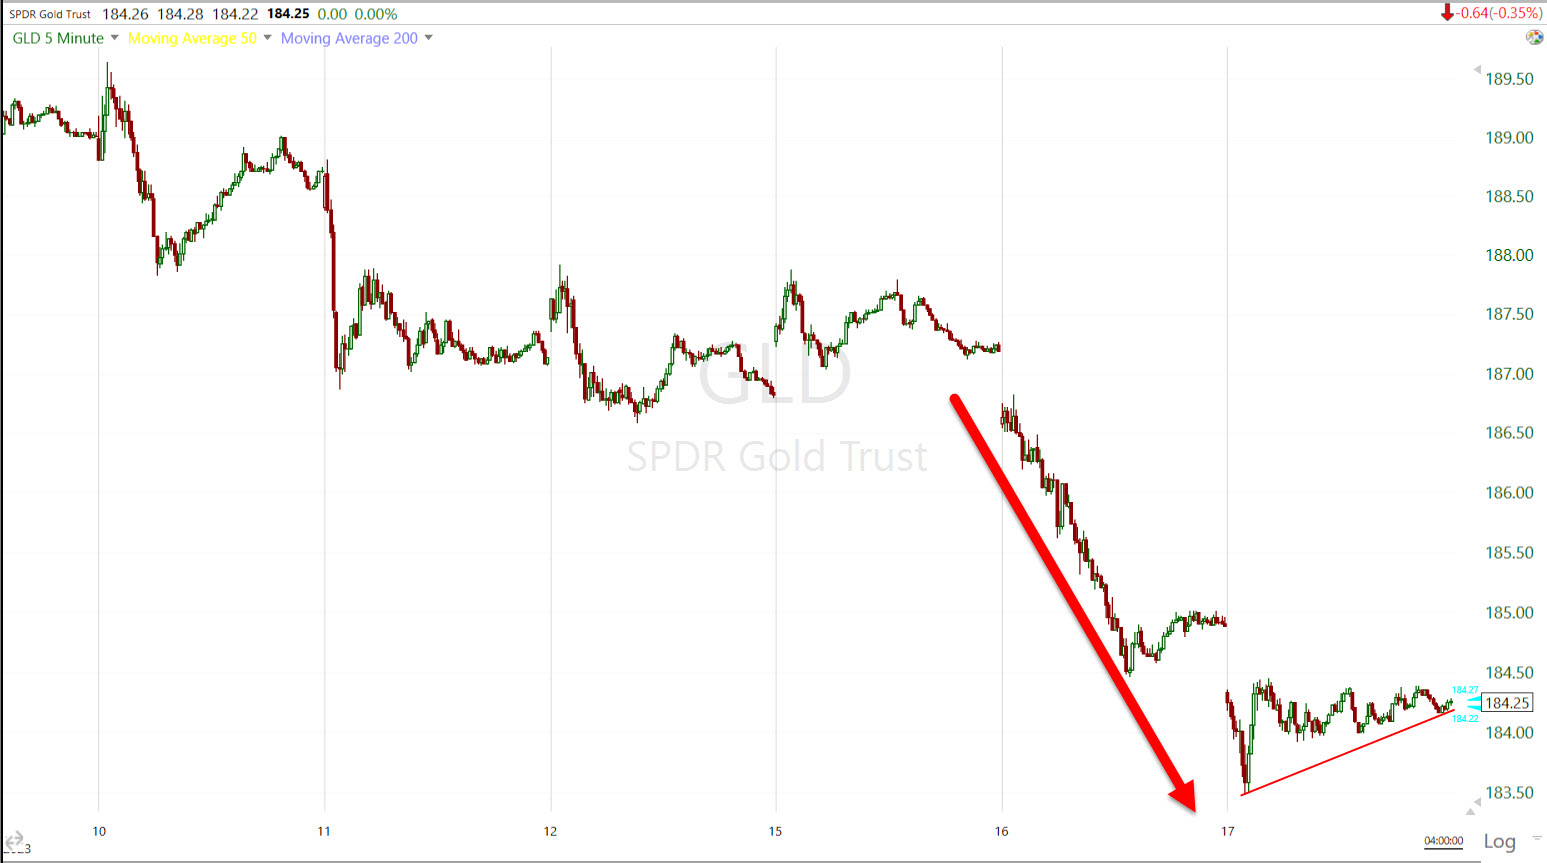 GLD (5m) with near term bearish price action and a bearish price consolidation today.”
Today’s -1.3% loss gets gold much closer to that bear flag’s near term downside measured move target.
Bitcoin continues to trade with a near term bearish bias in a small bear flag.
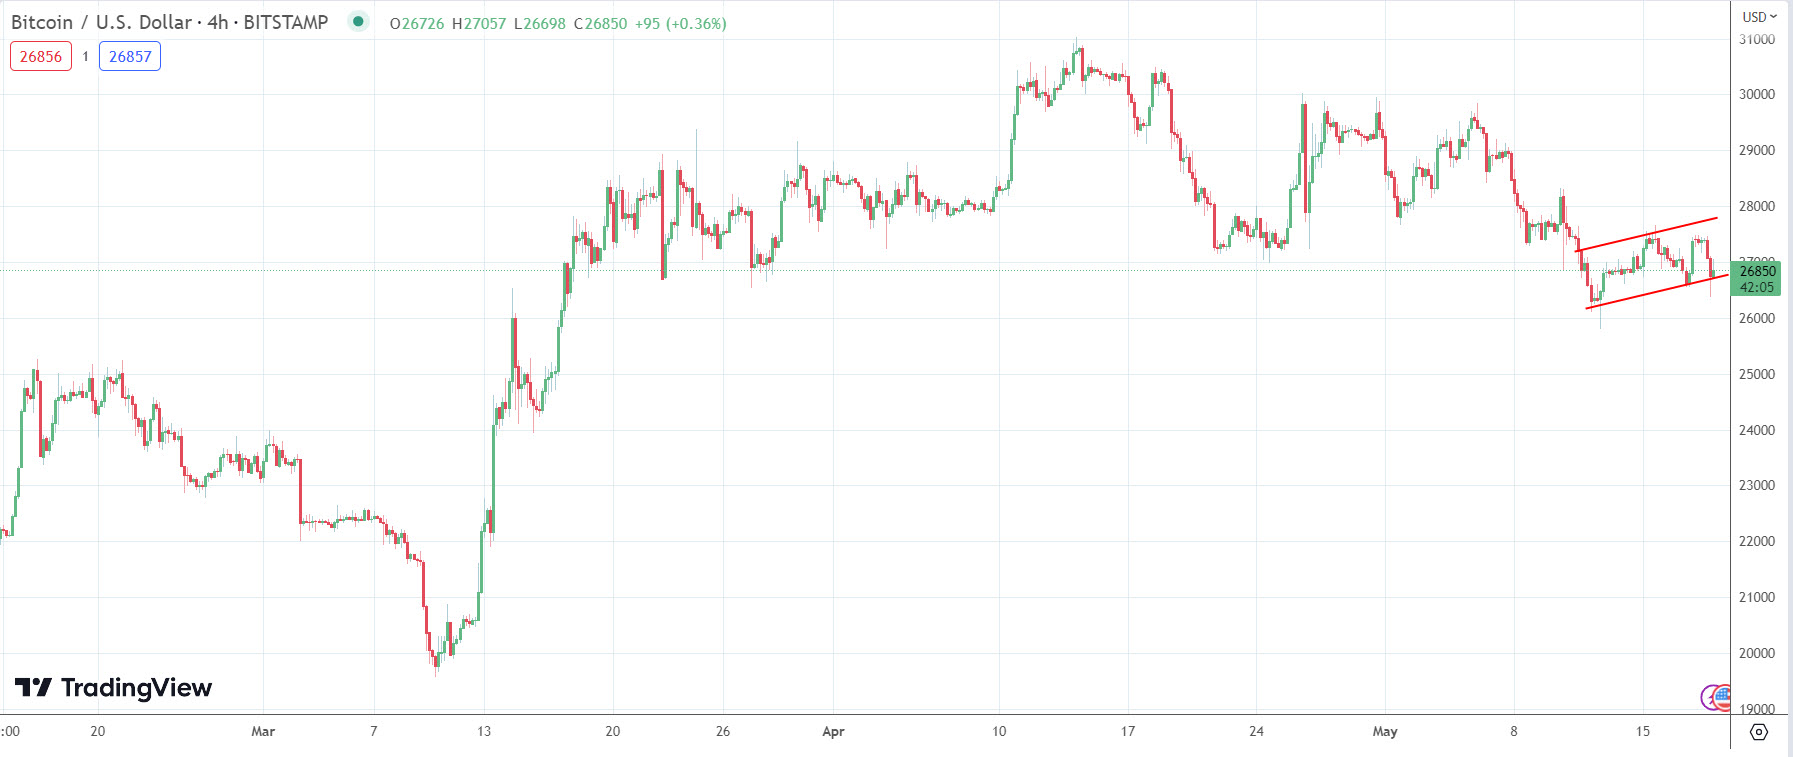 BTC/USD (4H) – the bear flag to the far right (red) isn’t huge so it’s not about a major drop due to the flag, but any drop from this flag would break under this large lateral range and that would likely encourage more selling. Gold and Bitcoin have recently been gaining when the market is pricing in a more dovish Fed (rate cuts sooner than later), and declining much as we’ve seen this week when the market is pricing in a less dovish, or more hawkish Fed (leaving rates where they are through the end of the year).
I have a 4 part “Shorts” series on YouTube covering Bitcoin and how liquidity is bullish, and an environment like now where liquidity is being drained by the Fed, it doesn’t act well. Here’s the link to my YouTube Channel and specifically the “Shorts” videos.
Summary
As you might imagine, there’s not much to add tonight as everything is proceeding as expected, which is the S&P-500 > $4200, which drives a FOMO and short covering rally, and I expect we see stronger distribution in to that move (institutional money selling into price strength, while the mom & pop investors get left holding the bag. I do NOT think this is the start of a new bull market or any such thing. The mega-caps were expected to lead the market into Q1 2023, and they continue to do so into Q2, but I do not expect this rally has legs beyond the end of Q2 (end of June) and potentially sooner if that distribution phase is heavy.
Deere (DE), Foot Locker (FL), Catalent (CTLT), RBC Bearings (RBC) will report earnings ahead of Friday’s open.
There is no notable U.S. economic data tomorrow, but Powell and former Fed chair, Bernanke, will appear together on a panel. I imagine Powell says something hawkish going by every other Fed speaker this week.
Overnight
S&P futures are up +0.15% tonight and at $4217.50 – not the same as the S&P’s $4200 level – but if that 0.15% held by tomorrow’s open, the S&P would be above $4200. The price action is that of a small bullish consolidation heading into the overnight session. Furthermore, 3C is not confirming price gains in ES.
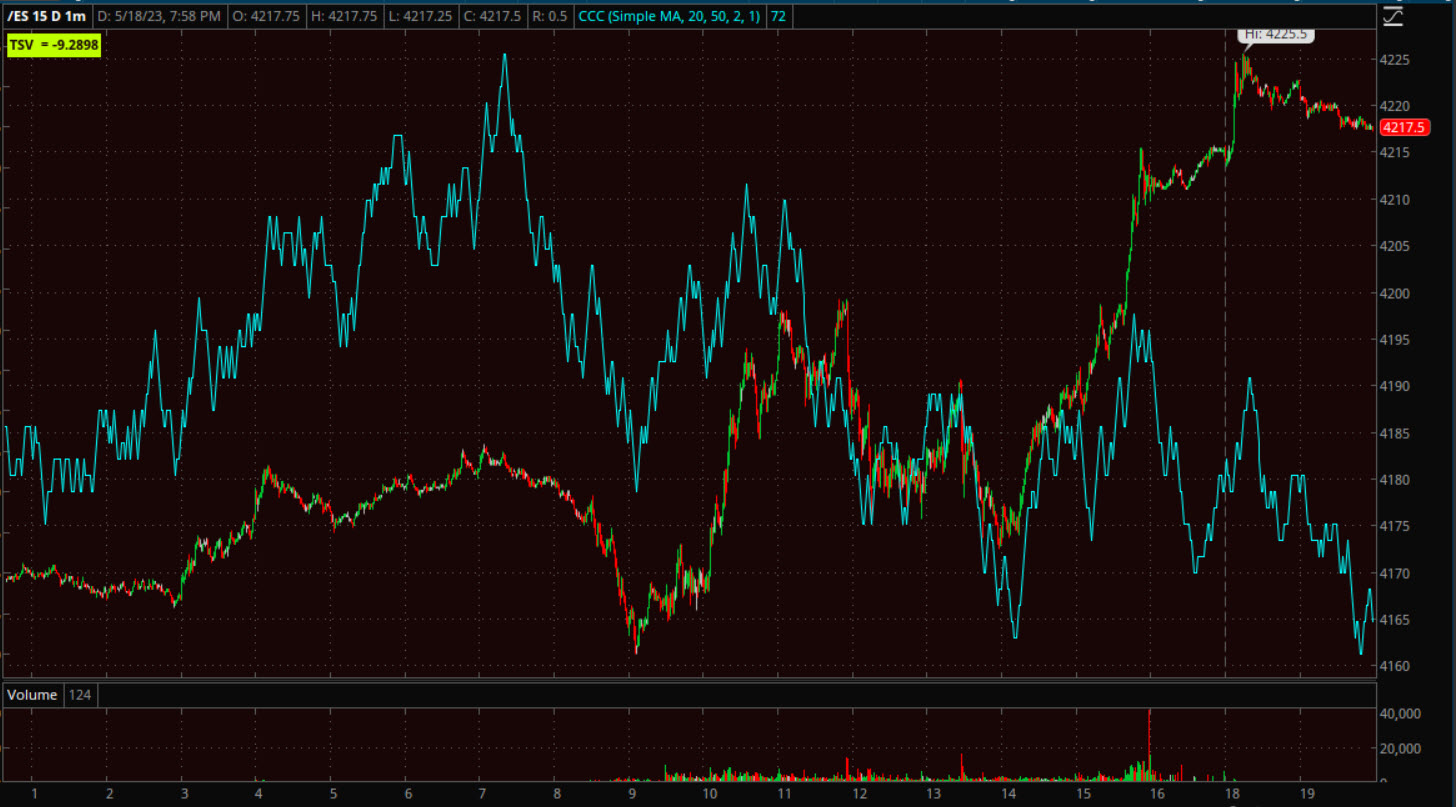 S&P futures (1m) – notice the bullish price consolidation since the close, but also a divergent 3C. Keep in mind that S&P-500 benefits from mega-cap gains, but it has a lot of other stocks so it doesn’t benefit as much as NASDAQ-100 and NQ futures are up +0.3% with good 3C confirmation.
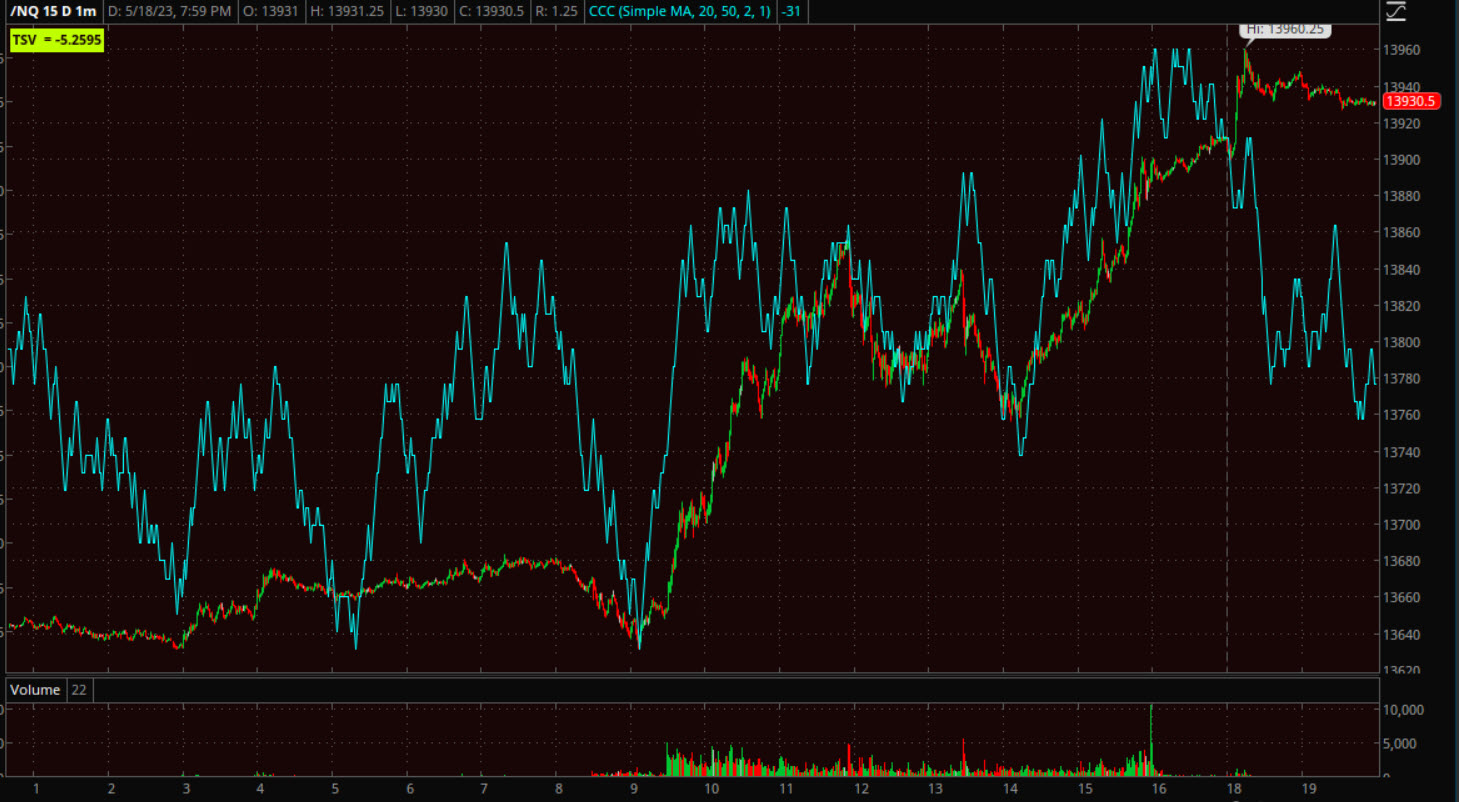
NQ (1m)
The U.S. Dollar Index is down just shy of -0.1#%
WTI Crude futures are up +0.15%
Gold futures are up less than a tenth of a percent and have a bearish price bias overnight. We may see the rest of that -2% bear flag measured move tomorrow.
Bitcoin futures are up just +0.25% and also have a more bearish price tone tonight.