November is off to a banging start. Recall that Mutual Funds, with some $1.8 trn in assets under management, were sellers into their fiscal year end, October 31st. Their new fiscal year started yesterday, November 1st. However, we already had signs that some kind of low the market could work off was coming with yields positively diverging from their correlation with stocks last week after the 10-year yield hit the key psychological and technical 5% level and began a consolidation…
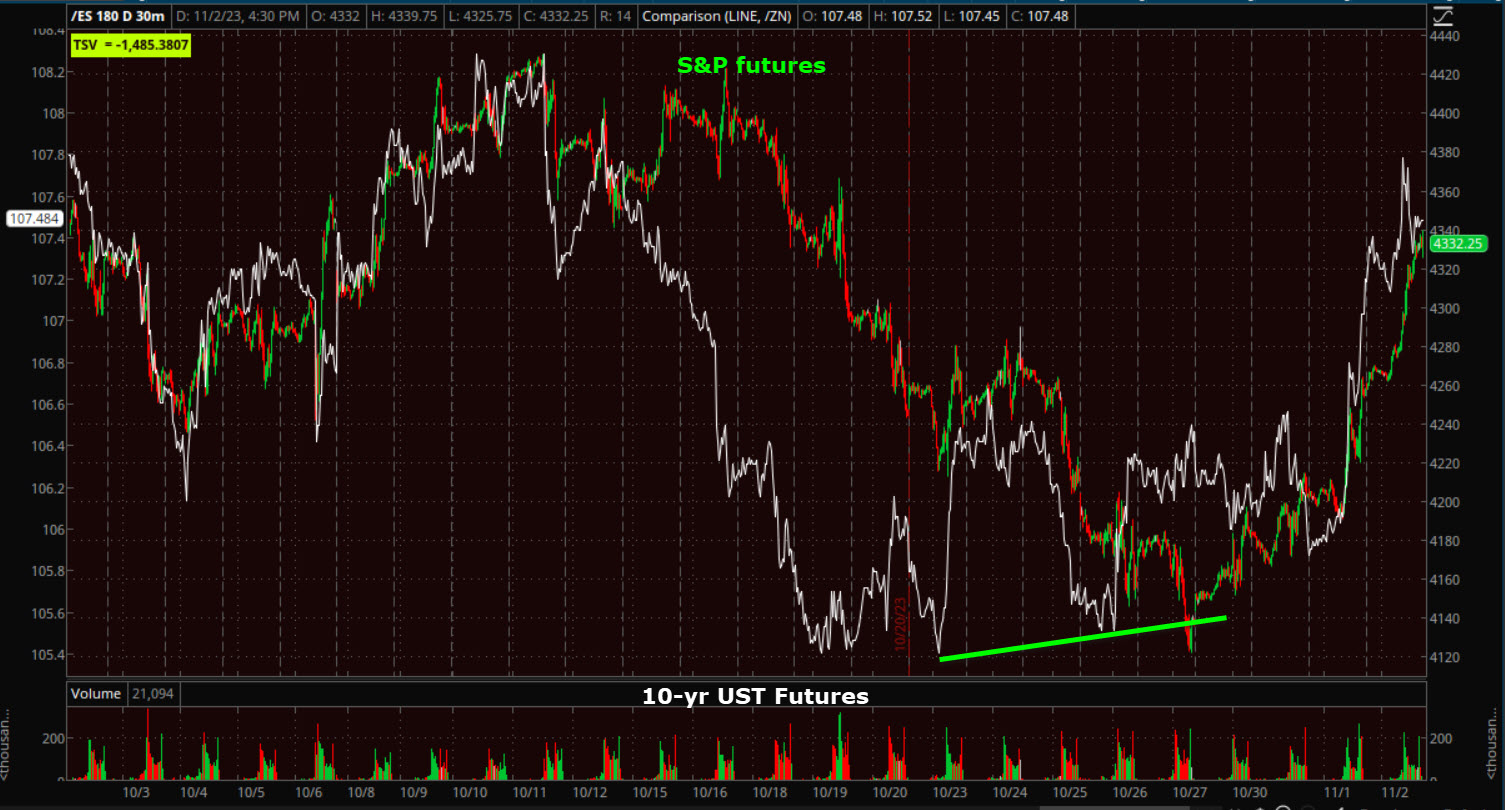
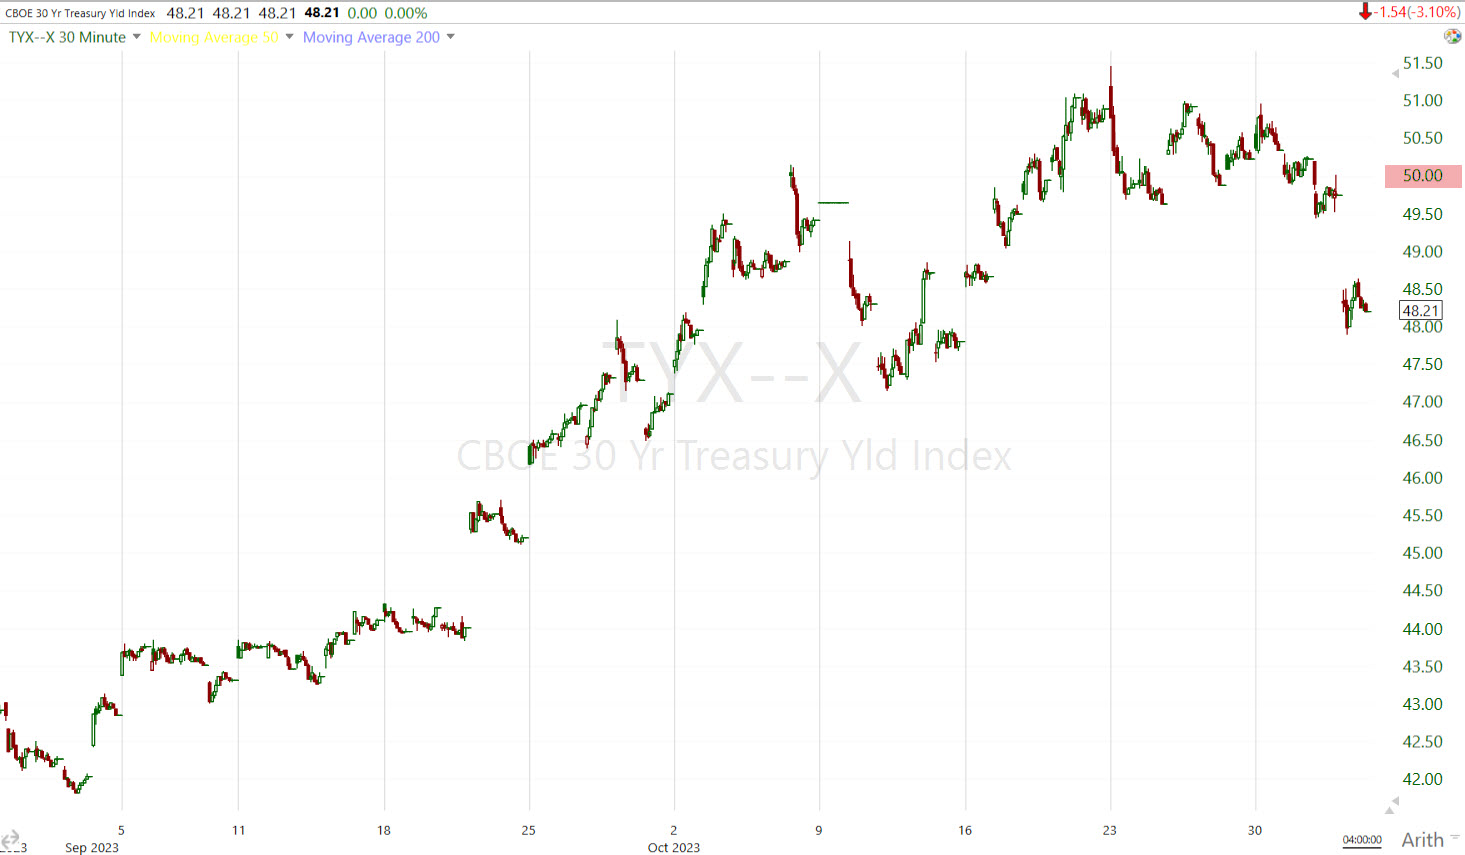
This chart shows it all…Yields (inverted) lead the equity market…
 (30m)
(30m)
Something that my favorite market leading indicator was already aware of. Recall how many times last week I posted HYG was positively diverging from the S&P-500?
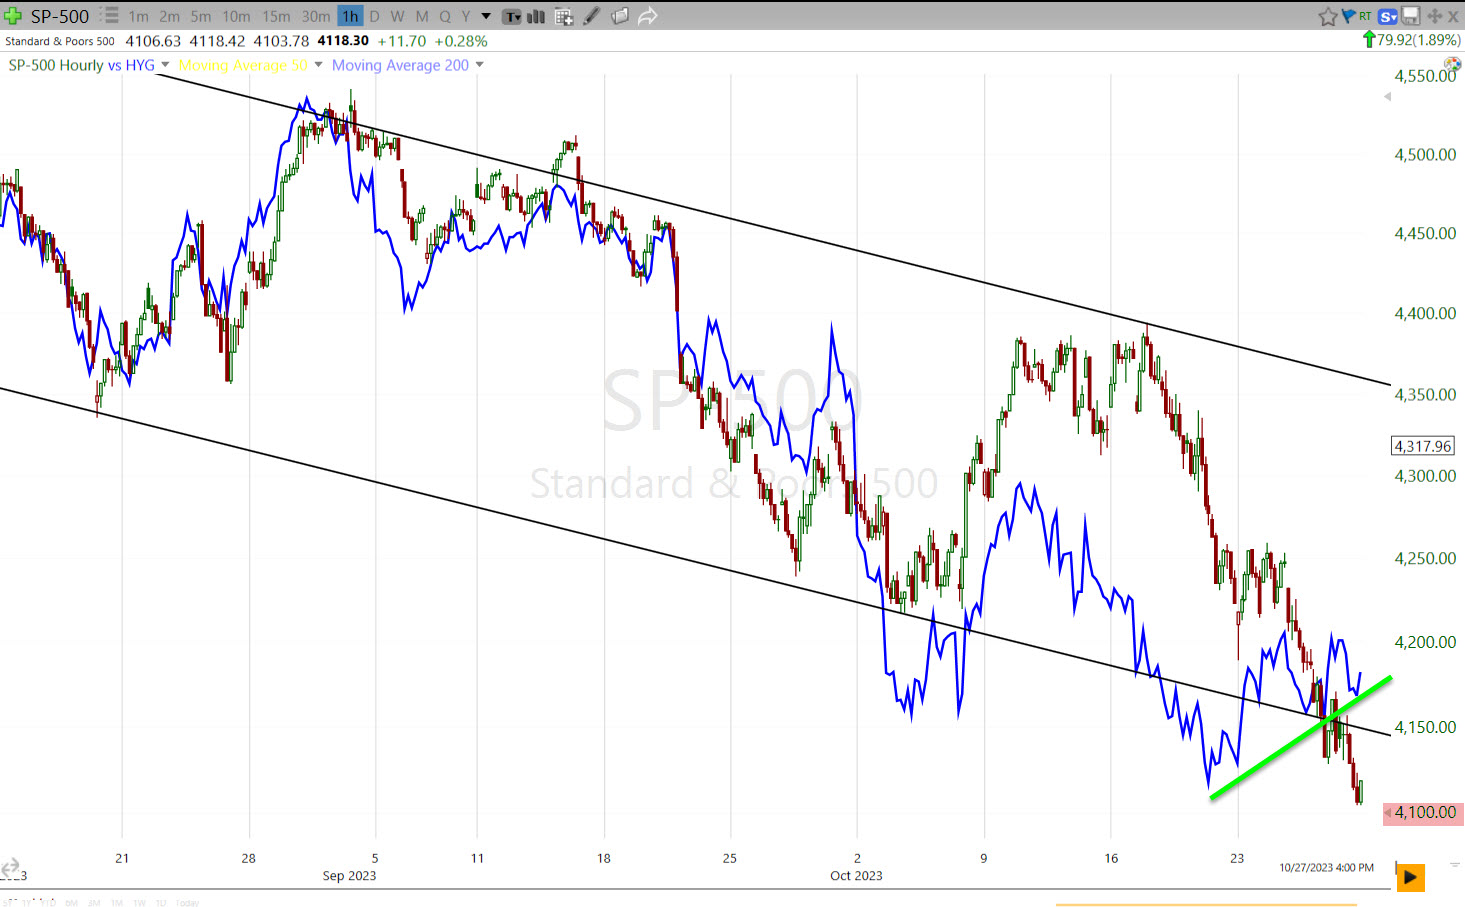 And that as the S&P-500 was hitting the bottom of the sub-intermediate downtrend, and essentially fulfilling its H&S top’s downside measure move target (4085-$4100), coming less than a tenth of a percent, or 3 points from $4100.
What happens after big measured moves are hit? A consolidation or correction, but in this case, a durable low and correction was looking more and more likely. The only thing that surprises me a little is how fast and strong the bounce has been, but being the start of a new quarter with new inflows and positioning coming in to effect, favorable seasonality, extreme recent bearishness in sentiment, and about 70% of the S&P companies out of the corporate buyback blackout window (until December 8th), it probably shouldn’t be all that surprising.
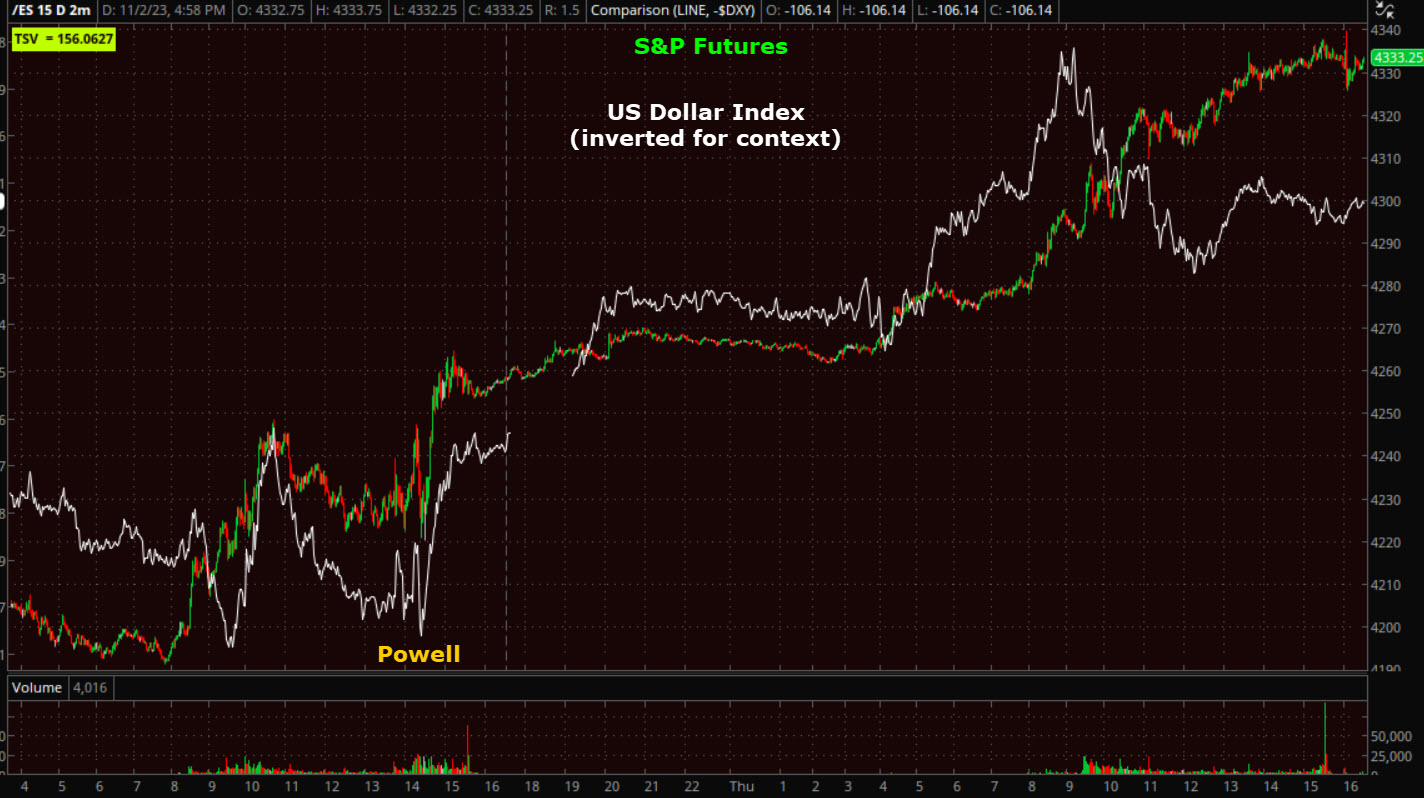
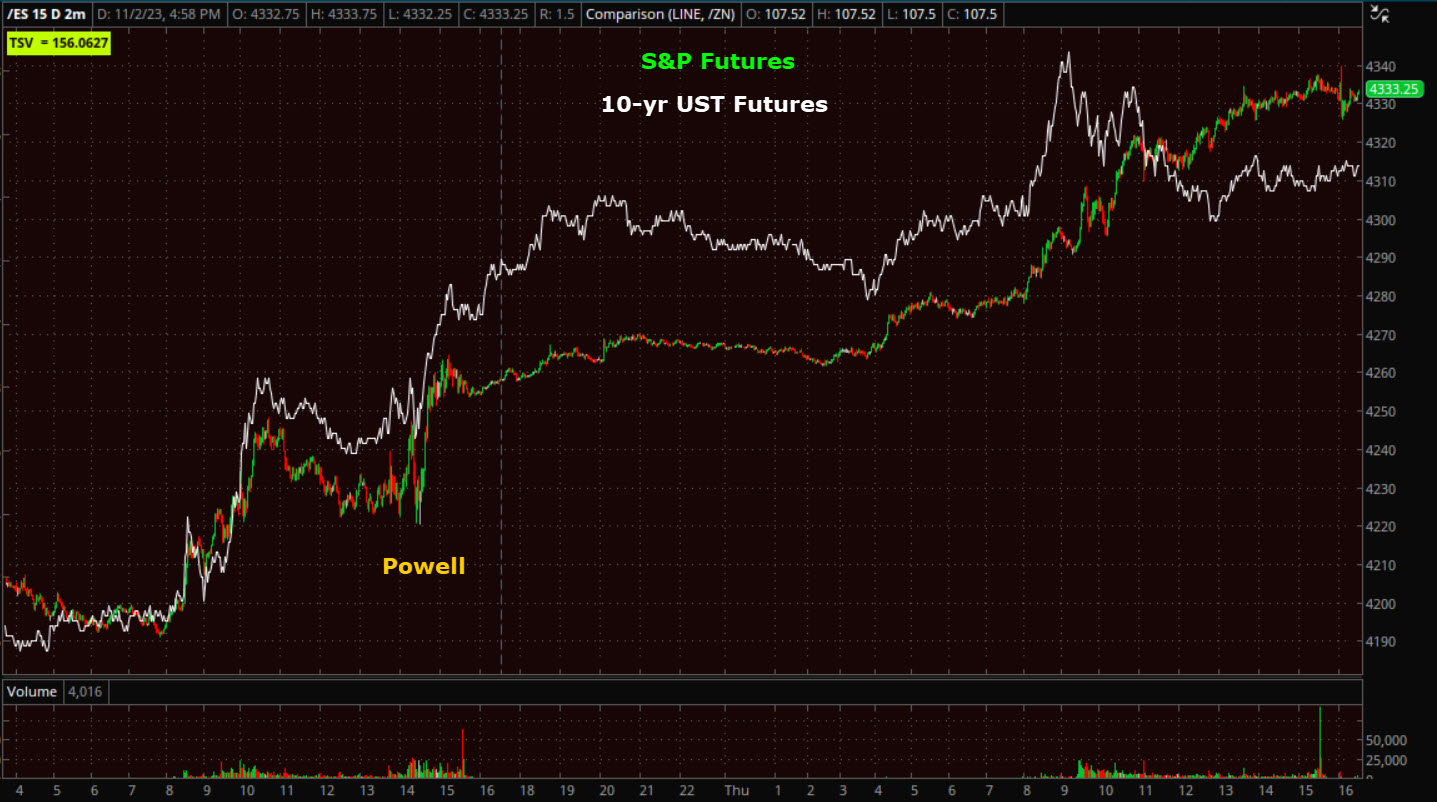
Yields and the Dollar continued to fall overnight since Powell’s press conference has been taken in (the market’s initial take yesterday was dovish) and the conclusion was, DOVISH, or MORE DOVISH. That sent yields and the Dollar lower and stocks tracked nearly perfectly with their inverse correlation to both.
S&P futures and Rates
 (2m)
(2m)
S&P Futures and U.S. Dollar
 (2m)
(2m)
If you’ve been with me for more than a month, you now that I have been preaching that the most important driver of equity market direction is the inverse correlation with Rates and the Dollar; and the market just got an early Christmas gift with both plunging on a reasonable correction in yields after the 10-year hitting 5%, a better-than-feared Treasury Refunding statement, weak ISM data and a very dovish Fed/Powell, combined with all of the other things mentioned above.
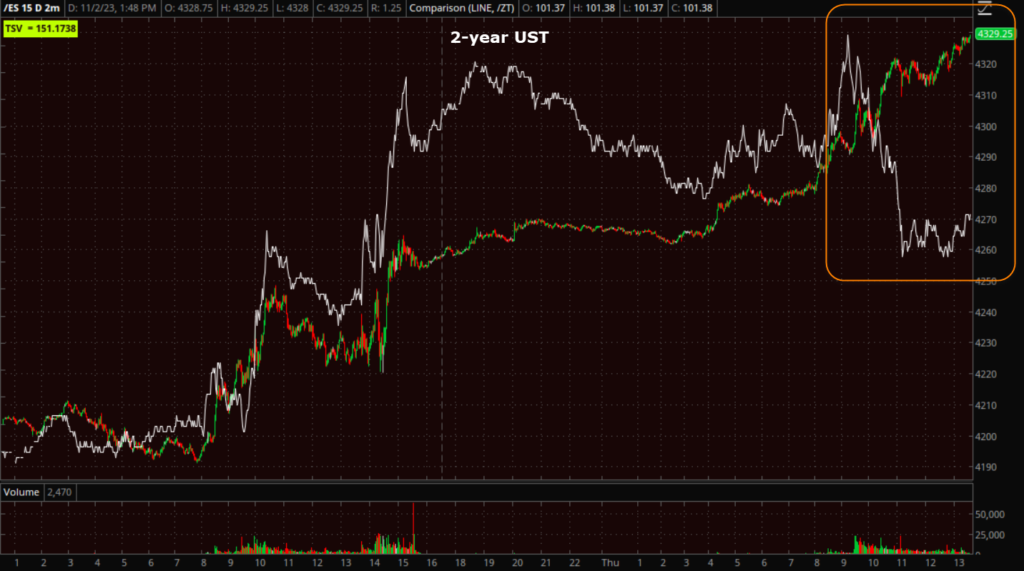
*I do want to point out the slight negative divgernece between rates (2y most) and the Dollar during this afternoon’s session. With rates, it is more noticeable with the Fed-sensitive 2-year yield. I wrote about it this afternoon in this market update. Just keep that in mind as you go through the post.
The 10-yr note yield is down nine basis points from yesterday at 4.68%. It had been down as low as 4.63% earlier. The activity in Treasuries has been aided by some softening manufacturing PMI data out of the eurozone, the Bank of England’s decision to keep its Bank Rate unchanged at 5.25%, some short-covering in the Treasury market as well, and the Q3 productivity report showing a 0.8% decline unit labor costs.
Today’s trade was bolstered by the idea that the Fed could be done raising rates. The bond market told us that months ago when the 2-year yield crossed below the Fed funds Rate. That thinking has followed on the heels of remarks made yesterday by Fed Chair Powell at his press conference following the FOMC meeting.
Averages
I often mention how gains of short squeezes in my Most Shorted Index benefit Small Caps the most, and in recent days how Small Caps have been putting in what looks like a small base. It’s not surprising that Small Caps easily outperformed on the day as we had one of the most impressive short squeezes I can remember seeing.
While the NASDAQ and mega-caps weren’t the driving force or leaders today, the NASDAQ did come in to this with a 2-day head start of its chart looking better, the most rapidly improved 3C chart by Friday, and is now up 5 days in a row and on pace for its best week since November of 2022.
S&P-500 ⇧ 1.89 %
NASDAQ ⇧ 1.74 %
DOW JONES ⇧ 1.69 %
RUSSELL 2000 ⇧ 2.67 %
I’ll deal with the S&P in the Summary section below.
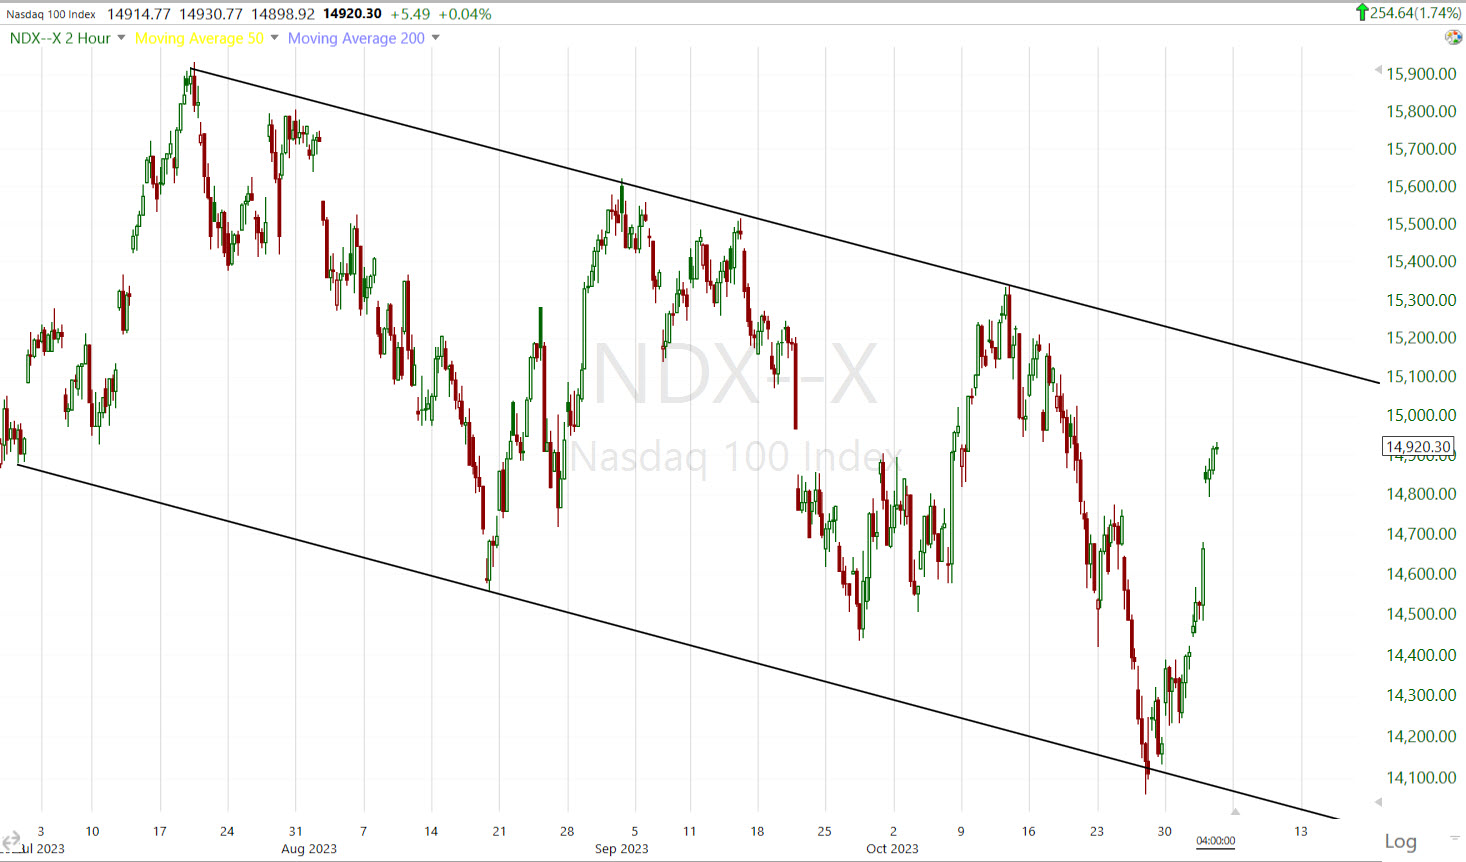 The NASDAQ-100 (2H) has the widest channel, therefore it’s the furthest from the top of the channel which is about +1.8% above still.
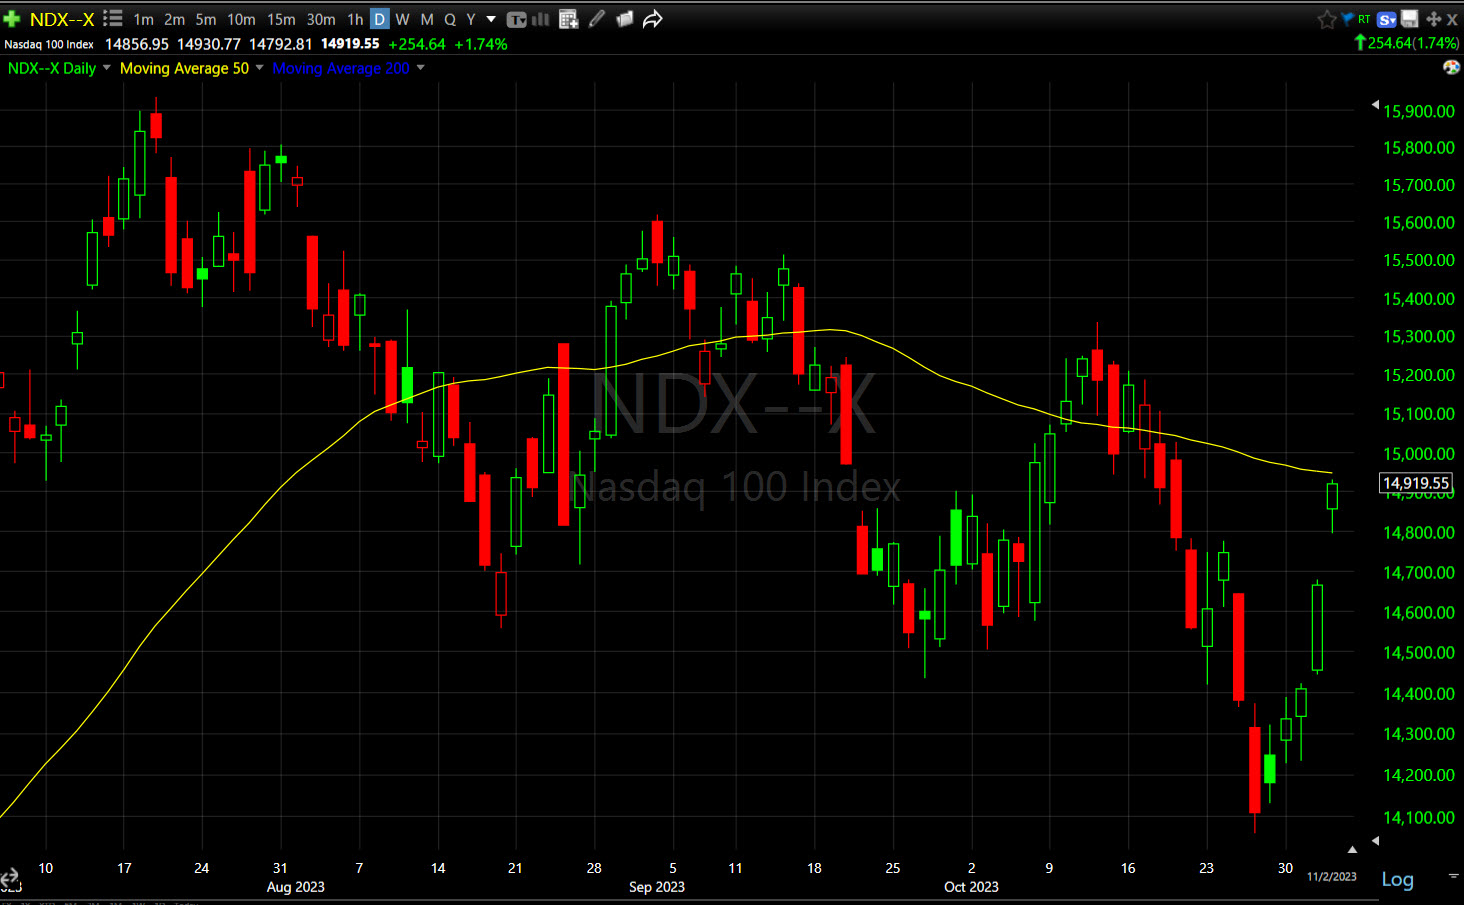 NDX (daily) being up 5 days in a row and running in to its 50-day, I wouldn’t be surprised to see some consolidation, maybe fill in some of the gap created today on the open before trying to reach the top of the down trend channel. Another thing I want to point out, while this rally is rip-roaring strong, look at the price trend on this chart. It’s one of lower highs and lower lows. Even if it hits the top of the channel, it will still be lower highs/lower lows. That’s the definition of a downtrend, so what we’re getting right now is a counter-trend bounce or rally in a sub-intermediate down trend.
3C still looks pretty good, but it doesn’t have the energy it had a few days ago…
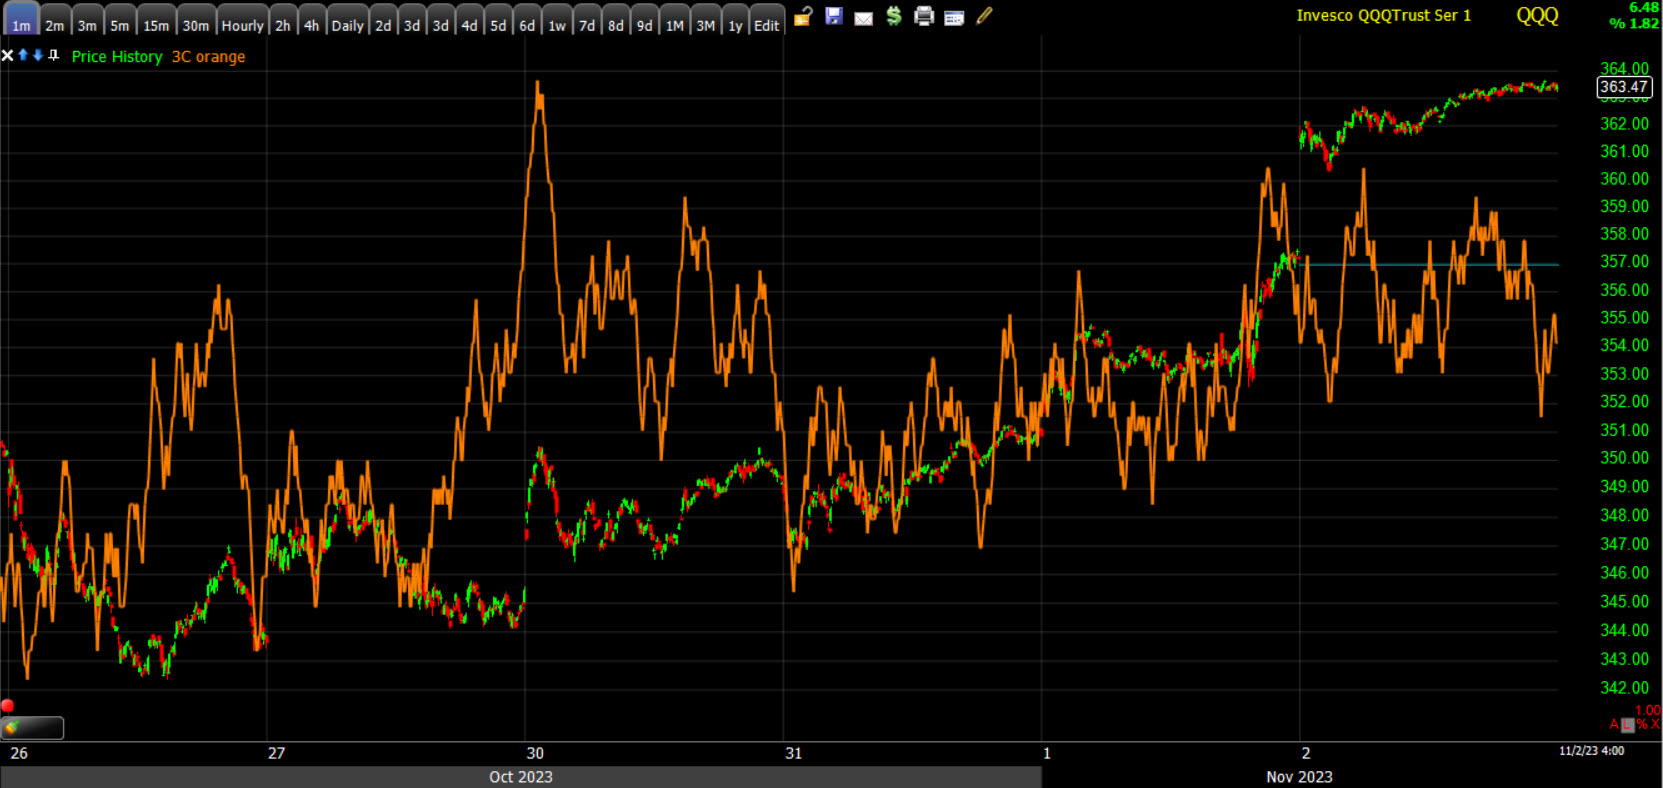 QQQ (1m)
The Dow is also at its 50-day and 200-day…
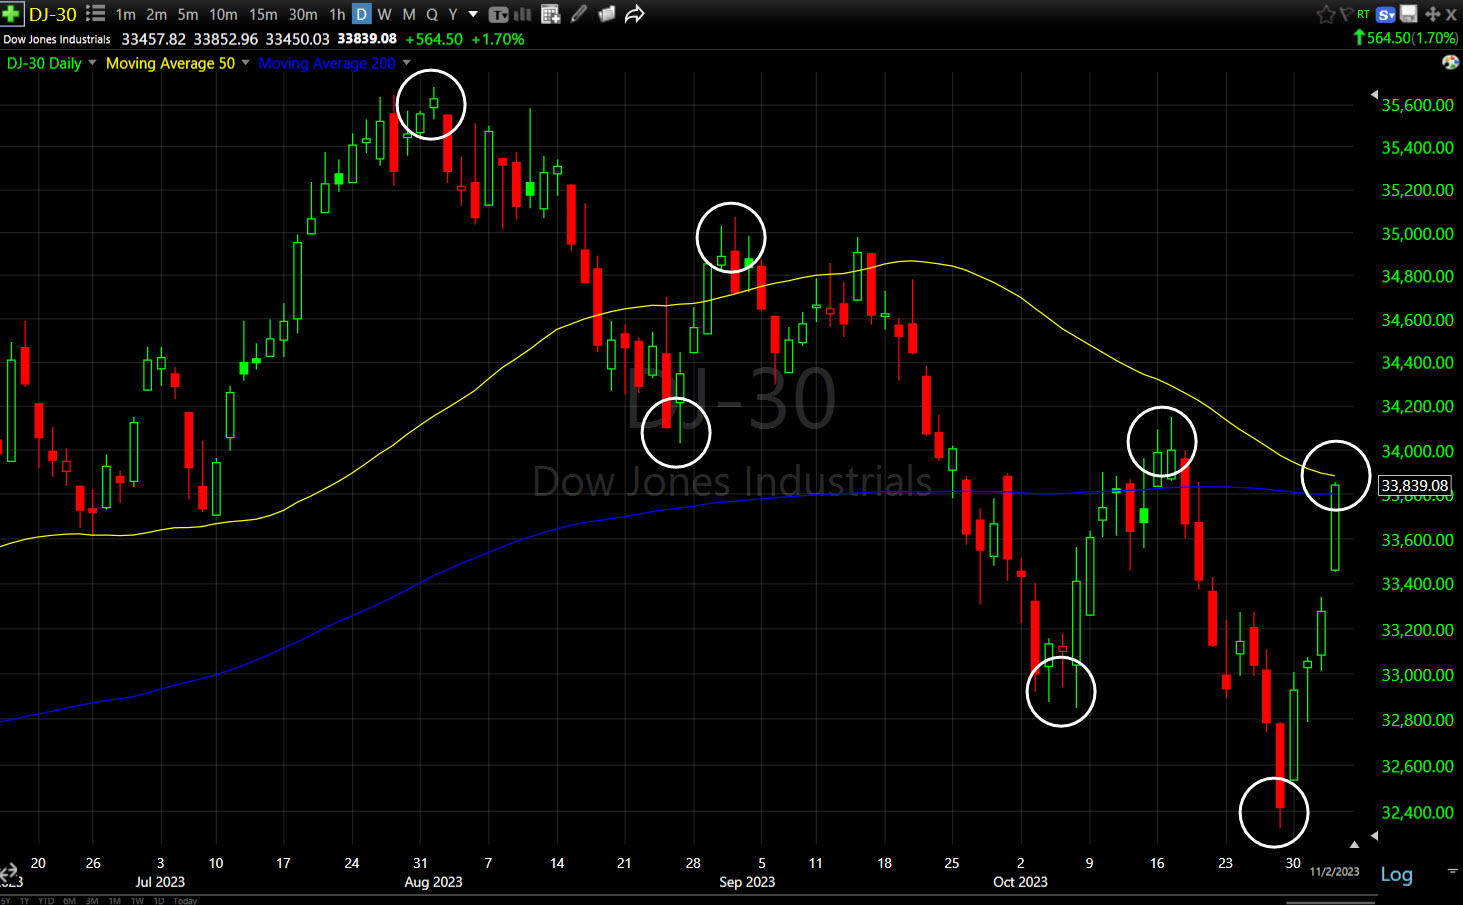 Dow (daily) – like the NASDAQ-100, this is a sub-intermediate down trend too. I highlighted the lower highs/lower lows in white.
The Dow’s 3C chart is in line with, or confirming price, so it still looks pretty good right now, but this is an interesting area in the very short term.
The Most Shorted Index is up over 5%, the biggest daily squeeze since February. This short squeeze/chart just blows my mind.
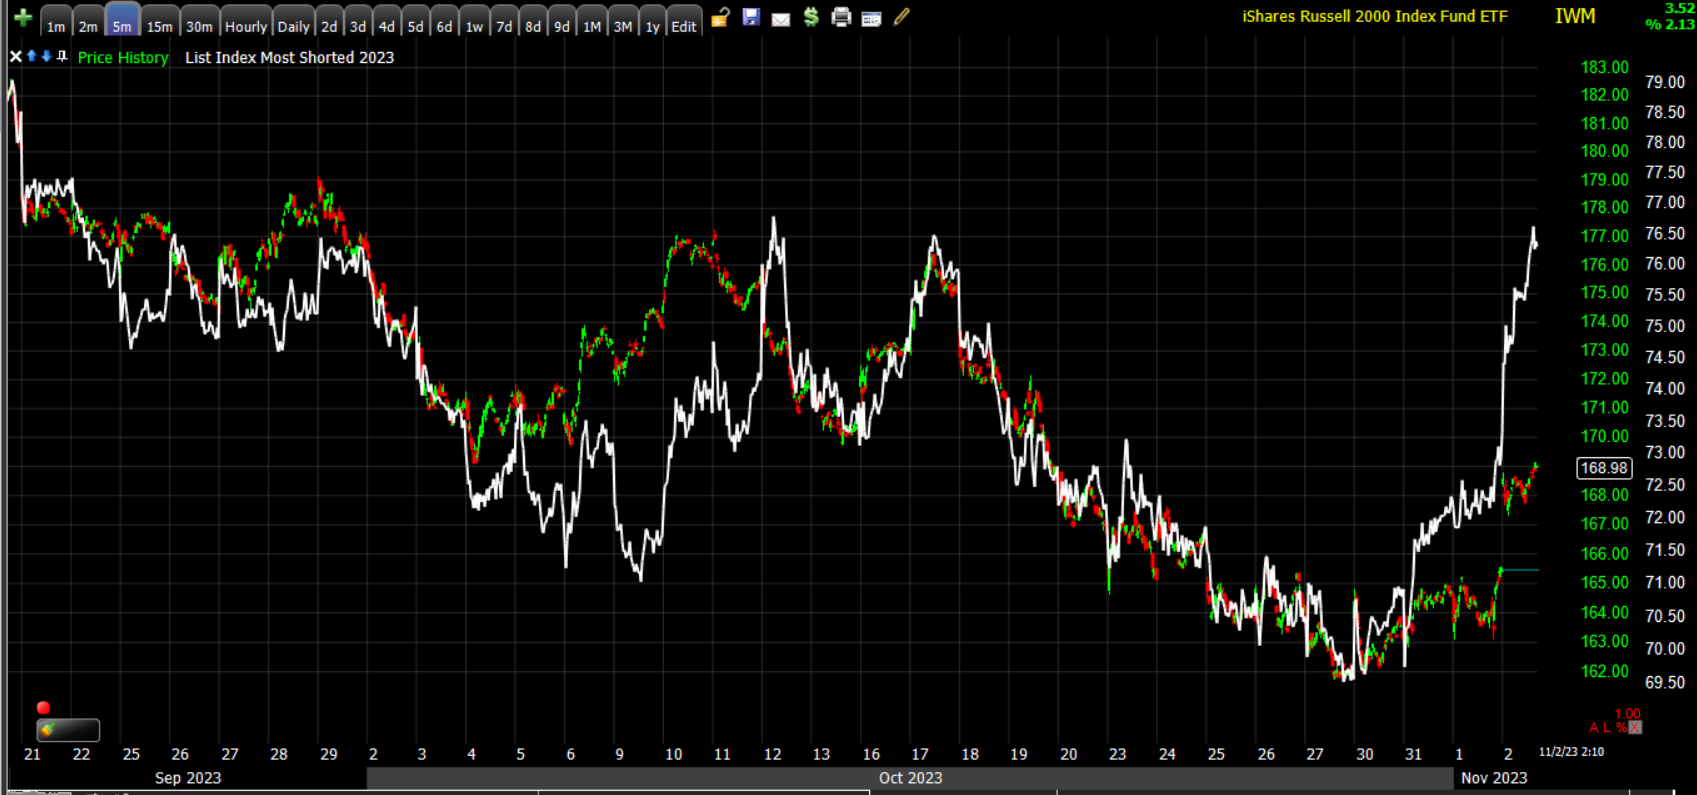 SP-500 (5m) and my most shorted index. That’s a short squeeze!
The shorts were on the lazy side yesterday and not worried after Powell, but the were hammered this morning. Interestingly, I was able to find Goldman Sach’s official Most Shorted Index…
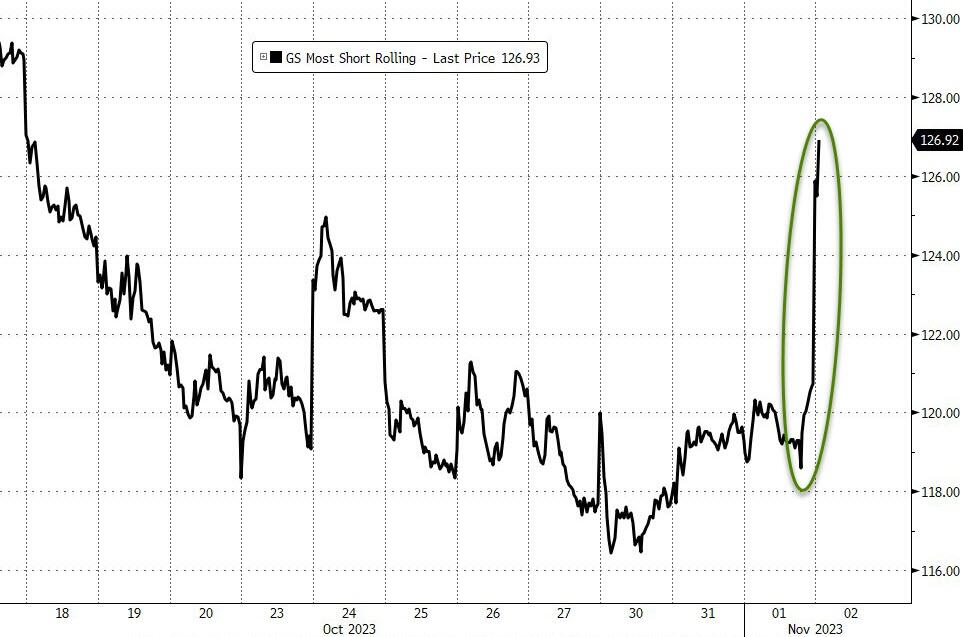
Naturally, I wanted to compare it to mine. I took off the S&P and changed the chart color so it would look similar. Here’s mine…
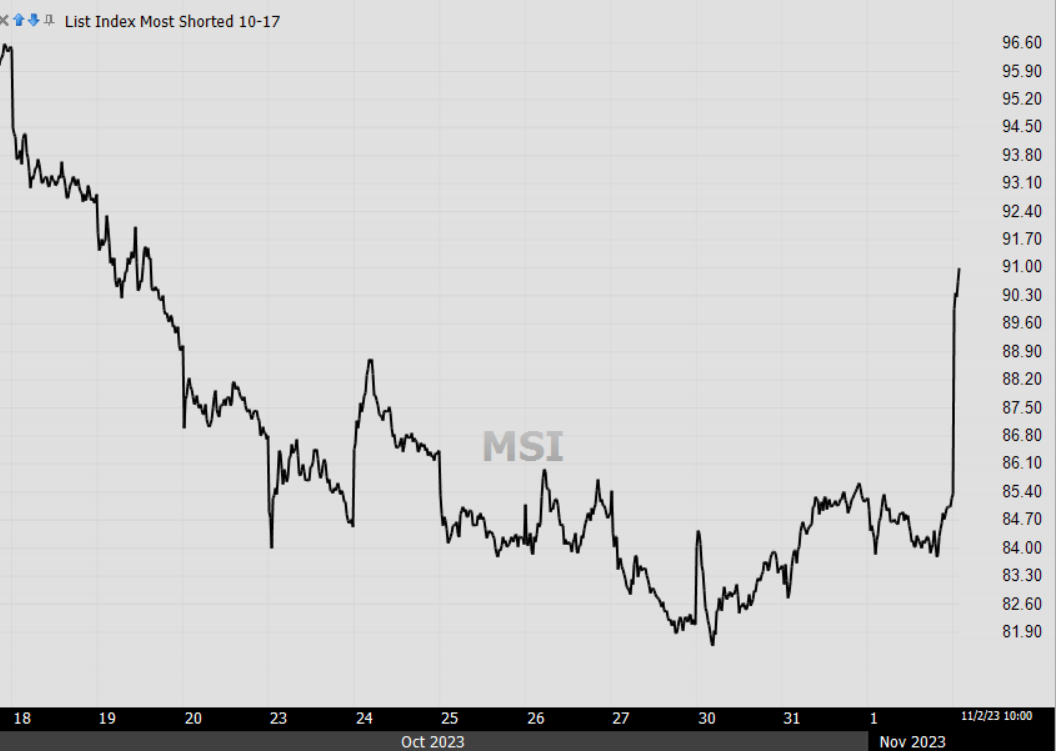
I’d say they’re pretty much exactly the same, just the scaling is a little different. In any case, this was a major help for Small Caps which broke out of their base I’ve been talking about.
Small Cap IWM even fulfilled its base’s upside measured move and then some with the help of the squeeze and Regional Banks.
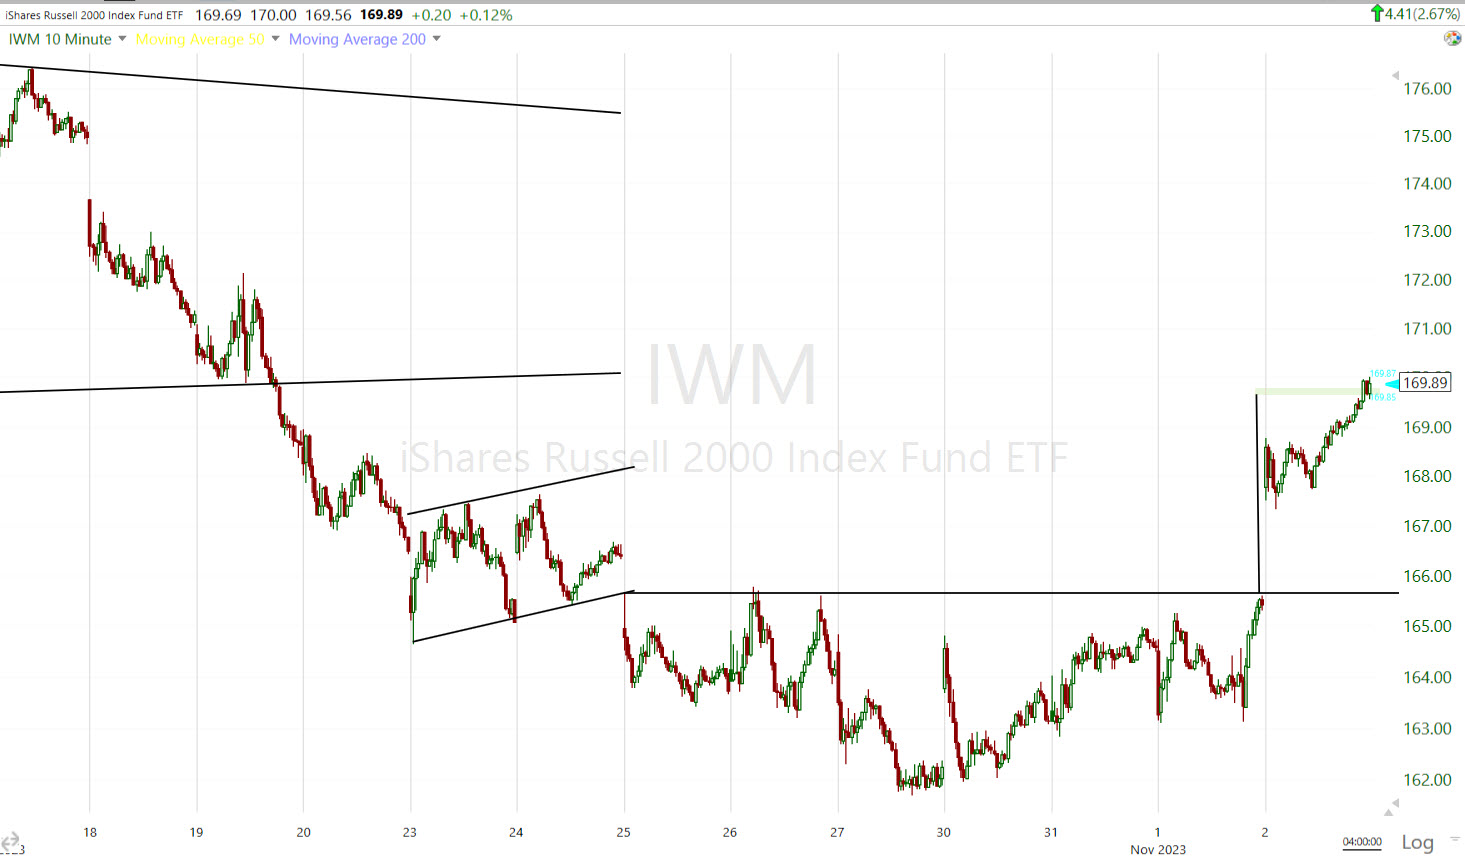 IWM (10m) base and measured move. IWM’s 3C chart got a little tired looking this afternoon. It’s not horrible, but it could very well be in like with what usually happens when a measure move is met… Consolidation phase… or reversal.
VIX (-7.15%) is acting normal today for the move in stocks. It was the relative weakness building up prior to this week that was important. VVIX (-2.15%) continues to show better relative strength the last few days, but it hasn’t turned to a trend change, but I wouldn’t be surprised to see it in the next week or so.
The Absolute Breadth Index increased to 33 today as it should have with such strong participation across the board n equities.
S&P sectors
Just about everything came along for the ride in the stock market. 29 of the 30 Dow component stocks closed with a gain and all 11 S&P 500 sectors closed in the green.
Sector bias was mixed, unlike yesterday’s mega-cap leadership. In the top 3 performing sectors we have a defensive bond proxy, Real Estate, which makes sense given the rally in bonds and drop in rates. We have a pro-cyclical sector -Energy, and another pro-cyclical, but it’s really known as a mega-cap heavy sector – Consumer Discretionary. That covers the 3 sector “food groups”.
The worst performing sector was the defensive bond proxy, Consumer Staples, but it still closed with a +1.3% gain.
The mega-caps (MGK +1.9%) were along for the ride, but weren’t in the driver’s seat as the S&P Equal Weight Index gained +2.2% which reflects the broad participation in today’s rally, but it’s also interesting that the mega-caps weren’t driving as a double digit drop in yields is like gasoline on a fire for the mega-caps.
Materials ⇧ 1.93 %
Energy ⇧ 3.02 %
Financials ⇧ 2.36 %
Industrial ⇧ 2.06 %
Technology ⇧ 1.69 %
Consumer Staples ⇧ 1.30 %
Utilities ⇧ 1.87 %
Health Care ⇧ 1.59 %
Consumer Discretionary ⇧ 2.61 %
Real Estate ⇧ 3.10 %
Communications ⇧ 1.32 %
A big reason Small Caps outperformed were Regional Banks, up a whopping +5.7% after Bill Gross called the bottom in regional banks.
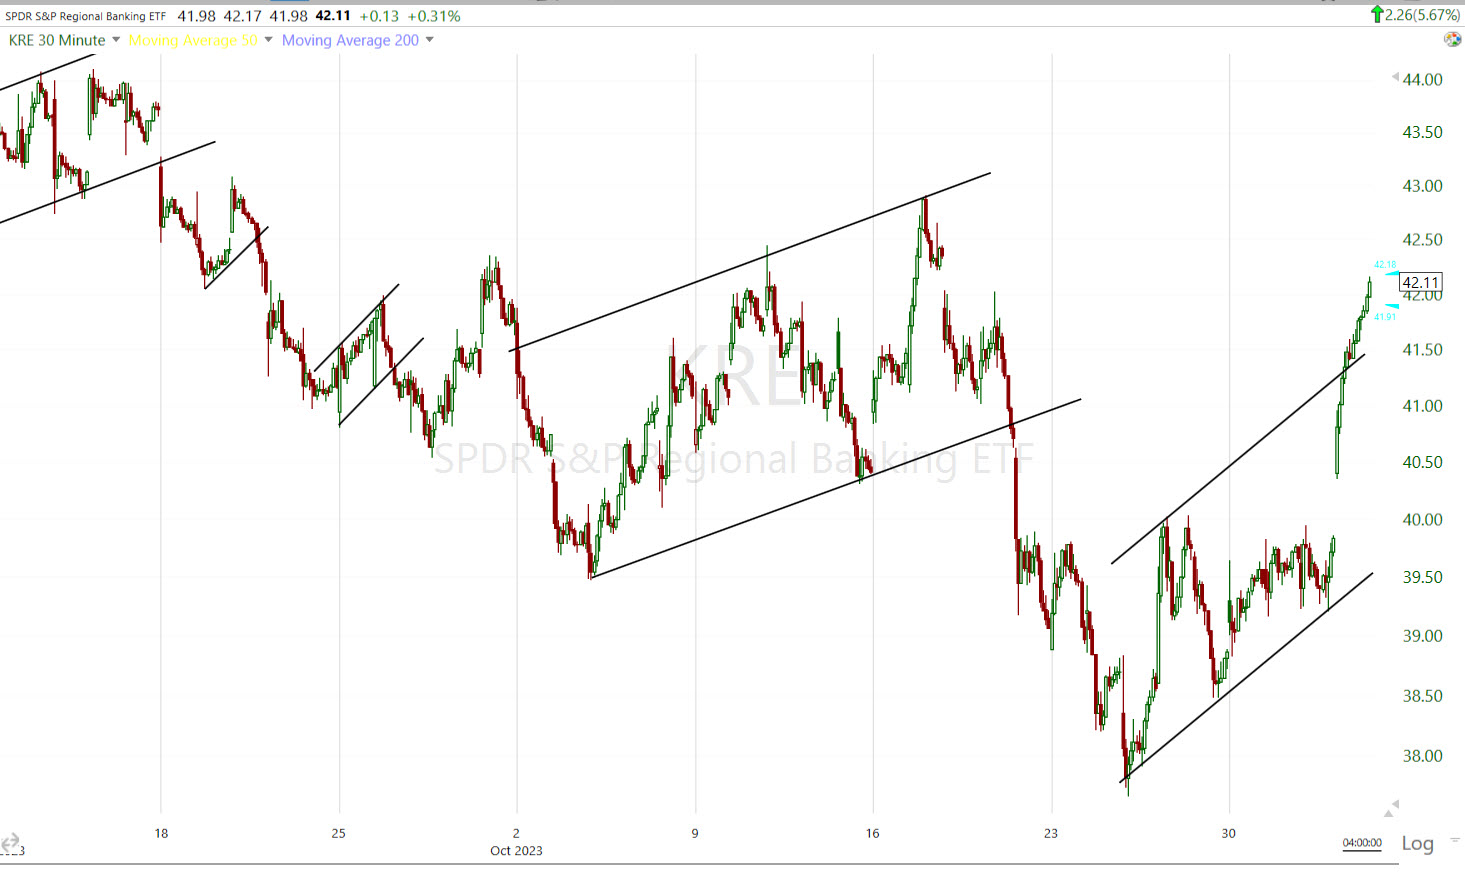 Regional Banks (30m) price blew out of the top of the bear flag. I won’t call the flag invalidated yet. If price comes back inside fairly quickly, that’s often like a channel buster, which is the same concept as “Failed moves, lead to fast reversals”, but this is definitely an interesting one to watch.
I was running through S&P sectors’ charts today and the insignificant, lightly weighted Materials sector jumped out and I thought I’d take the opportunity to show a near perfect unfolding of a H&S top and what happens next.
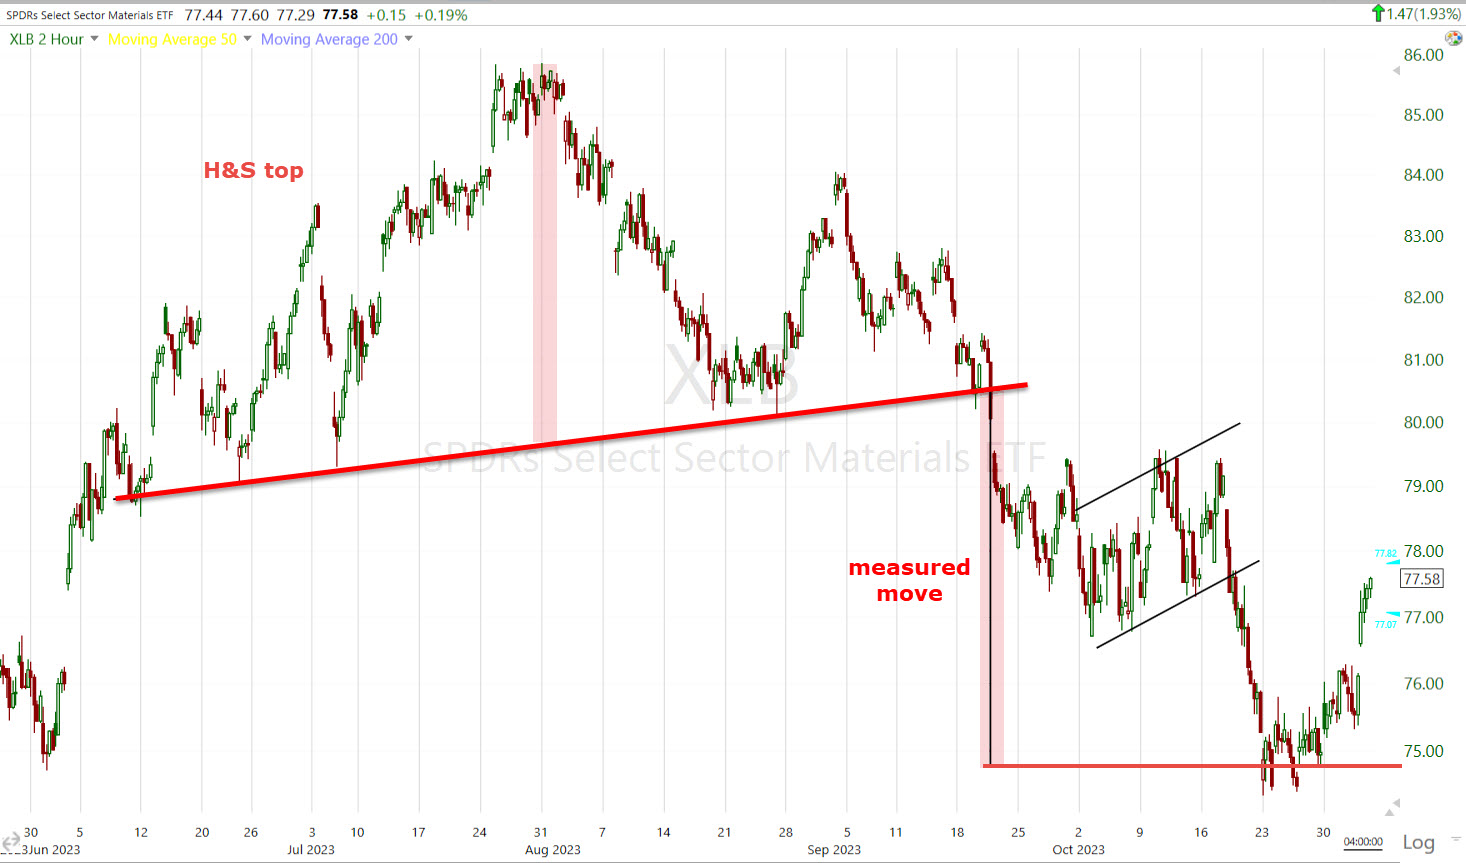 Materials sector (2H) the H&S top’s neckline breaks, price falls and about the midway point there’s a bearish flag consolidation. Then a second leg down out of the bear flag to tag the measured move nearly perfectly. At that point, it just depends on the market environment. Price can put in a large consolidation or a dead cat bounce to relieve the oversold tension that’s built up. Ultimately if you track the highs and lows of the trend, what you’ll see from the top of the H&S formation is a pattern of lower highs and lower lows. Nothing moves in a straight line in the market and this is a near textbook example. Just don’t forget the most important part… the price trend has changed from up to down.
Reactions to earnings news was generally positive, which acted as added support for the broader market. Qualcomm (QCOM +5.8%), Eli Lilly (LLY +4.7%), and Starbucks (SBUX +9.5%) were winning standouts in that respect.
Meanwhile, Airbnb (ABNB -3.3%) and Moderna (MRNA -6.5%) traded down after reporting earnings.
Internals
NYSE Advancers (2519) outpaced Decliners (345) by a whopping 7-to-1 ratio on volume of 1 bln shares. That’s a strong day with broad participation.
The Dominant price/volume relationship is nearly perfectly split between the most bullish relationship: Close Up/Volume Up, and the most bearish relationship: Close Up/Volume Down. Since it’s not dominant in either one, there’s no 1-day overbought internals signal.
Breadth oscillators are at 71 so we’re nearing the reset to overbought that’s common after such a long and deep oversold period. Said another way, I don’t think this market is done with the upside gains on this bounce.
Treasuries
The 10-yr yield fell another -12 basis points today to 4.67% while the 2-yr yield was down this morning, but rose one basis point to 4.98%. I mentioned this in the afternoon here, with this chart as a potential signal worth watching if it continues to diverge notably further from the S&P.
The drop in long term rates was stoked by some softening manufacturing PMI data out of the eurozone, the Bank of England’s decision to keep its Bank Rate unchanged at 5.25%, some short-covering activity in the Treasury market as well, and the Q3 productivity report showing a 0.8% decline unit labor costs.
The 10-year and 30-year yields pushed further below 5%, but the Fed-sensitive 2-year yield moved back up towards 5%, which is what I was highlighting this afternoon because it’s something to watch and may very well inform us on the short term equity trend and timing of a potential reversal after targets are met.
The 10-year yield is now in correction rather than consolidation, but the up trend is intact (higher highs/higher lows).
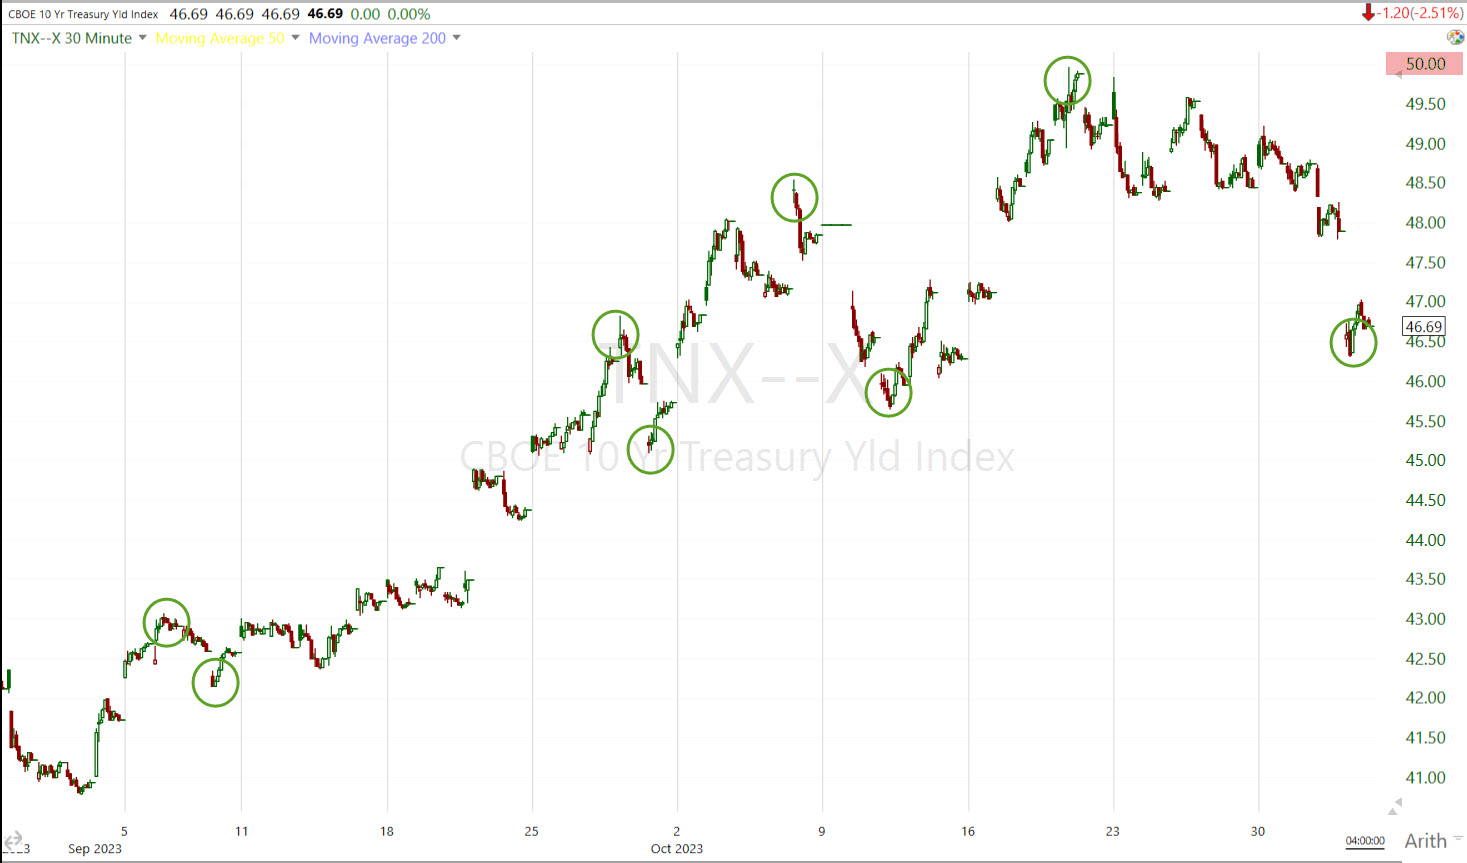 10-yr yield (30m) we don’t need trend lines to see the trend of higher highs and higher lows.
 And the same for the 30-yr yield.
High yield Credit (HYG +1.15%) is fine as far as the price trend. Recall that HYG was leading the S&P to the upside last week.
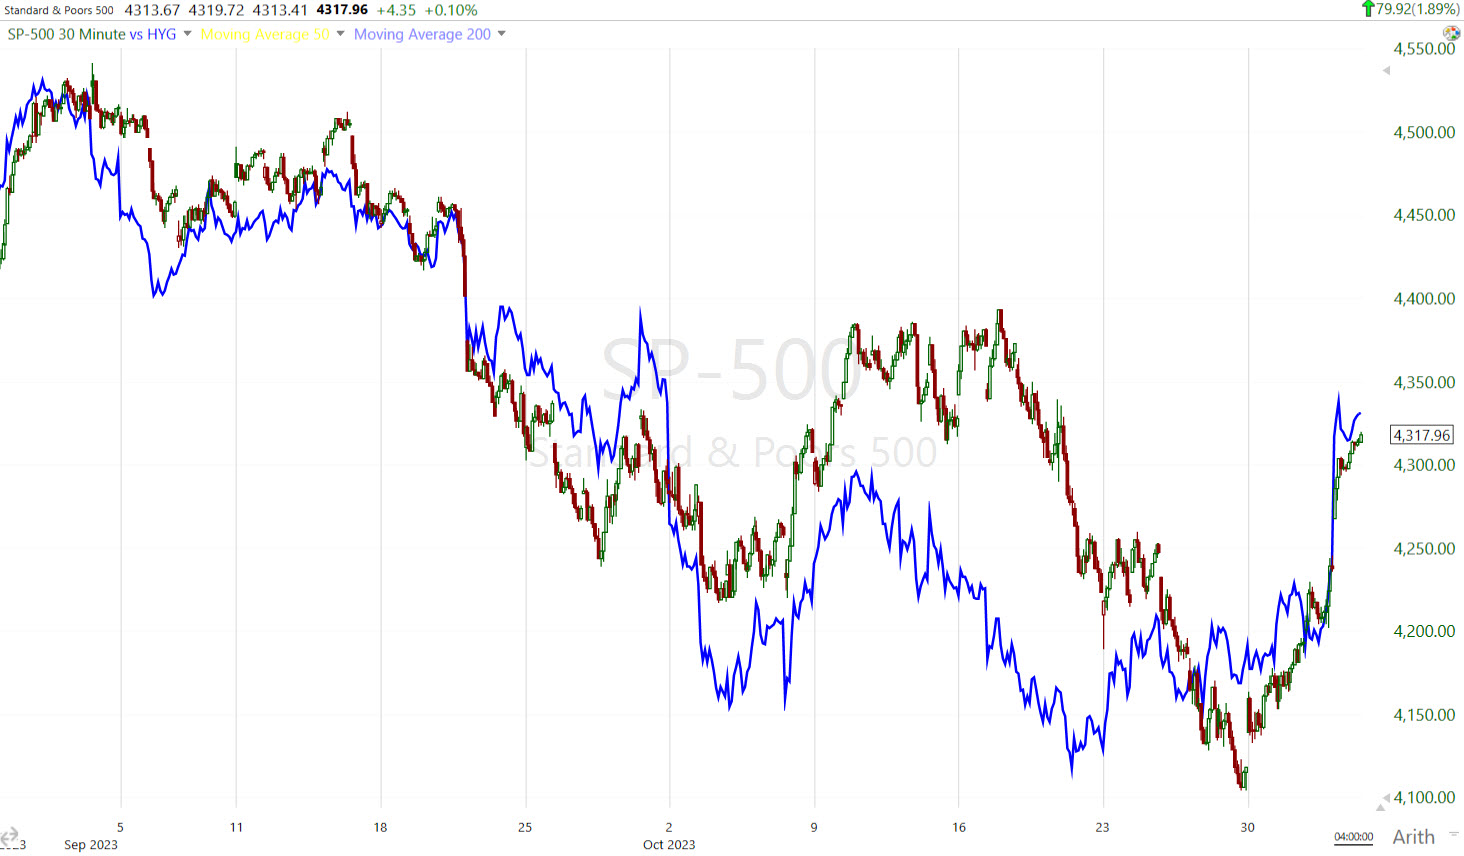 SP-500/HYG (30m)
What is interesting, considering HYG is the playground for institutional traders, and with so many 3C charts of the averages confirming well, is this chart…
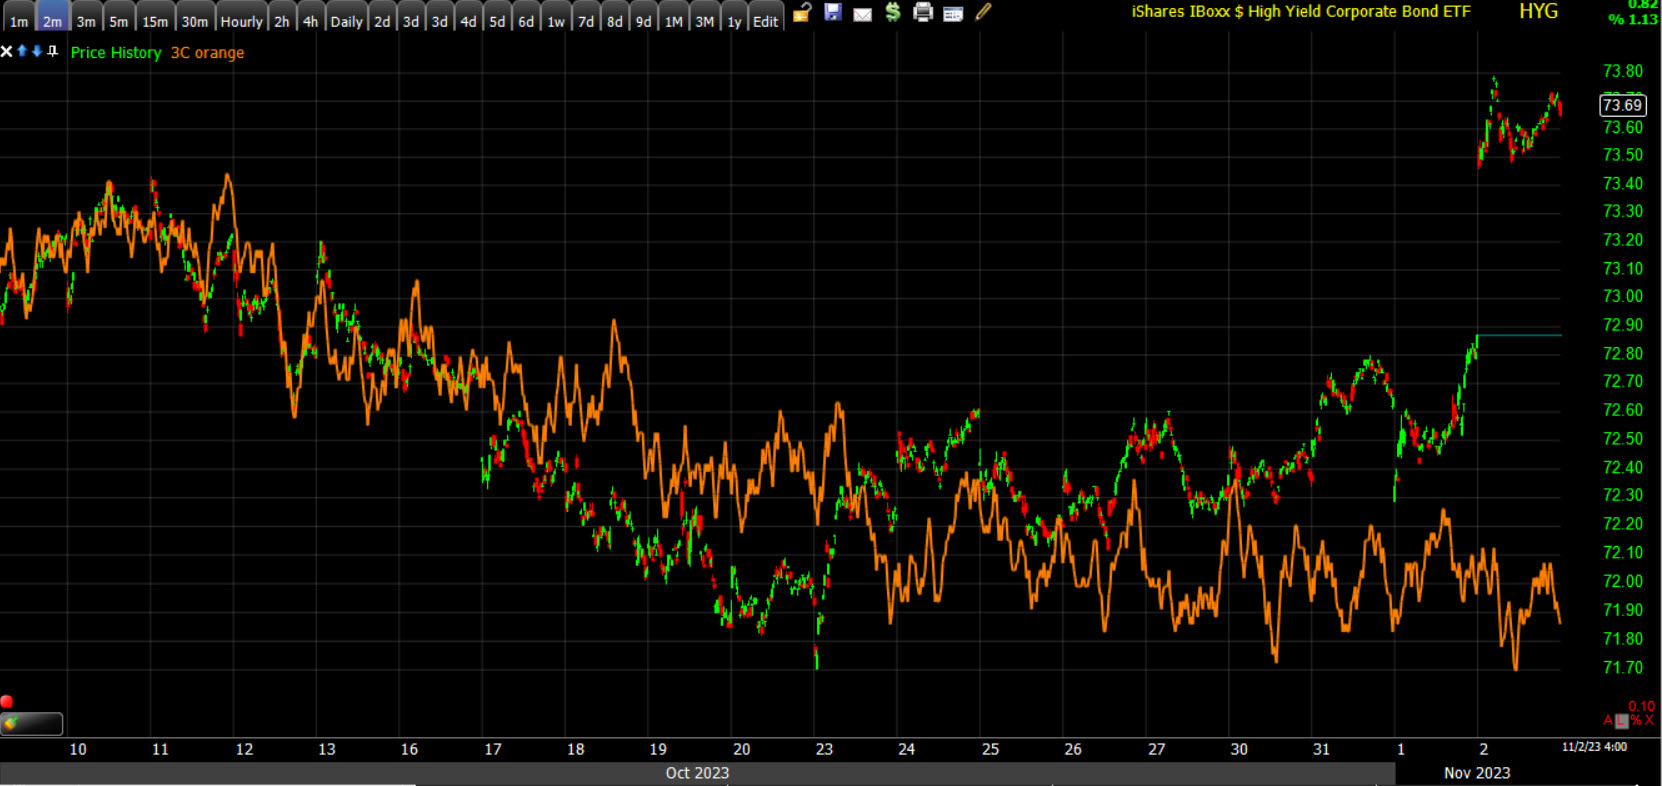 HYG (2m) 3C is not confirming this jump higher at all.
I don’t see this as actionable yet, but it’s one of those early signs on the radar.
Currencies and Commodities
The U.S. Dollar Index lost about -0.7%, but off this morning’s -1% The Dollar extended yesterday’s drop with the biggest daily drop since September 11th. The Dollar is on pace for its biggest weekly drop since July. As you know, stocks have a strong inverse correlation (right now, but not always) with the Dollar, so this has been a massive tail wind for stocks.
WTI crude oil futures gained +2.4% today to $82.57/bbl and natural gas futures settled flat at $3.76/mmbtu. Crude’s gain doesn’t change a thing about it’s recent weak price action and bearish turn. If you look at the price trend…
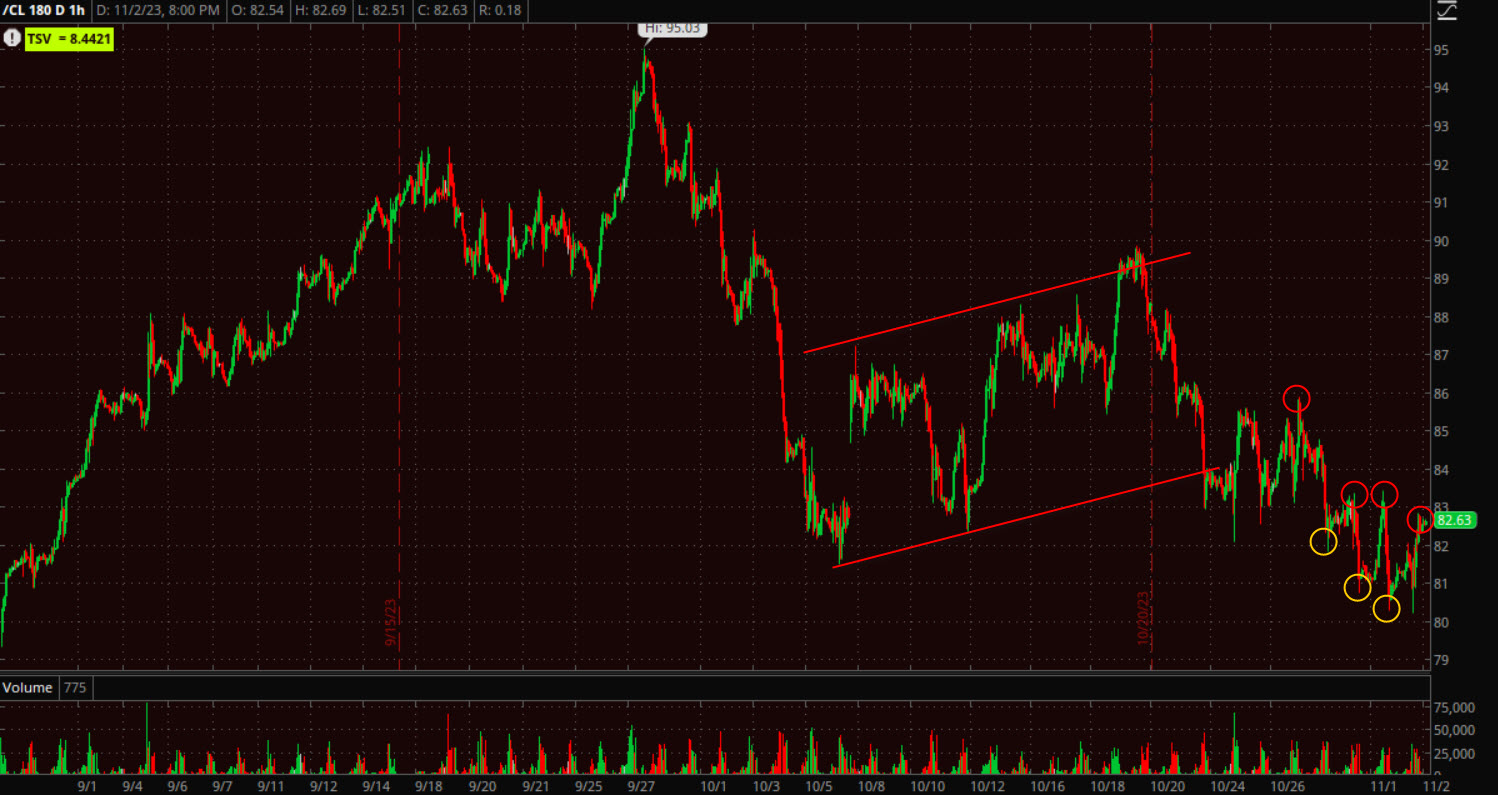 WTI Crude (60m) – What you see is price falling out of a bear flag and on a slow steady grind lower with a general trend of lower highs (red) and lower lows (yellow).
Does a crude short here excite me? No. It’s a slow grind lower. Would I want to be long Crude? No. That’s just my personal preference, I think there are better assets out there, but if you are in crude, at least you know what’s going on. And if your looking at the macroeconomic picture, crude isn’t sending a crash signal or imminent recession, but it is not saying anything good about the economy either. Especially with a war in the middle east that it has a lot of potential exposure to and probably should be acting much better than it is.
Again, considering Dollar weakness and sharply lower yields, Gold’s performance wasn’t impressive either, but remember that it is fighting a strong correlation with sharply higher yields relative to its positioning.
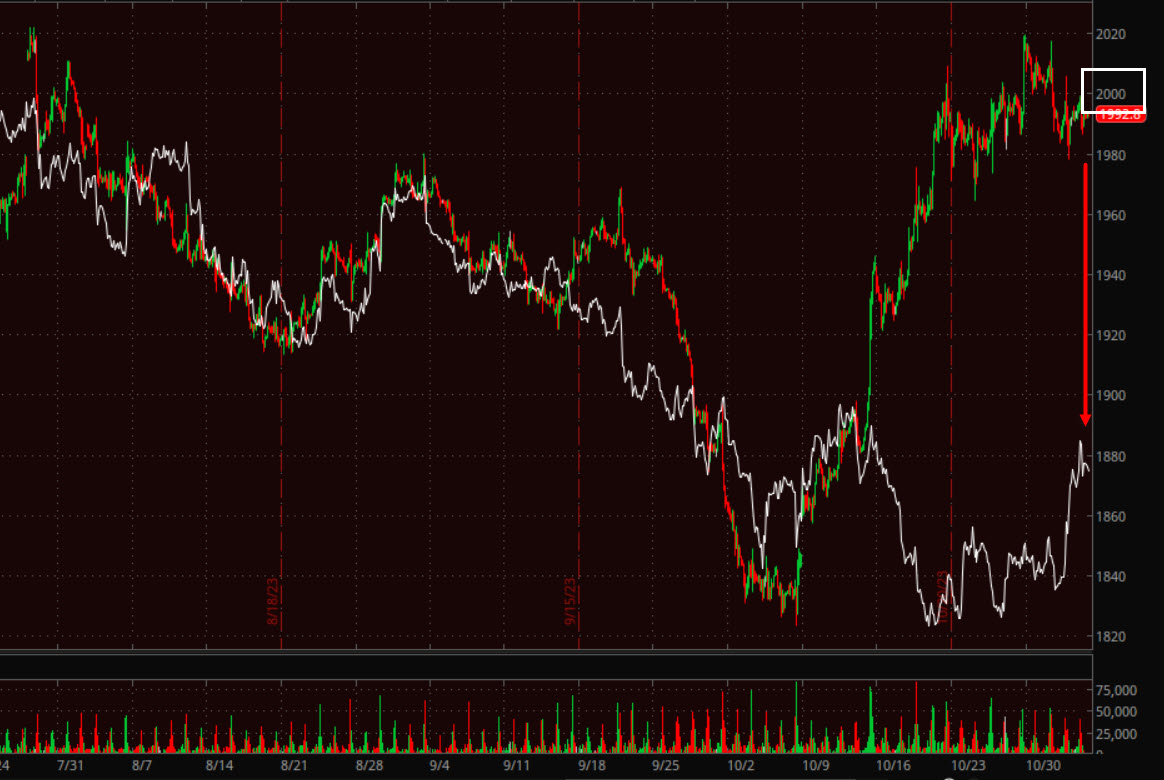 Gold futures (60m) and 10-year UST futures. Gold broke away from the correlation on a flight to safety bid, but that correlation is like a magnet for price.
Gold futures gained just +0.3% to $1,993.50/oz. The issue with gold is it’s attempted breakout above $2,000 has not been successful, and unless the war in the middle east gets a lot worse and drives another flight to safety bid in gold, I’m worried about it as I said last week. I said if I were long gold, I’d be hedging downside risk to $1800 with puts (or whatever your preference for hedging is). As more of a trader, I feel like if I have to hedge my position, maybe I shouldn’t be in it any more. But we have asset managers too that have gold and they aren’t moving it because they aren’t thinking in “trader” terms, so that’s why I mention hedging the downside risk.
UNG was up +0.3%.
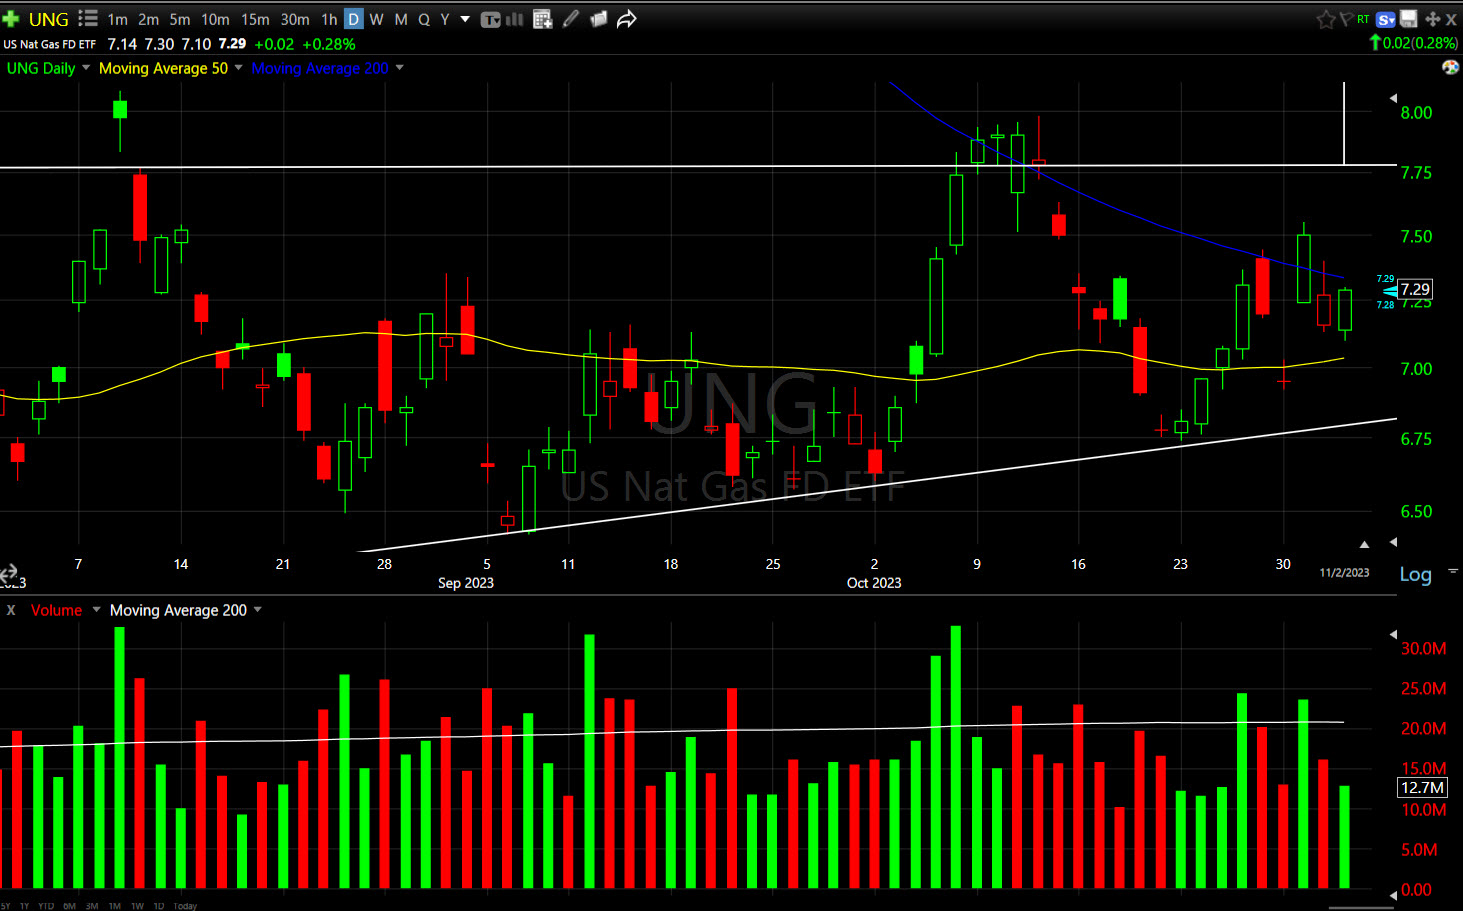 UNG (daily) for the set-up I see here, as a longer term position trade (not a short term or swing trade), it’s acting fine. UNG is pulling back from technical resistance at its blue 200-day, and heading for technical support at its yellow 50-day and it’s pulling back on lighter volume which is exactly what we want to see on a pull back in UNG. Remember that UNG’s short term (like imminent action) 3C charts aren’t anything to write home about, but it’s longer term base (5m) chart is flawless, so we’re just waiting for this one, like cooking a turkey and waiting for that red button to pop up (the short term 3C charts).
URA (+1.25%) does have stronger short term 3C charts, but ….
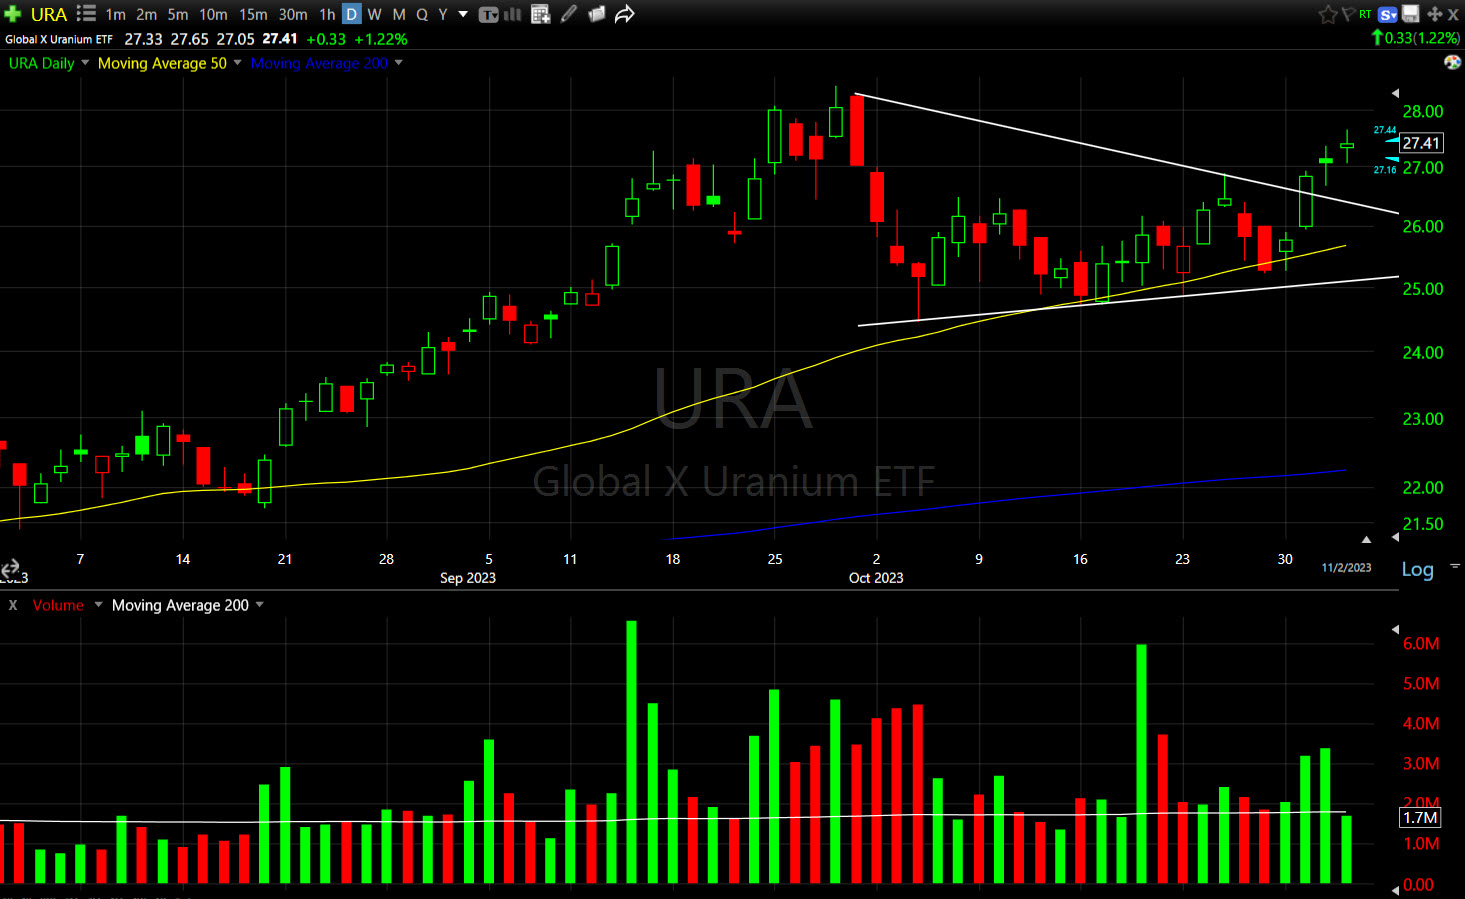 URA (daily) this attempted breakout from the triangle is not happening. The price candles the last 2 days are small bodied candles (no momentum) and it seems like price is starting to feel the résistance of overhead supply from recent highs around $28. Even 3C is suggesting that. notice too that the volume today is lighter on a gain. I think the best thing it could do (beyond a strong day), is consolidate or pull back and try again. If it does, I have a feeling we’ll erase those trend lines and start from scratch as it would likely be forming a larger consolidation than the triangle, but keep an eye on its yellow 50-day too as it has been technically important.
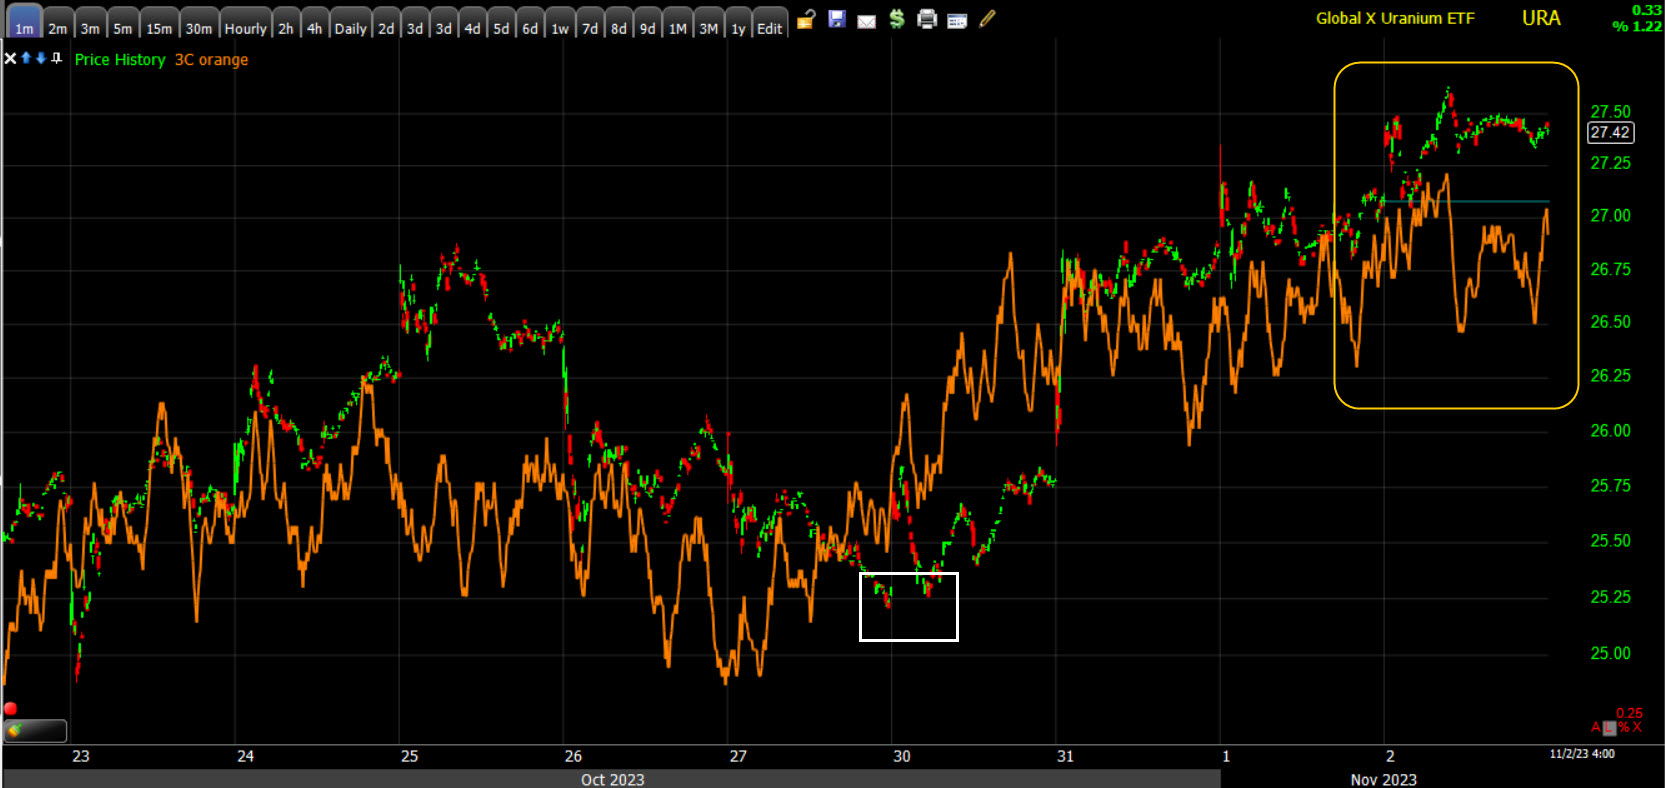 URA (1m) the white area is a positive divgernece off the 50-day. However, note that today’s 3C chart isn’t charging ahead. It’s not horrible ether, but it’s not inspiring me and I suspect we see some more weakness and a pullback or consolidation. do I still like URA? Yes, but again, this is more of a position trade that requires some patience.
Like gold’s attempted breakout above $2000, Bitcoin’s breakout above $35,00 isn’t going so well thus far.
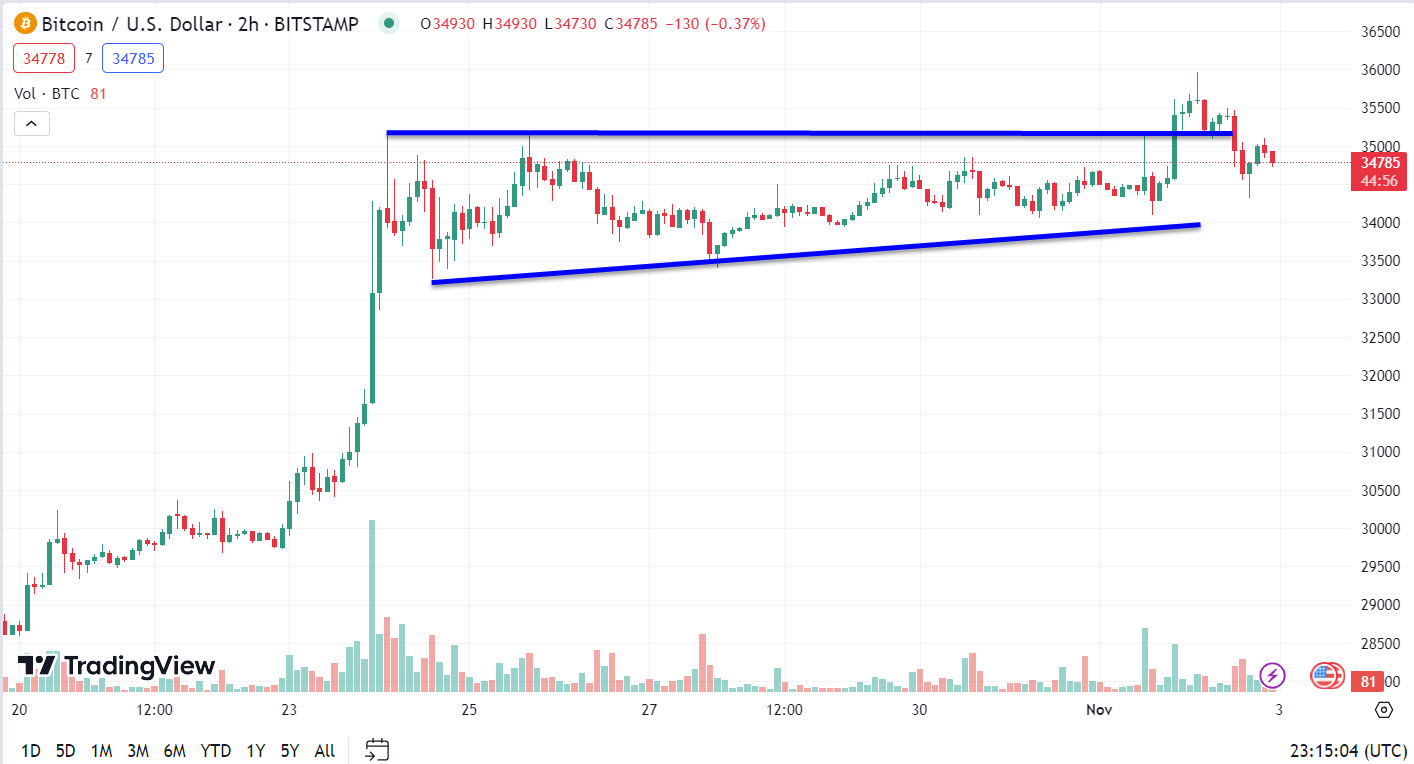 BTC/USD (2H)
Summary
November, on average, has historically been the strongest month for the S&P 500 and marks the start of the best six month return period for the S&P 500. While we may get some consolidation soon after 5-days up in the NASDAQ-100, I’d put my money on the S&P tagging the top of the sub-intermediate down trend.
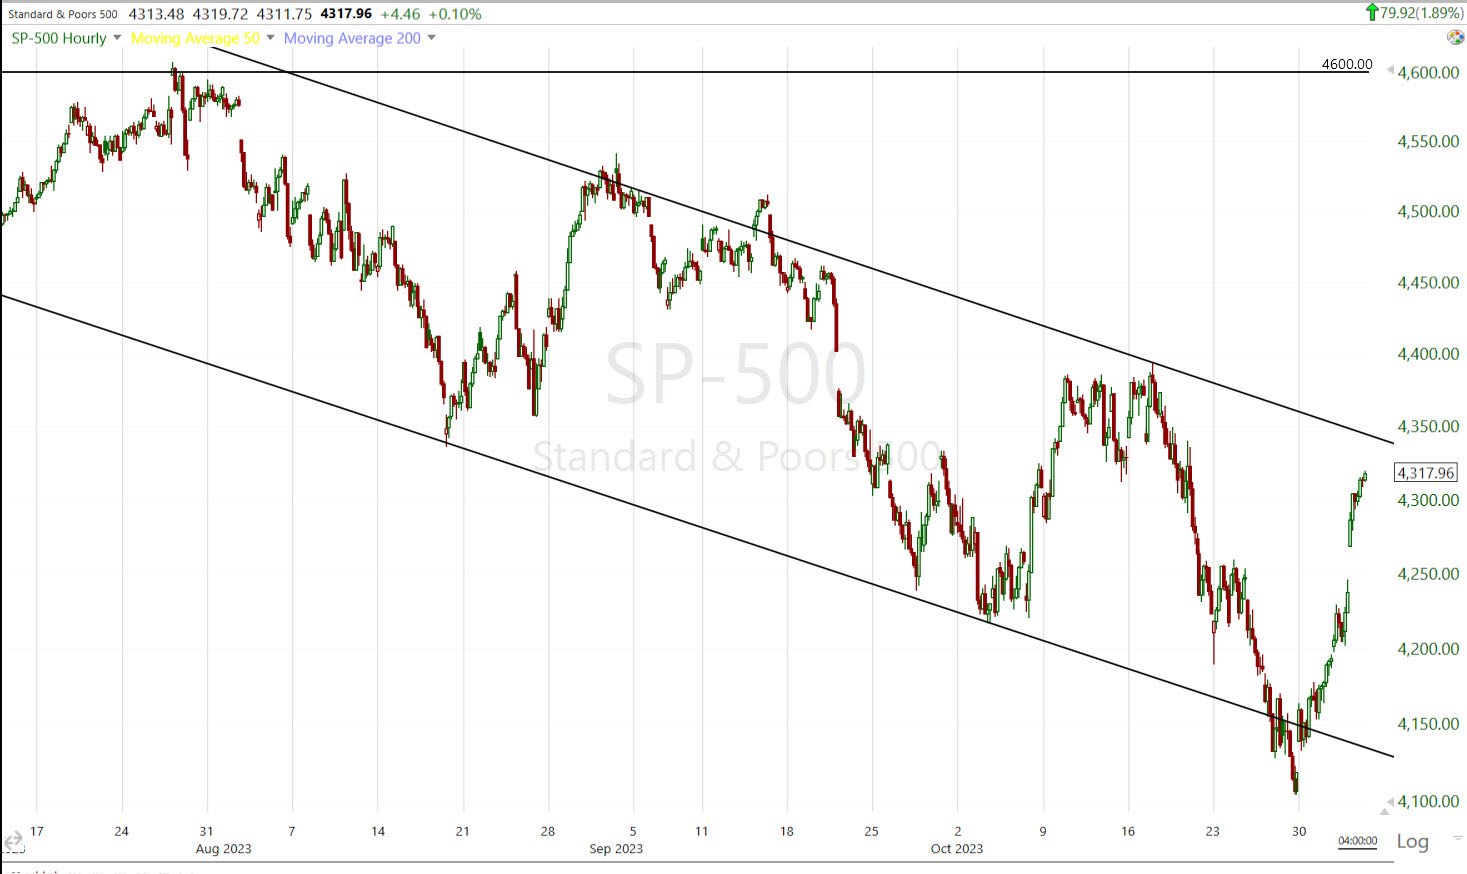 SP-500 (60m) – It’s only about 0.6% away from tagging that trend line.
But also don’t forget that the H&S tops served as a trend change…
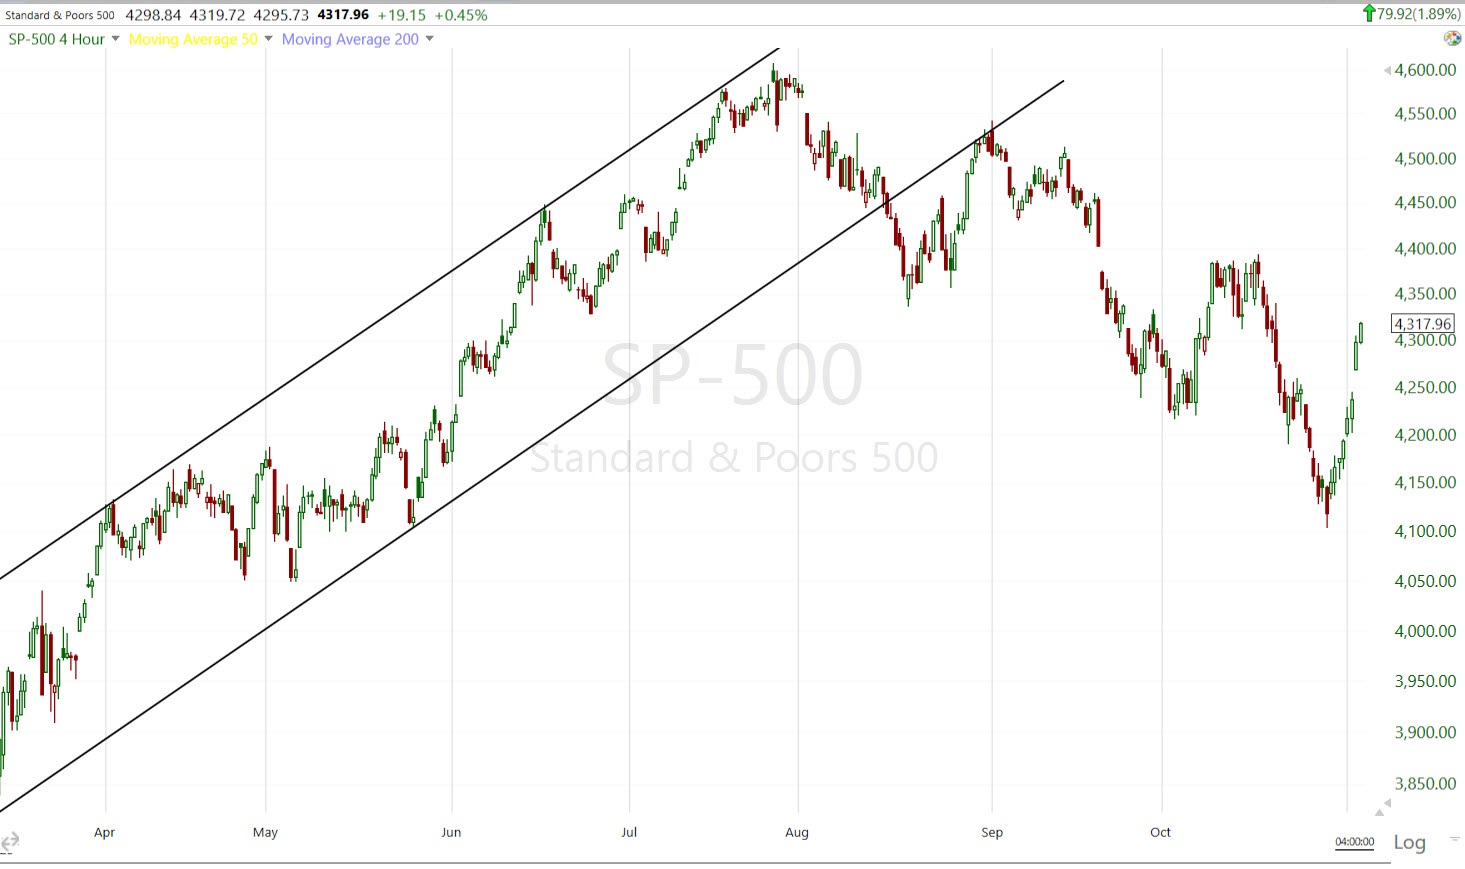 SP-500 (4H)
As I’ve been saying all along, I didn’t and still don’t expect a crash, but the trend is changing from a year-long up trend, to moving toward a larger down trend.
In the near term, as the S&P is so close to the trend line, it’s interesting to see VVIX showing better performance than VIX as VVIX tends to lead VIX’s relative performance as we just saw the last few weeks. And VIX’s relative performance tends to lead the market’s direction. Also HYG’s 3C weakness, considering the players in HYG and considering how well HYG leads the market. Or the real spark for the rally being based on the Fed coming off as very dovish, yet the Fed-sensitive 2-year yield is no longer falling, but actually closed higher today.
These are all market whispers and they’re early in the process, but these are the things we need to be watching as this particular bounce, is probably near a point where it runs out of steam. It’s not an actionable short yet and if prices consolidated, it might even be a fun quick little long trade. If I had on long trades, I’d just manage them, but I’d be watching the market signals to know when it’s time to get out and remember what the market’s trend is.
I suspect we’re going to start hearing hawkish speak from Fed officials as they start talking again out of their media blackout. Why? Because financial conditions have loosened notably the last few days with stocks higher and yields lower. Powell was praising the fact the market was tightening financial conditions so the Fed didn’t have to do it. They’re not going to like this response and they are going to push back.
Tomorrow’s Payrolls report before the open can be VERY influential. It’s one of the most important data points of the month.
Overnight
S&P futures are down -0.1% and NASDAQ -0.25% after Apple reported earnings. I show Apple down -1.4%in after hours after their revenues dropped for the 4th consecutive quarter and GUIDANCE was weaker than expected.
The U.S. Dollar Index is up +0.05%.
The 2-year yield is up +2 bp (this is the one to watch as it is diverging) and the 10-year yield is down+1 bp.
Crude Oil is up just +0.05%.
Gold futures are down -0.05%
Bitcoin are down -1.45%
Tomorrow:
- 8:30 ET: October Nonfarm Payrolls (consensus 175K; prior 336K), Nonfarm Private Payrolls (consensus 143K; prior 263K), Average Hourly Earnings (consensus 0.3%; prior 0.2%), Unemployment Rate (consensus 3.8%; prior 3.8%), Average Workweek (consensus 34.3; prior 34.4)
- 9:45 ET: Final October S&P Global US Services PMI (prior 50.1)
- 10:00 ET: October ISM Non-Manufacturing Index (prior 53.6%)