*This is an example of one of several Subscriber posts that member’s receive every day (from Wolf on Wall Street-Trade). If you‘re interested in becoming a subscriber, you can still subscribe at 2008 rates at www.WolfonWallStreet-Trade.com , under the “Membership” tab. As long as you are a current member of WOWS when the Technical Take goes live, you’ll be grandfathered in at the 2008 rate so long as your subscription remains active. In the meantime, enjoy this free example of what subscribers receive every trading day of the week.
Wednesday, August 8th, 2024 (3:54 p.m. ET)
The minutes for the July 30-31 FOMC meeting are stale considering all that’s happened in just 3 weeks (market and economic data), and because there’s something fresh coming Friday with Powell at J-Hole.
The FOMC Minutes from the July 30/31 meeting are out this afternoon and I don’t think there are any shocks. Some of the key takeaways include:
- The minutes showed that financial conditions eased modestly over the intermeeting period, reflecting lower long-term interest rates and higher equity prices.
- The minutes also noted that the vast majority of participants observed that, if the data continued to come in about as expected, it would likely be appropriate to ease policy at the next meeting. The market has had this priced in at a 100% probability for over a month now.
- All participants supported maintaining the target range for the federal funds rate at 5.25 to 5.50 percent, although several observed that the recent progress on inflation and increases in the unemployment rate had provided a plausible case for reducing the target range 25 basis points at this meeting or that they could have supported such a decision.
- A majority of participants remarked that the risks to the employment goal had increased, and many participants noted that the risks to the inflation goal had decreased. Some participants noted the risk that a further gradual easing in labor market conditions could transition to a more serious deterioration. Many participants noted that reducing policy restraint too late or too little could risk unduly weakening economic activity or employment.
The market reaction? There pretty much wasn’t one, although the Dollar’s decline and the 2-yr yields’ decline since the Payrolls revision is sending a pretty clear message that economic growth isn’t even on the table. The concern is that the economy is worse than previously thought and maybe the Fed is behind the curve, although the Fed was aware of the true nature of Payrolls from the Philly Fed’s QCEW analysis well before we were.
The price action in the major averages is more loss of momentum from the oversold rebound. Small Caps have a decent gain of about 1%, but haven’t made any additional forward progress in filling the gap as price is still below Monday’s close. Dow Transports have a decent gain, but are stuck at the same area where they’ve tied to break out of a range 3 times in a week and haven’t made any additional progress.
Both VIX and VVIX are displaying increased relative strength as the averages lose upside momentum.
Gold looks to be entering a bullish consolidation after yesterday’s price action suggested it was likely. We’re less than 48 hours into it, but so far it’s starting to take on the shape of a bull flag.
USD/JPY is below the week’s low and trading below $145. As the averages lose upside momentum, this becomes an increasing downside risk.
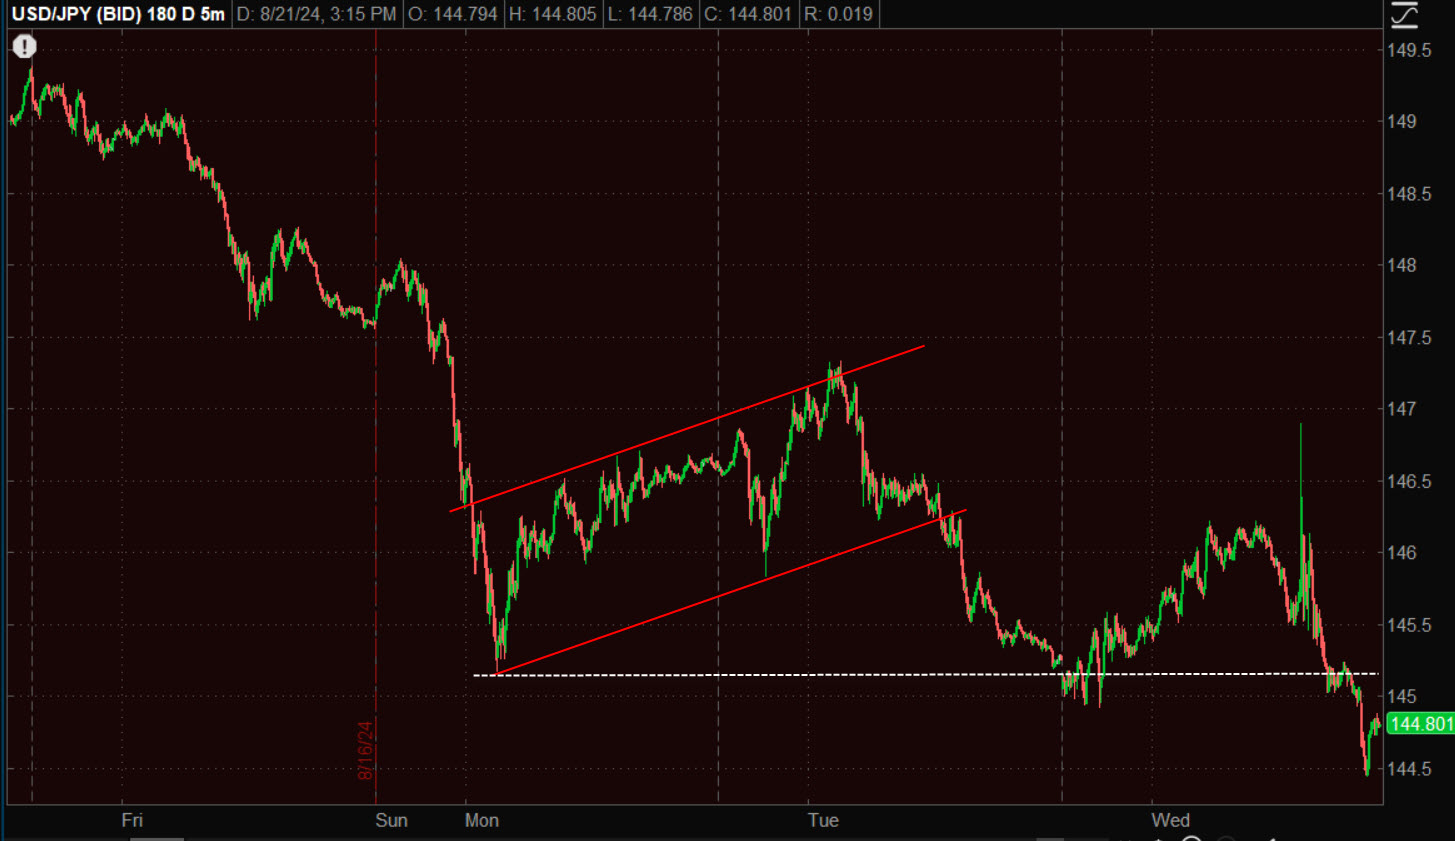 (5m)
(5m)
From a broader perspective off the 8/5 low (it was the halt of the Dollar-Yen decline that allowed the averages to rally off the 8/5 low)…
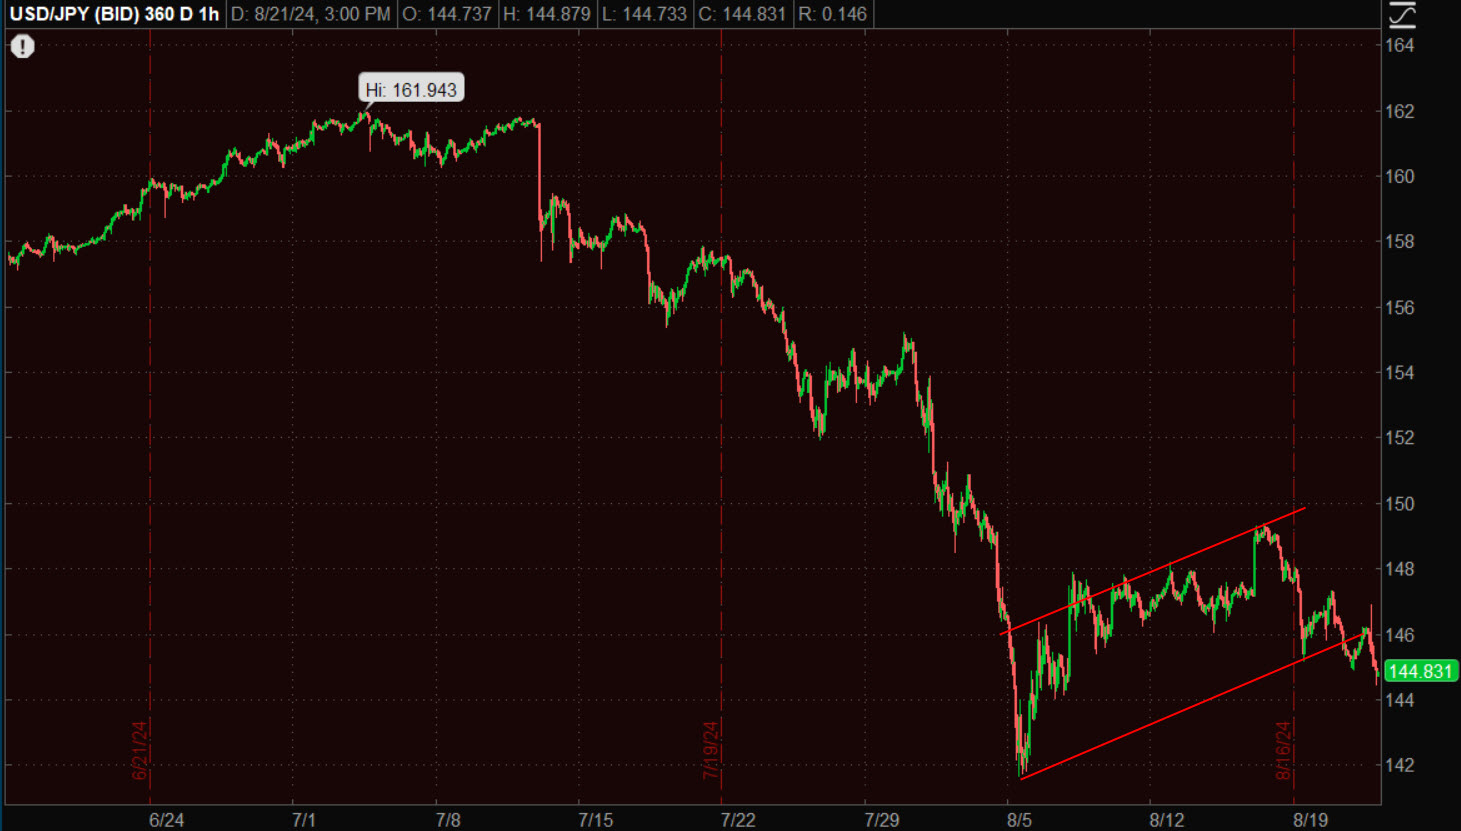 (60m)- We have something like a textbook sized bear flag (3 weeks is the average flag’s size) that’s just starting to break down. True enough that it’s being driven more by Dollar weakness than Yen strength, but that doesn’t matter much.
That leaves all of the averages exposed, but more so the SPX and NDX…
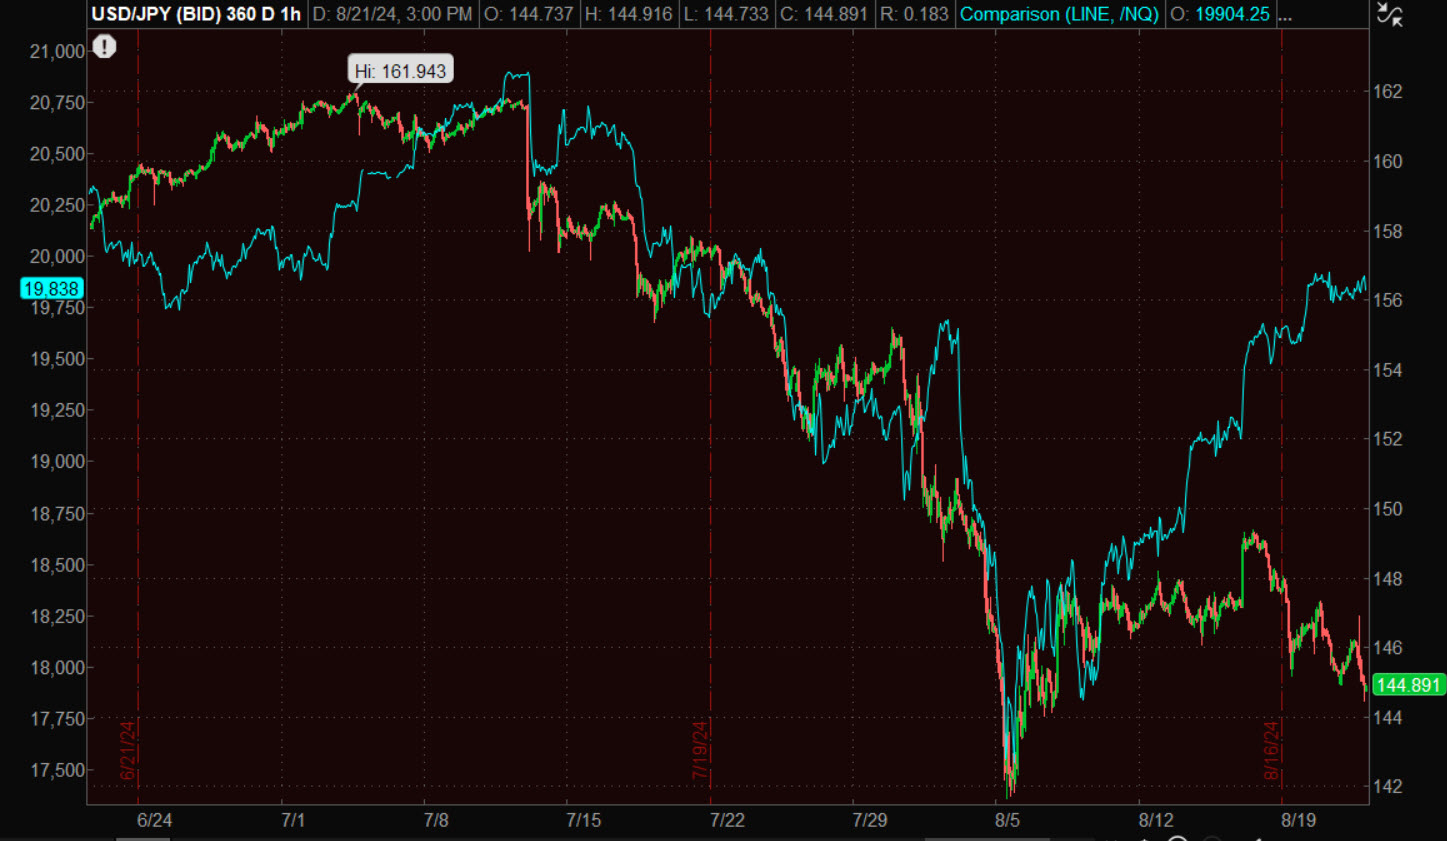 (60m) vs. Nasdaq-100 futures, S&P is just as exposed.
Volatility may be sniffing this out. However, my guess is that the equity market isn’t going to do much until it hears from Powell on Friday. Maybe he’ll hint at a 50 bp cut and the market will rejoice? At least that’s going to be the thinking until then. Jacksons Hole is the Fed’s last big chance to set market expectations for the September FOMC.
Market-based measures are discounting a 38.5% chance of a 50 bp cut in September, up from 29% yesterday, but still down from 55% which I believe was what we saw at one point last week.
On the very short-term of 3C charts, we saw some buy the dip activity yesterday. Nothing much has changed on those charts today.
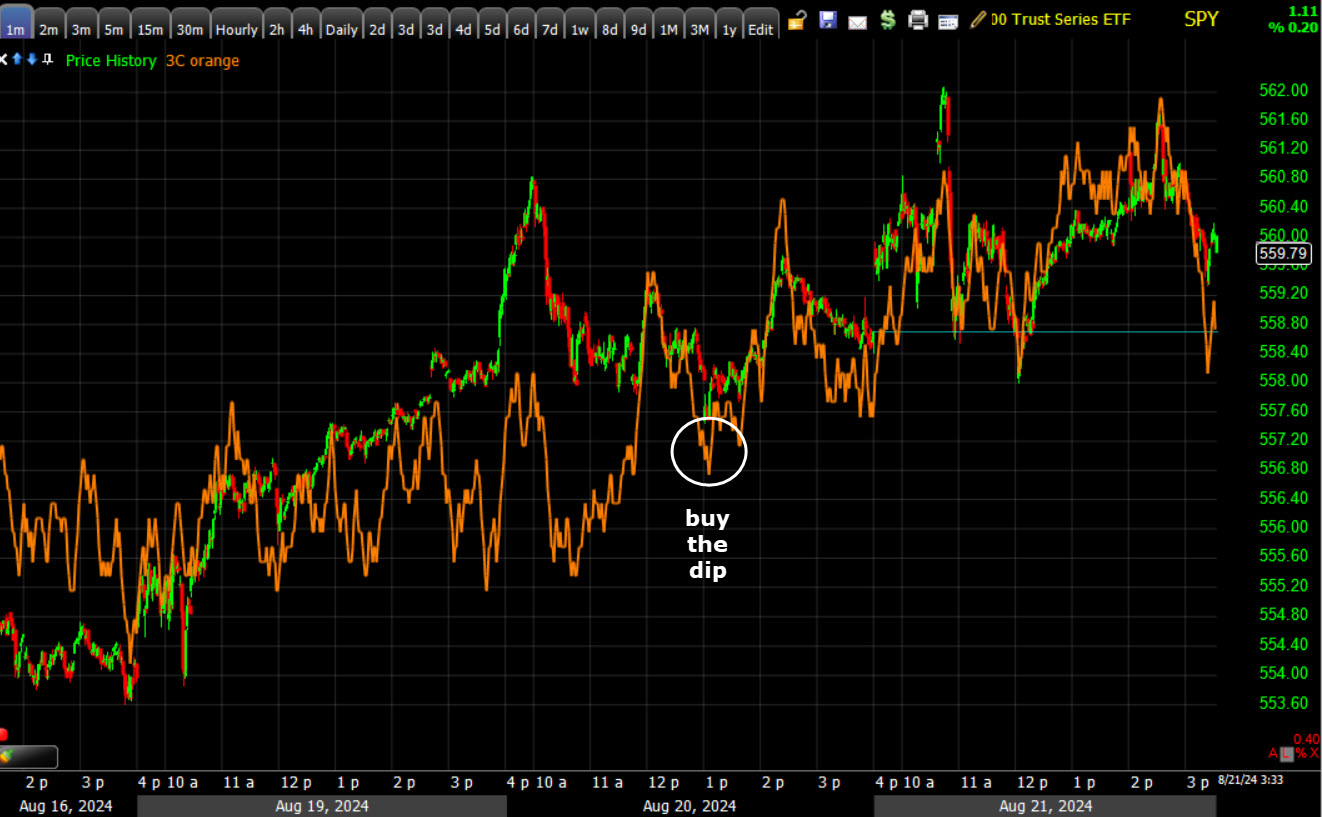 SPY (1m)
While we had some brave souls buying the 8/5 low, the majority didn’t have enough confidence in that low until the SPX moved above $5450 – “The chasers”, with CTA’s, and buybacks also in the fray.
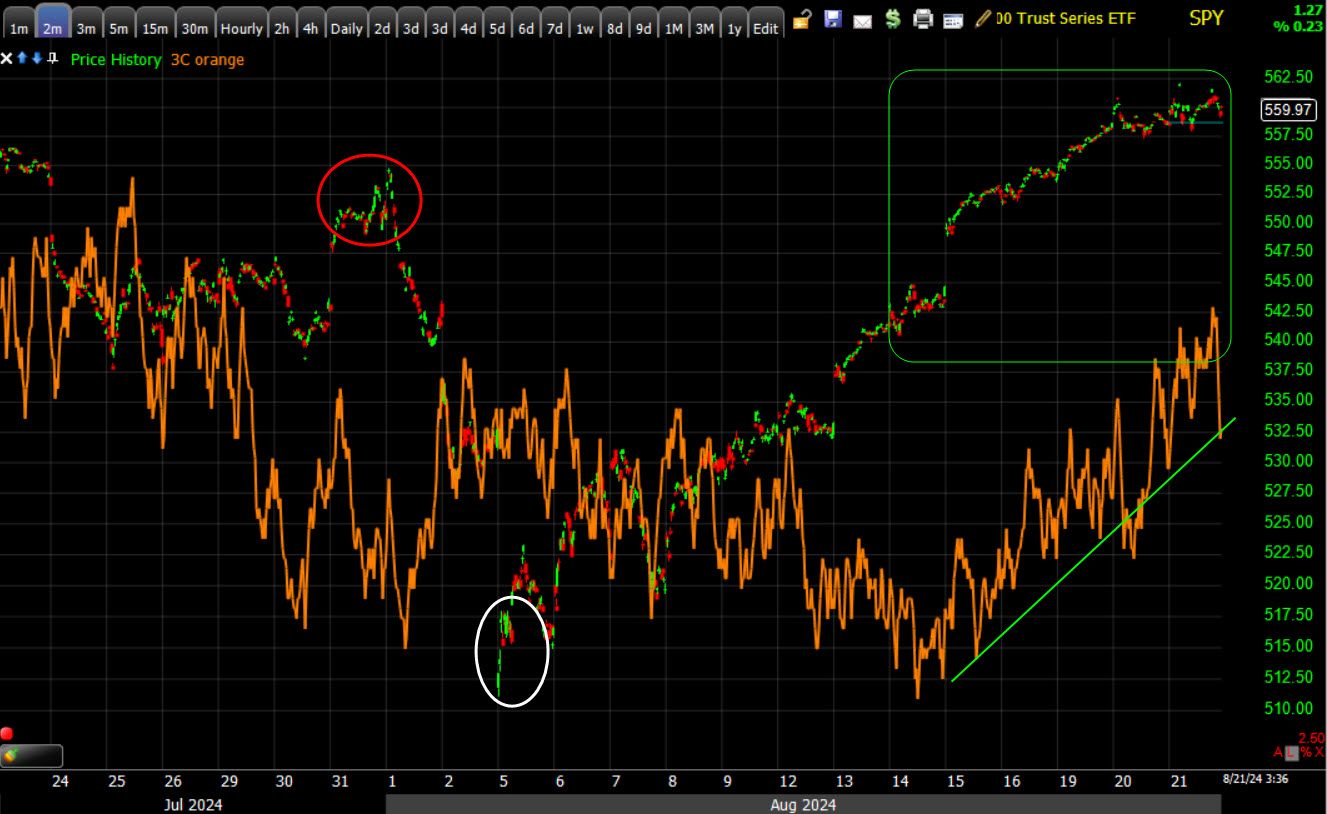
SPY (2m)
However, Nasdaq-100/QQQ looks worse ever since it came up to its 50-day SMA…
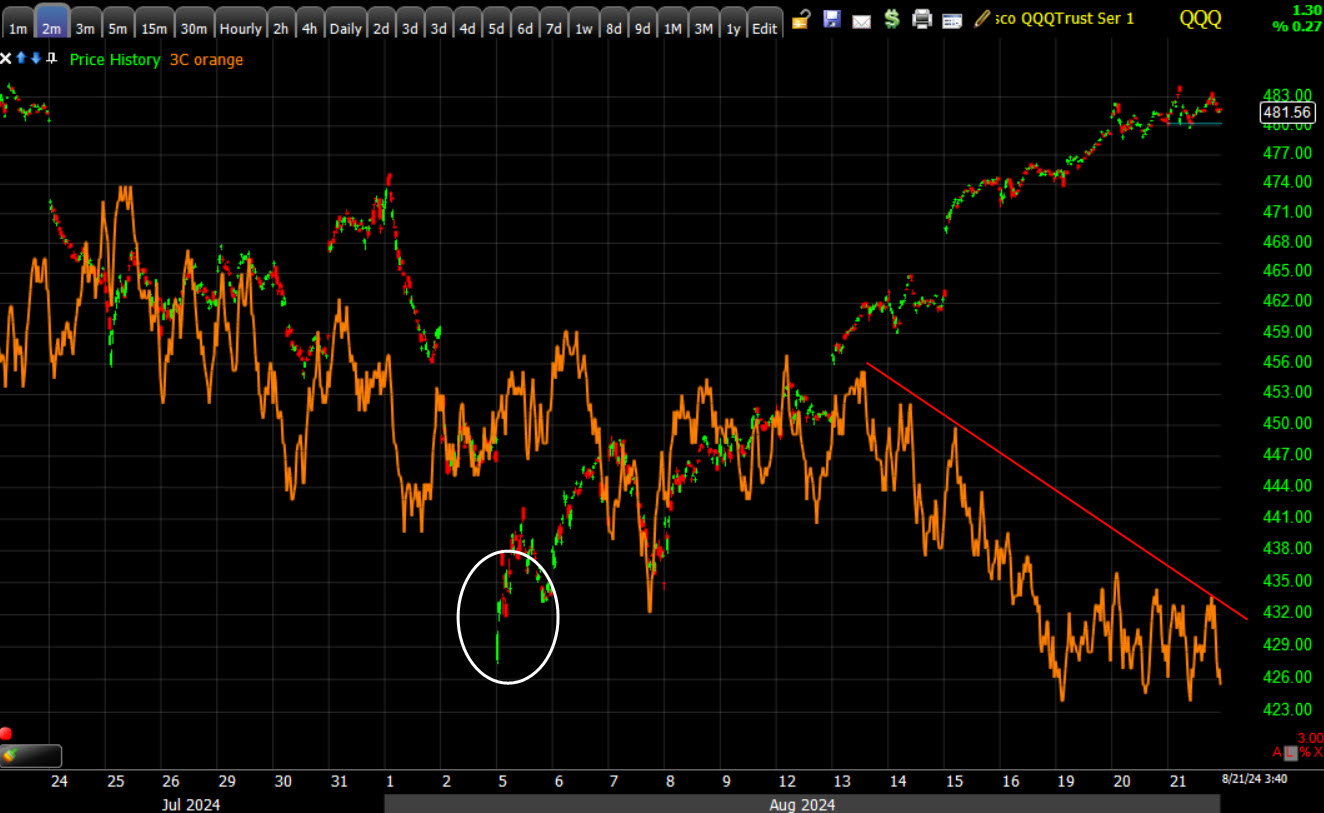 QQQ (2m) – This is the same timeframe as SPY above, but a very different character. I think this is also reflected in my Equal Weight Index of Mag-7 stocks I highlighted this morning.
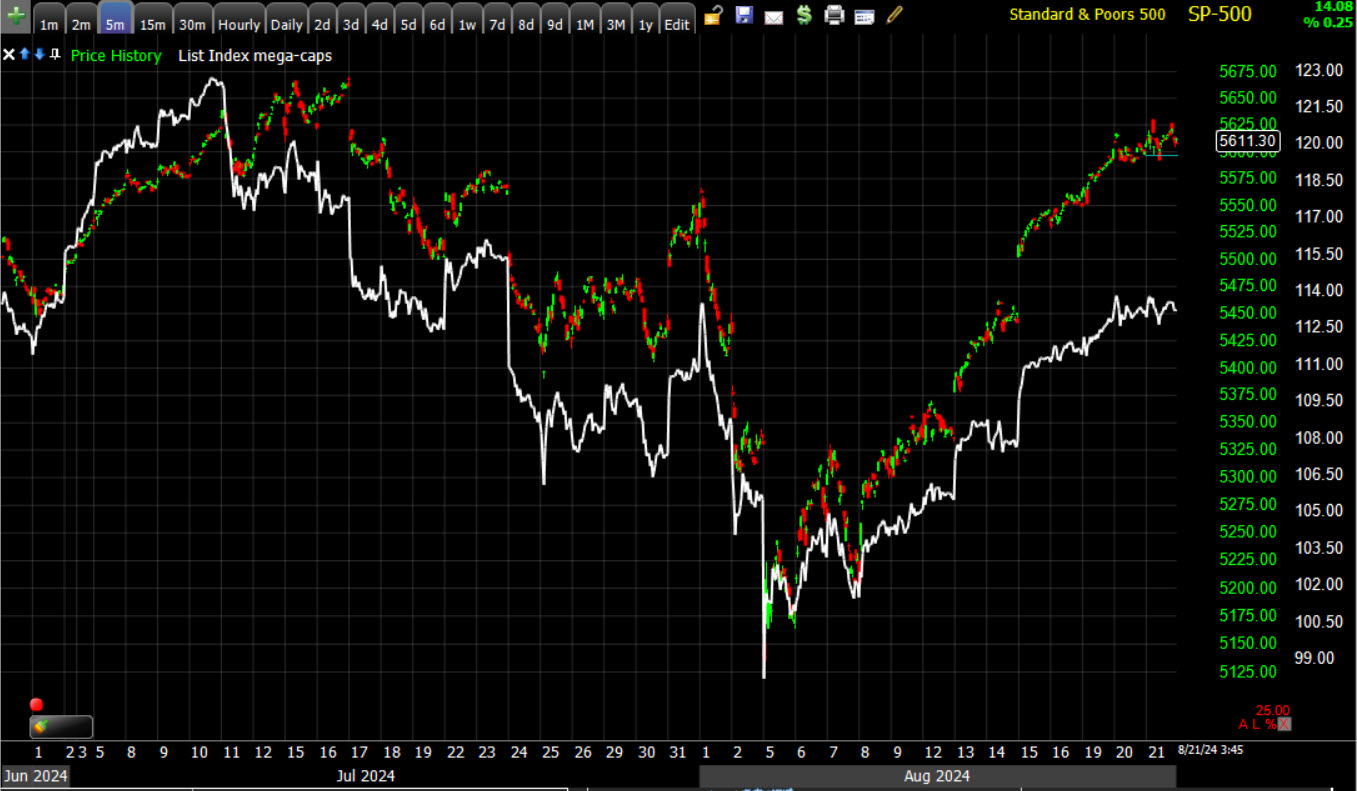
SPX and MAg-7 (5m) The S&P is doing a whole lot better than the MAg-7 stocks on a relative basis. Defensive sector stocks are doing even better on a relative basis, but they’re not going to hold the market up if Mag – 7 stocks fall. That’s more of a mental note of where we are in the market’s cycle. Defensive sectors get bid up late in the cycle, then everything comes down together when the bottom falls out – just as, “A Rising Tide Lifts All Boats”.
NASDAQ looks more vulnerable to me on the 3C charts, but I’m going to have to take a closer look at risk/reward between SPX and NDX.
From what I see now on the DJIA’s 3C chart, I don’t think it’s going to make that higher high, but more likely a lower high.
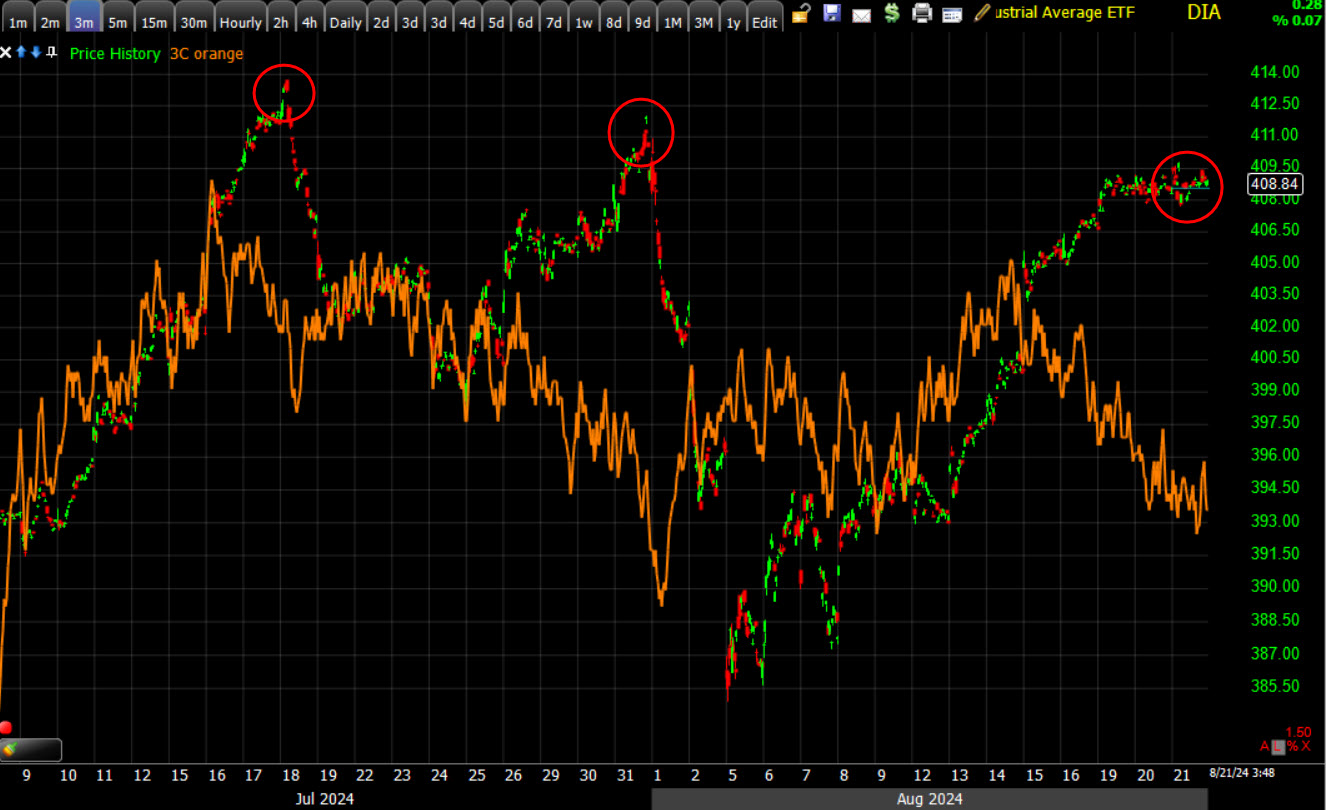 DIA (3m) 3C looks the same as the last two pivot highs… negatively divergent.
We still have seasonals to contend with which are favorable, which is why it’s important to watch the Dollar-Yen as that could very well trump seasonals with a new low. I’d say it’s even more likely than “could”.
As far as the strength of the underlying trend of money flow, there’s nothing to talk about. It’s not even close, but we don’t need 3C to see this, we can just look at the price/volume trends on advances and declines. They stand out like a sore thumb,
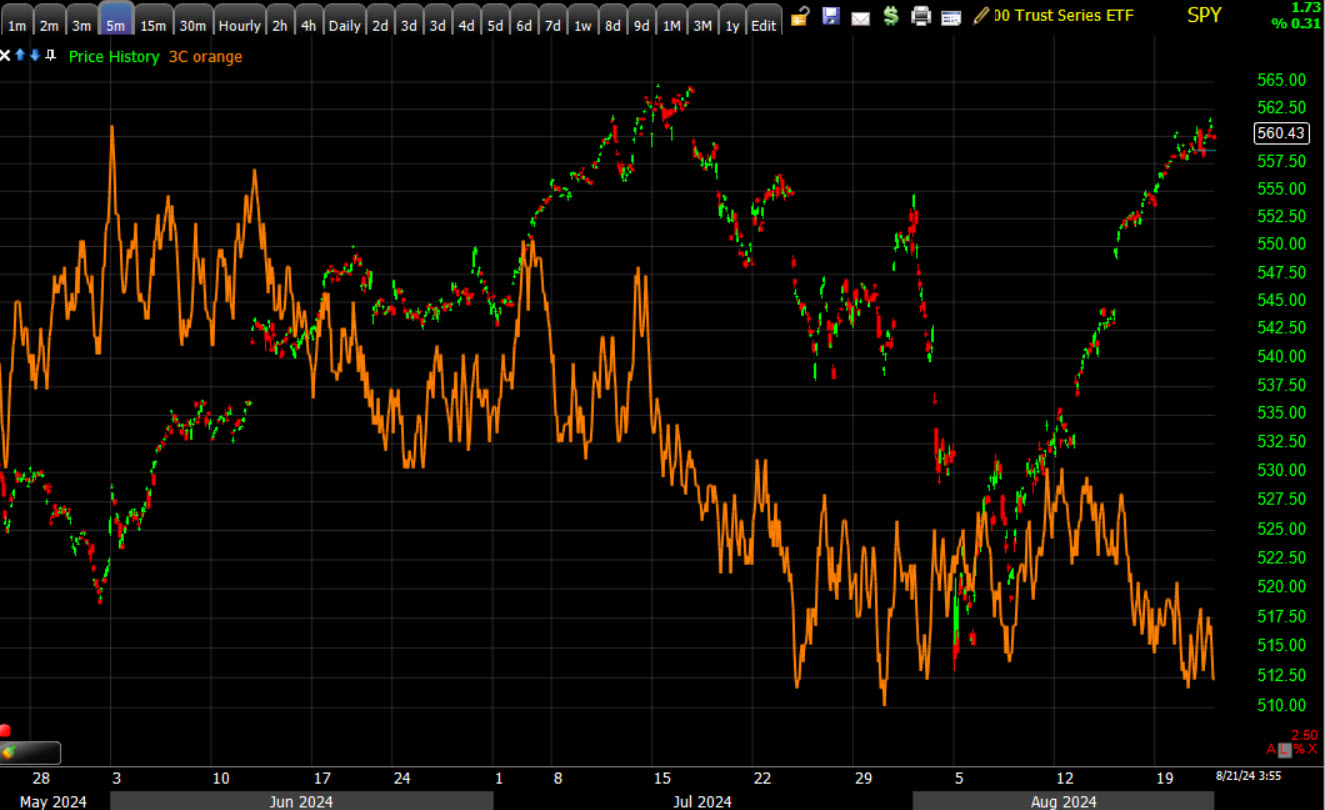
SPY (5m)
I think probabilities are pretty well established. The key question is the timing factor. What lights the fuse? Dollar-Yen? Volatility’s increasing relative strength and maybe a signal there?