The stock market had a mixed showing . Today was a complete flip-flop of yesterday’s dynamics when just about everything, except Tech stocks, took yesterday’s CPI report hawkishly. Yesterday wasn’t so much about the conditions (CPI) being right for Tech to rally (in fact wrong), it was more of a relief rally, in Tech that had been sold leading up to CPI. It was relief that CPI wasn’t as bad as feared. Fear among investors is not necessarily the same thing as methodical compilation of estimates to form consensus expectations.
On the flip-flop, here are a few examples:
- Yesterday Tech led with semis performing in-line with the Tech sector. Cyclical Materials and Energy were red. Growth outperformed Value by 150 basis points. Mega-caps outperformed the Equal Weight S&P by 150 basis points.
- Today Tech underperformed, and semis underperformed Tech by -140 basis points. Cyclical Materials and Energy finished at the to of the leaderboard. Growth underperformed Value by 60 basis points. Mega-caps underperformed the Equal Weight S&P by 50 basis points.
Today isn’t a fluke, it’s part of an emerging trend hinting at the breakdown of the most important parts of 2024’s market leadership – the Semiconductors. I hope this isn’t beating a dead horse, but I believe context is crucial when assessing the markets.
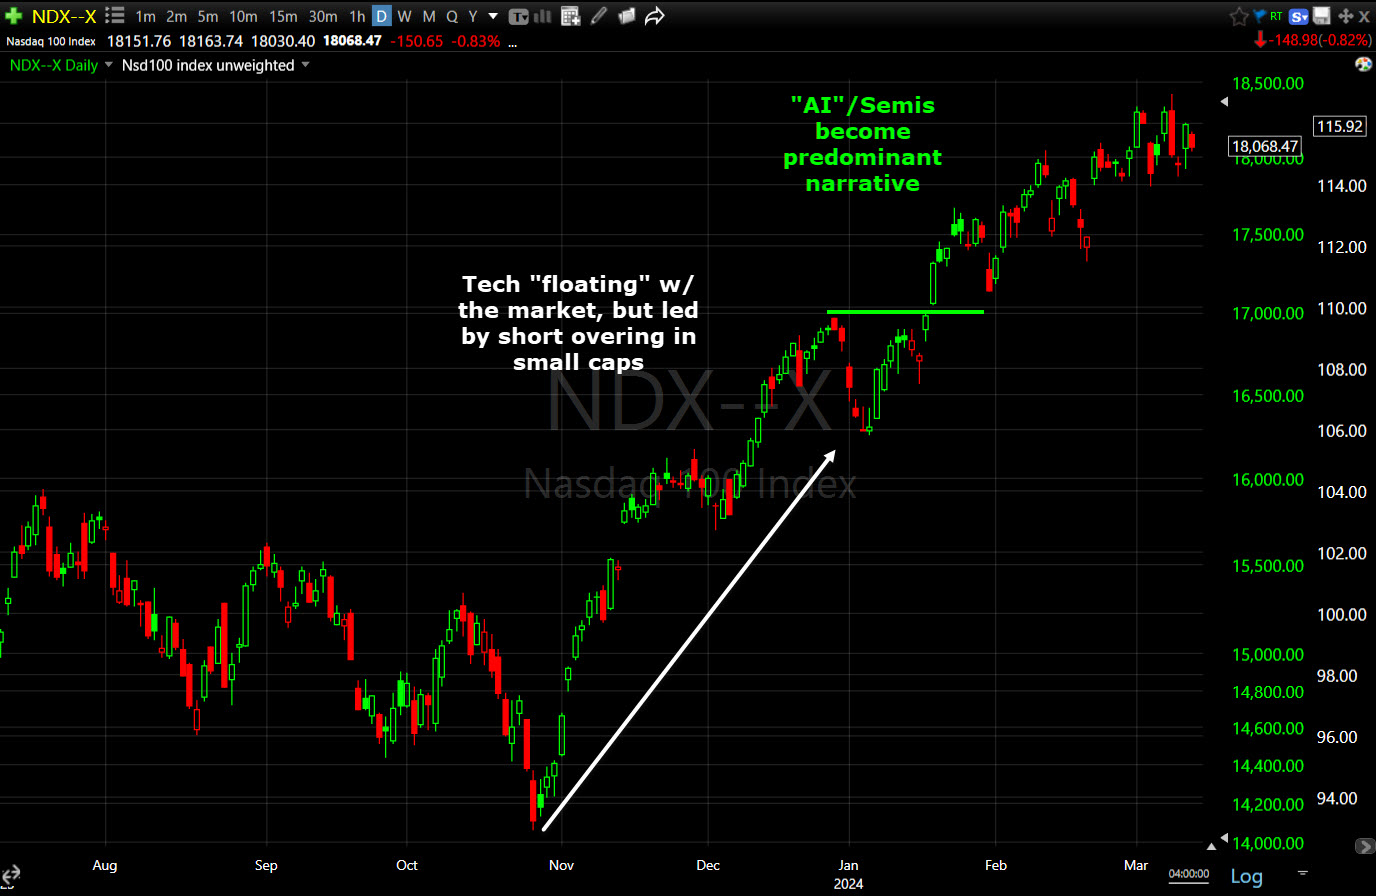 NSDAQ-100’s (daily) rally off Oct. ’23 low. NASDAQ initially floated with the market in November and December –– A Rising Tide Lifts All Boats — but Tech/NDX wasn’t outperforming. In fact the main takeaway at this stage was that the 2023 mega-cap leadership was notably absent from the rally. Tech was responsible for the worst first week start of a year in more than 2 decades as January began, but after defensive/cyclical sectors failed to rotate in, Tech, mega-caps and Semis took the lead in January. While the “AI” narrative was there long before, it became the dominant bull narrative in January and ever since.
Here’s the evidence for the Semi and “AI” narrative exploding to the forefront in January…
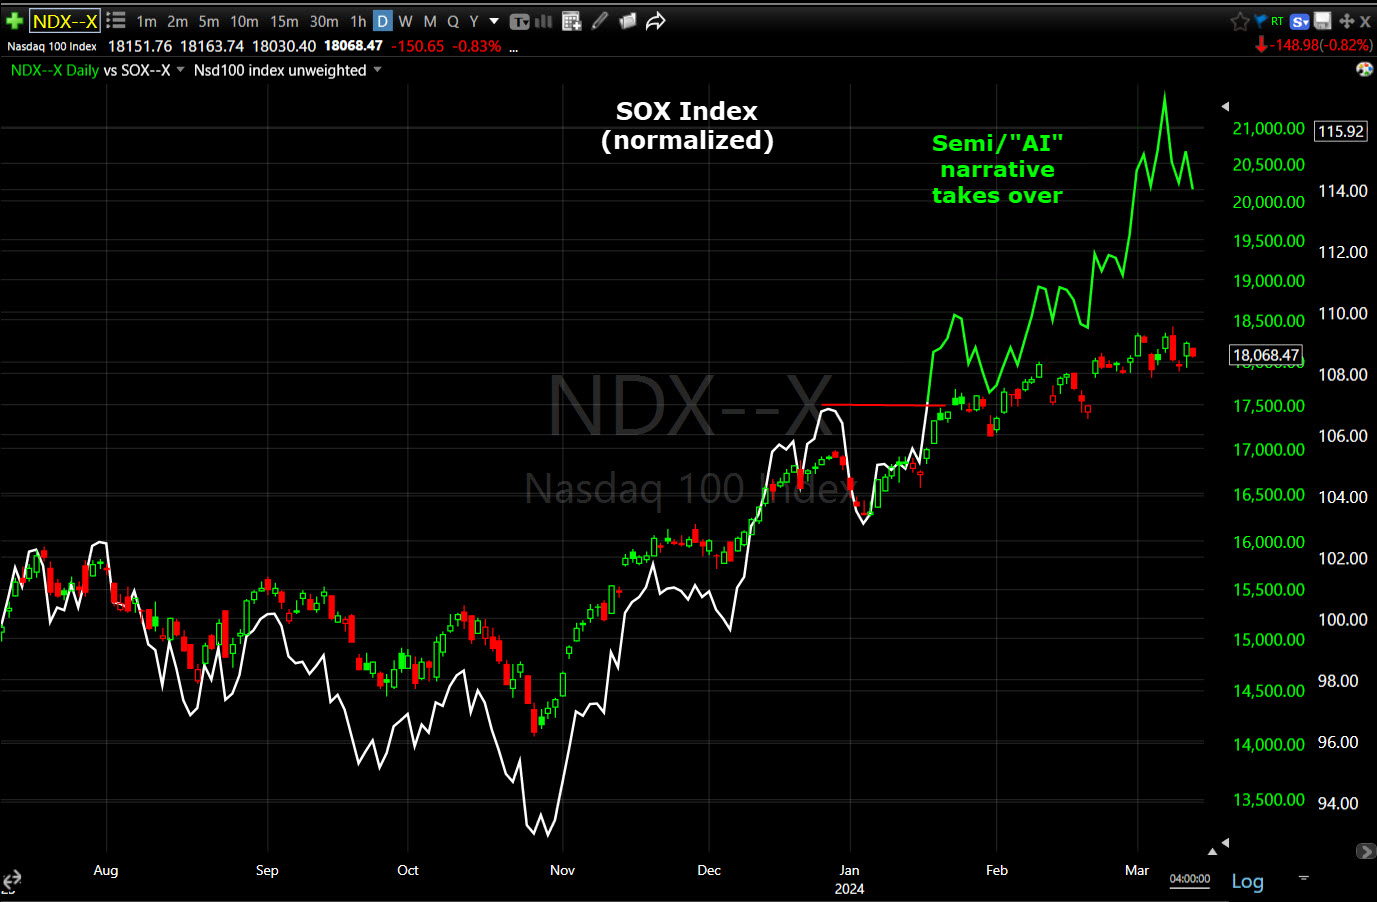 NDX/SOX (daily) this chart is normalized. We can see semis performing weaker coming into the end of the 3 month down trend (end of Oct), then more or less performing with the NASDAQ in November/December, but exploding in 2024. That makes this next set of figures important with regard to the market’s leadership…
- Week-to date Semis are lagging the Tech sector by an impressive 250 basis points over just 3 days in. Tech is up +0.65% week-to-date; while cyclical Materials is up +2.1% and Energy +2.5% week-to-date. That’s not exactly the stuff of the 2024 leadership. The day-to-day swings and drastic changes are the price volatility I’ve been warning to expect — the “bumpy ride”. CPI is another issue entirely from a macro and sector investing standpoint. Higher inflation/rates is not helpful for the leadership stocks, and in fact not helpful for most stocks. Otherwise, we already observed leadership cracking prior to this week, and on “fertile ground” to do so before the CPI report.
The way the overall market and S&P sectors are acting this week is much more in-line with how I’d expect on a bump in inflation and keeping the Fed “Higher for longer”. We’re seeing more interest in Value stocks. The cyclicals that have exposure to inflationary commodity prices, like Materials and Energy are acting like that’s the case (which it is). Copper’s surge today was just another signpost along the way of tougher times ahead for sticky inflation and leadership stocks. While we can go long commodities and materials, the related sectors are among the most lightly weighted at the index level. Absent massive short squeezes like November, they simply don’t have the weight to move the major averages. They certainly don’t have the weight to offset selling in heavily weighted mega-caps and semis.
More broadly describing today: Bitcoin, Gold, Oil and Copper soared, while stocks languished. That smells a little like an inflationary impulse.
Averages
Small Caps had the edge today and NASDAQ-100 lagged behind – the opposite of yesterday. There was a brief short squeeze lifting small caps at the open, but it faded fast and wasn’t notable in size. Dow Transports (-0.4%) underperformed the DJIA. Boeing (-1%) was among the worst performing Dow stocks. This is just a nightmare stock to own right now. It seems there’s no end to the bad news, and how badly production has been run.
The real story here is NASDAQ’s weakness and the flip-flop (price volatility picking p in a more 2-way market) from yesterday. This is exactly what I was talking about last night in the Summary section when I wrote,
” I’d try to stay as calm and patient as you can. It’s easy to get caught up in the moment when markets like NASDAQ-100 fall -3% in just over a day as we saw last week, or to get caught up in feeling left behind on days when the market is up like today. I think you’re going to see a lot more of both in a much more sideways market. “
S&P-500 ⇩ -0.19 %
NASDAQ ⇩ -0.83 %
DOW JONES ⇧ 0.10 %
RUSSELL 2000 ⇧ 0.30 %
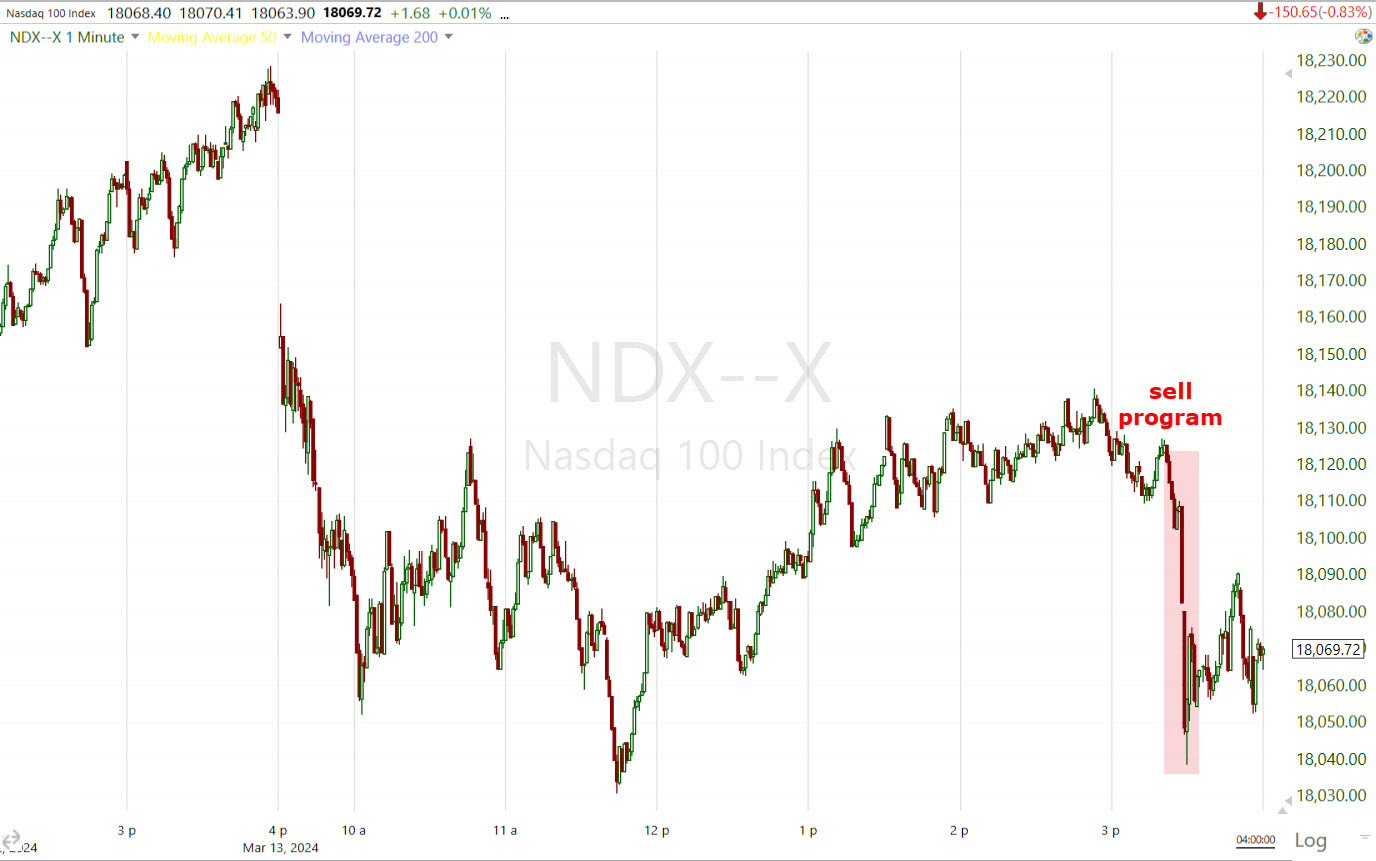
Around 3:30 p.m. a sell-program hit, sending the TICK Index deeply negative by the most in 3 week. My guess is that this is nervousness ahead of tomorrow’s PPI and Retail sales.
 NDX (1m) – Interestingly, NASDAQ-100’s Advance/Decline line started to dump just before this sell program hit.
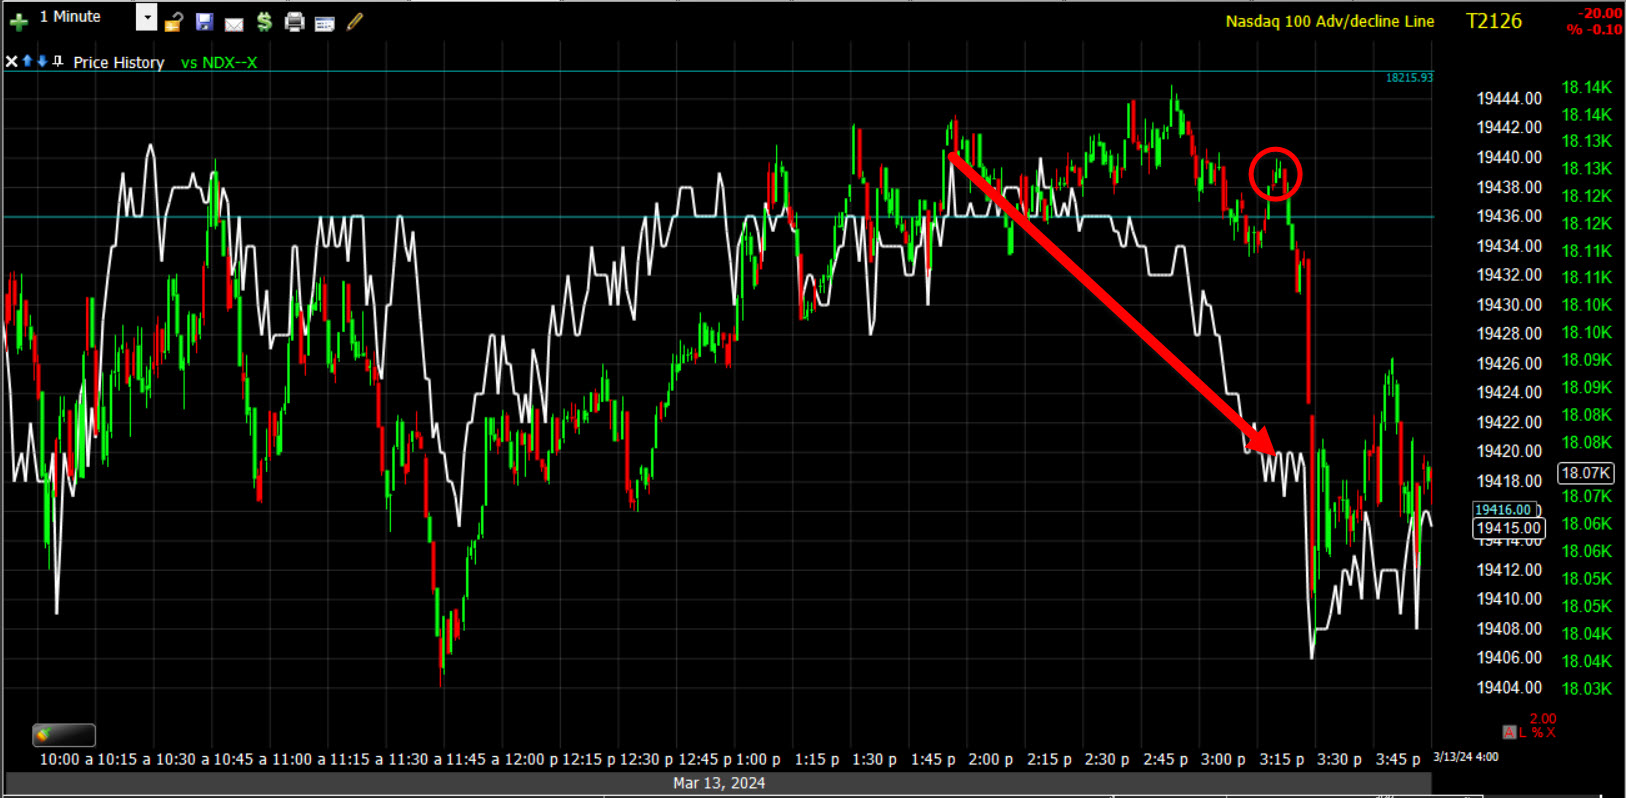 NDX and its A/D line (1m intraday this afternoon) – It’s almost as if someone knew… Well, you fill in the blanks.
Shorts covered at the open, then stopped.
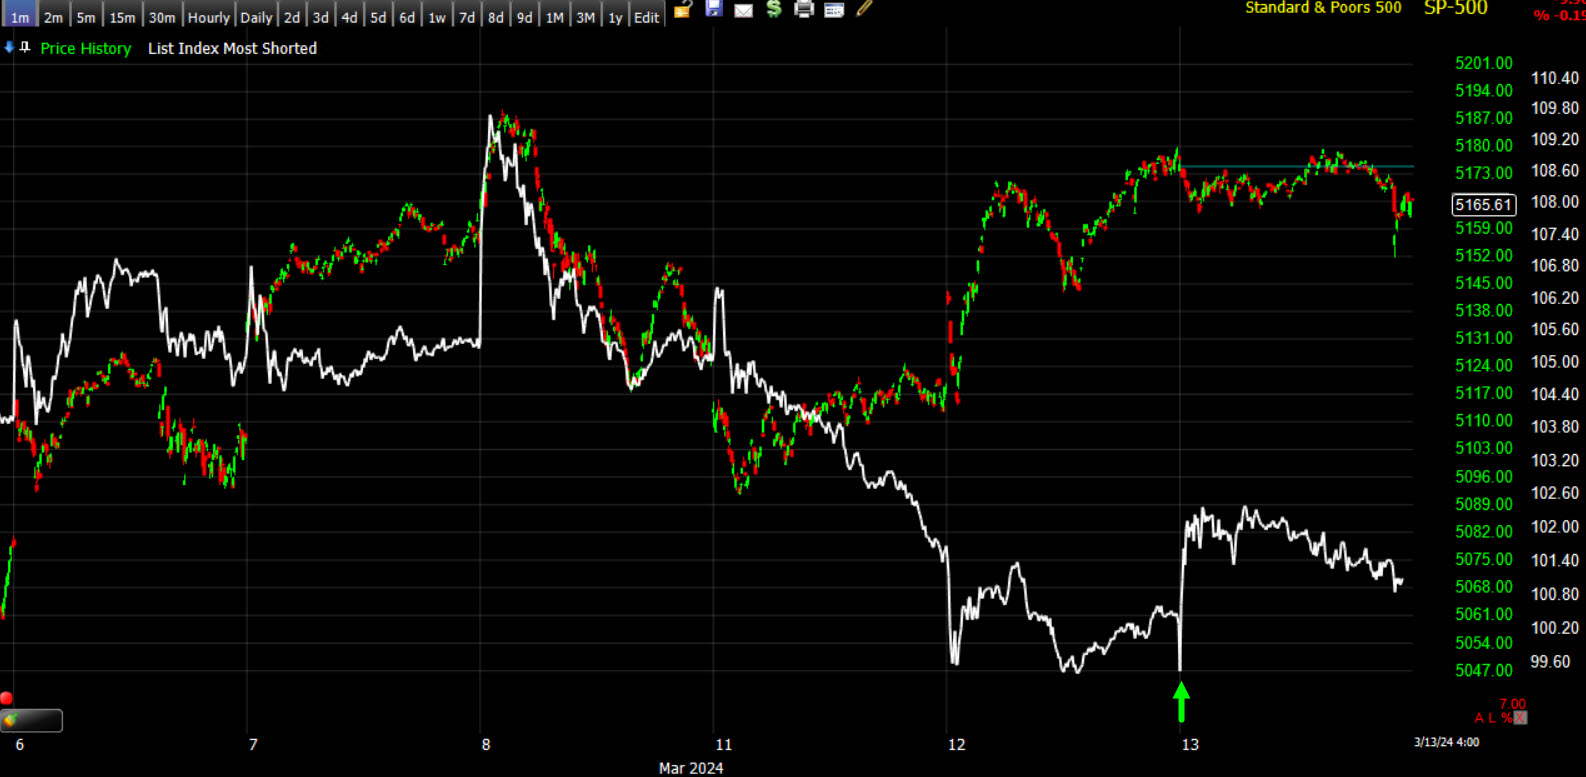 (1m) Thus far the shorts “seem” to have more conviction than the last several months. Their positions are still rather small and newer, but they seem less flappable.
VIX (-0.65%) was on the weak side today and I don’t know why, but VVIX (vol of vol) tends to lead changes in VIX and it was stronger (+3%).
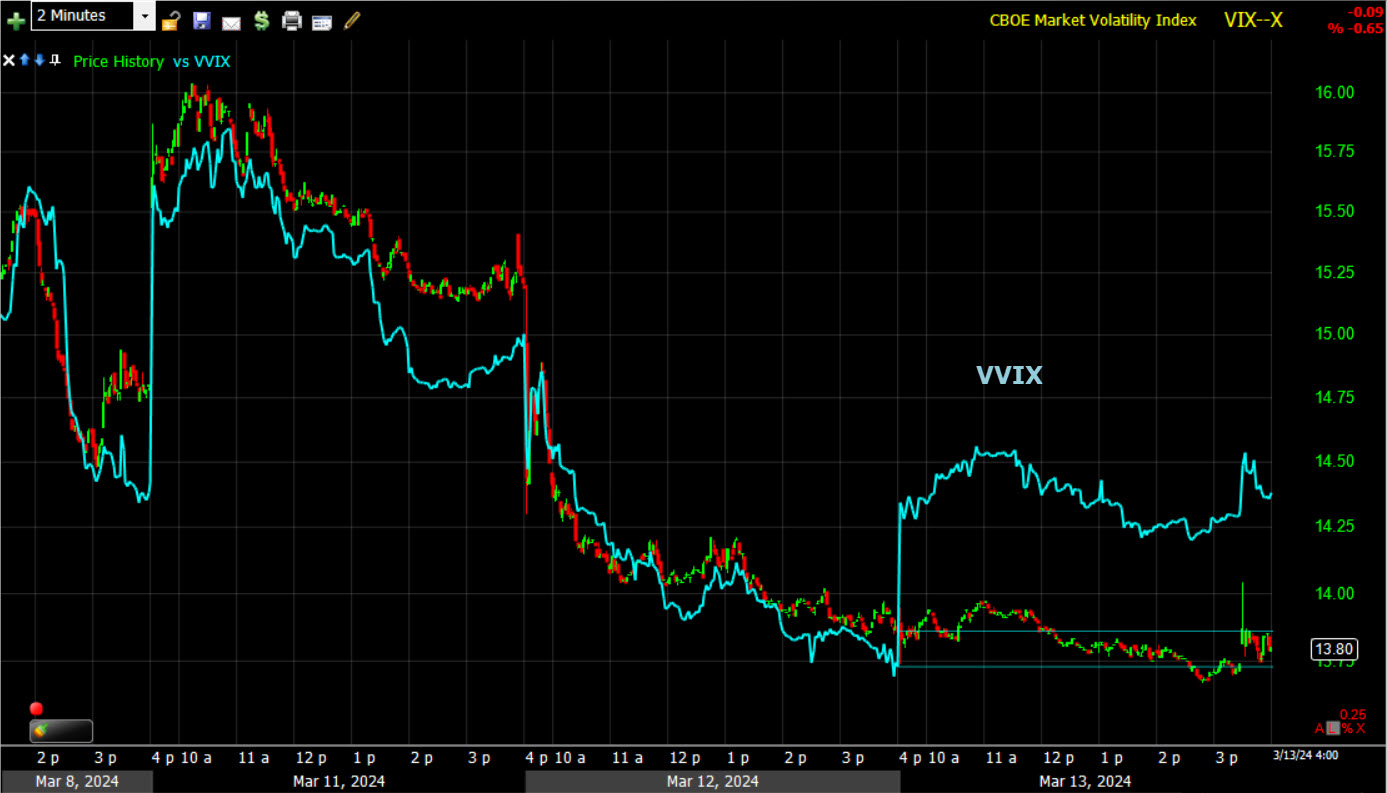 VIX and VVIX (2m) relative performance. When the market was more 2-way last summer, we use to see VVIX lead VIX like this all the time and thus lead the market. VVIX is expecting some volatility tomorrow, which is obviously the unknown risks of PPI and Retail Sales.
The big insight is VIX’s highly unusual and long-lasting relative strength trend and positive correlation that is very much intact.
The ABI was higher at 22 today.
S&P sectors
7 of 11 sectors closed higher, led by cyclical sectors and defensive Utilities. Materials and Energy were toward the bottom of the leaderboard yesterday along with Utilities, while Technology was at the top. Today is the exact opposite with Tech worst, followed by rate-sensitive Real Estate while Energy and Materials are the best and Utilities put in a strong performance. Welcome to the price volatility stage.
Mega-caps (MGK -0.5%) flip-flopped from relative strength yesterday to relative weakness today, underperforming a flat S&P Equal Weight index.
NVIDIA (NVDA -1.1%) was an influential laggard today. Apple (AAPL -1.2%), Meta Platforms (META -0.8%), and Tesla (TSLA -4.5%), which was downgraded to Underweight from Equal Weight at Wells Fargo, were also among the influential laggards. A month ago the relative weakness in mega-caps was pretty much Apple and Tesla, then Alphabet, but we almost never mentioned Nvidia as a notable laggard. That’s a change in character.
Materials ⇧ 0.99 %
Energy ⇧ 1.60 %
Financials ⇧ 0.73 %
Industrial ⇧ 0.27 %
Technology ⇩ -1.08 %
Consumer Staples ⇧ 0.25 %
Utilities ⇧ 0.68 %
Health Care ⇩ -0.39 %
Consumer Discretionary ⇩ -0.21 %
Real Estate ⇩ -0.63 %
Communications ⇧ 0.17 %
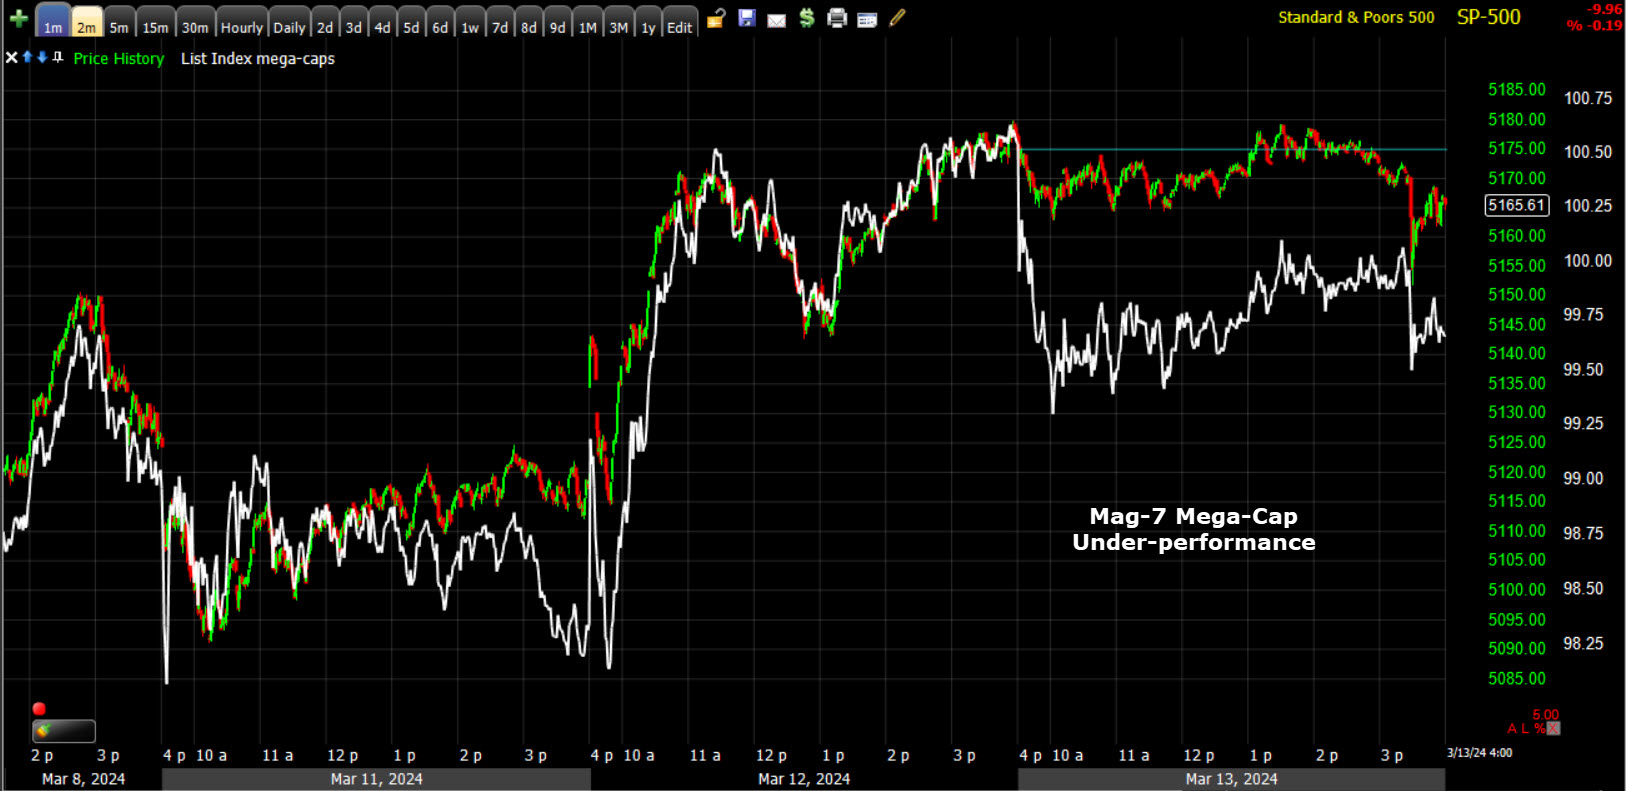 Mega-caps (2m) clearly underperform today. I’ve seen this type of relative weakness in Mag-7 stocks lead the market lower into some nasty volatility this month.
Regional Banks were off to a strong start with Value and Cyclicals in favor, plus the opening short squeeze. They gained +1.3% in early trade, then faded the rest of the day to end up +0.1%. The Fed’s BTFP program has expired.
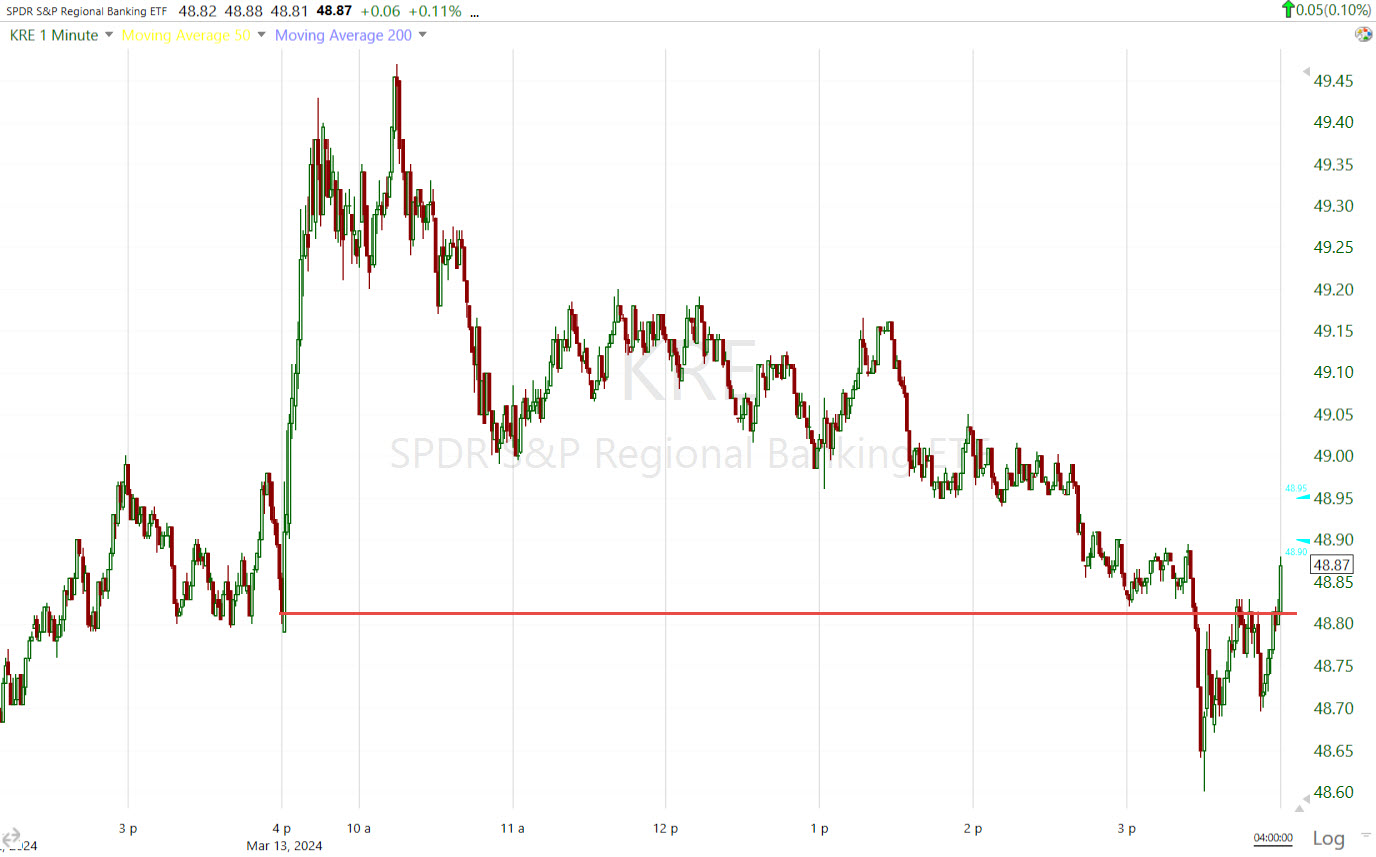
Regional Banks (1m today) – the point isn’t regional banks, or the BTFP, the point is that the early spike is right on track with short covering in my Most Shorted Index. I just don’t know that any of the “usual suspect” groups that have benefitted from short covering since November, including regional Banks, have what it takes to make their own way without short covering. This is the same concern I had when introducing the S&P biotech (XBI +0.95%) long swing trade idea. I like the price chart/volume a lot, just not sure about the short-covering momentum.
Speaking of XBI (+0.95%), as I said last night, the slight dip below the bull flag could actually end up being a positive (failed breakdown leads to fast reversal – or a mini channel buster).
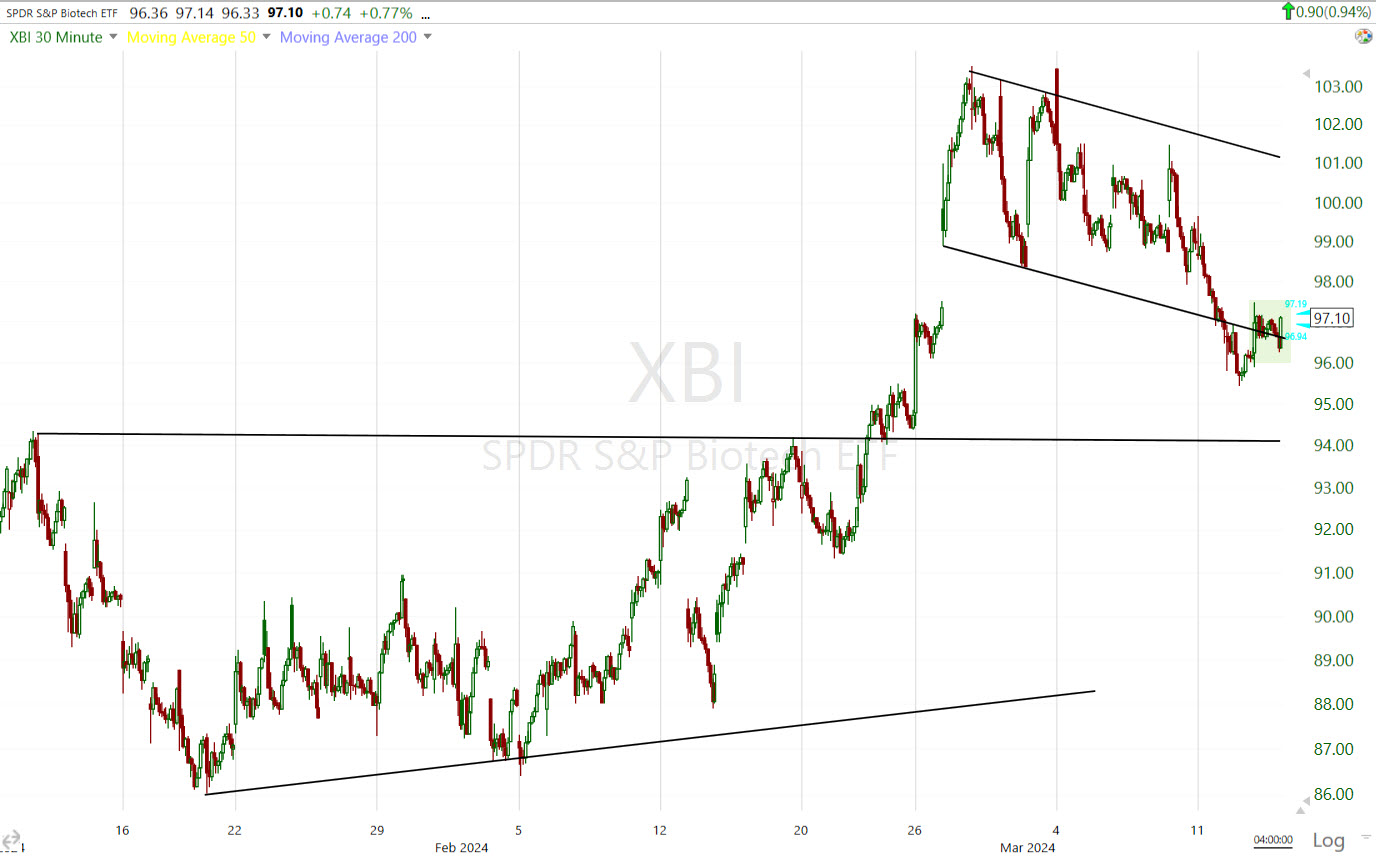 XBI (30m) – Price today made the save and jumped back in the bull flag. However, I still can’t account for short-covering. XBI had the same opening burst higher as regional banks as shorts covered at the open. The only other thing I can add is that when that 3:30 p.m. sell program hit, it didn’t effect XBI much, and the last 30 minutes saw a sprint higher into the close. I like the price action a lot. I’m just not sure that the sector can carry its own weight without short covering?
I have to cover the Energy sector. This is a great sector to own at the start of a new economic expansion. It’s not a great sector at the end of an economic expansion, unless inflationary pressures are in the mix. Given the inflationary bump, sectors like Energy and Materials are worth a look.
Broadly…
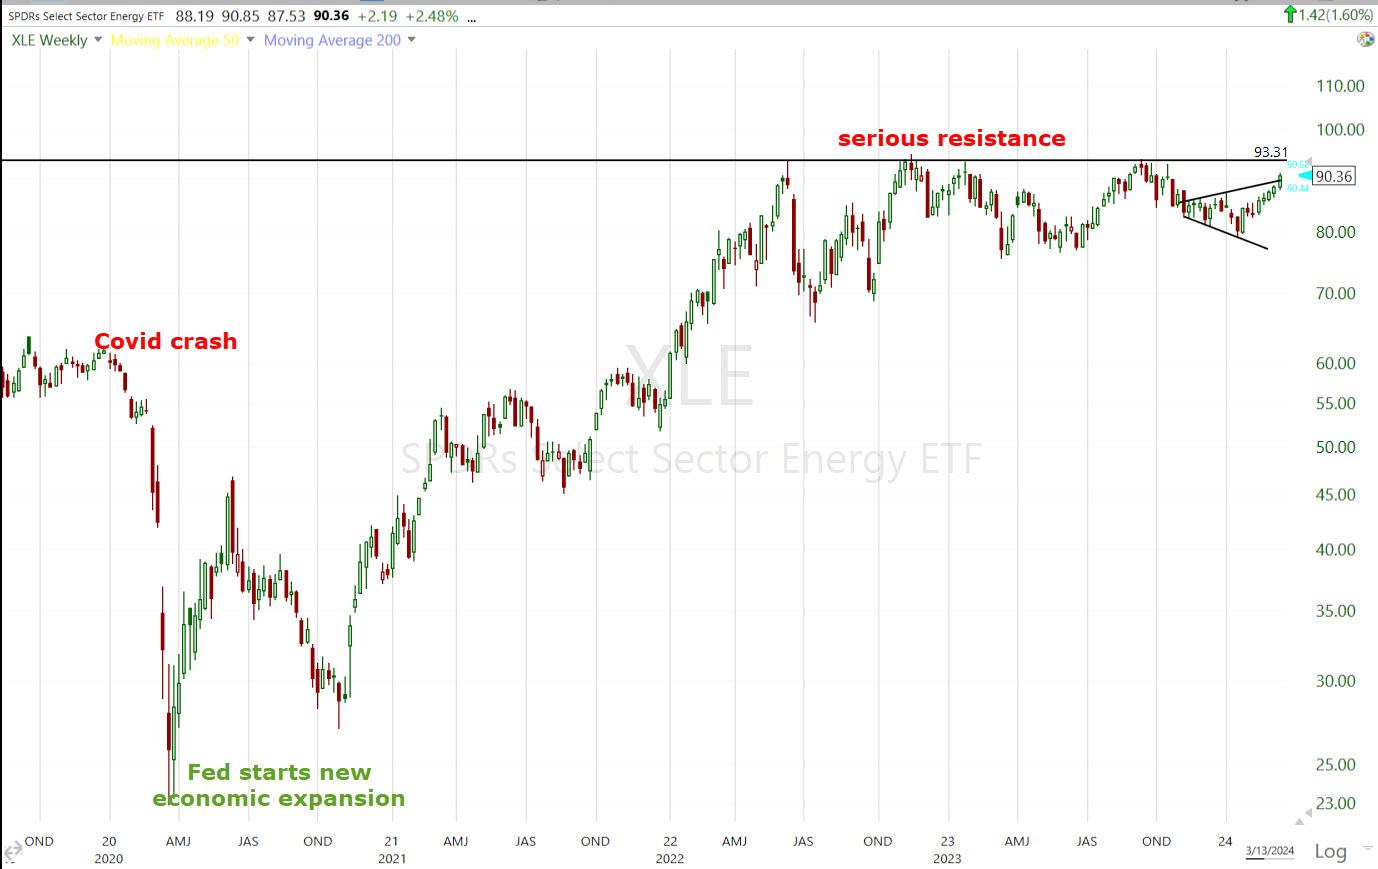 Energy sector (weekly) – Notice how strong the energy sector is after the Covid crash as the Fed dropped rates to 0% and pumped $120 billion a month of liquidity that found its way into the market. It was one of the first sectors to show real leadership after the crash.
Also note that since the 2022 top, there’s a serious zone of resistance above.
A closer look at that resistance…
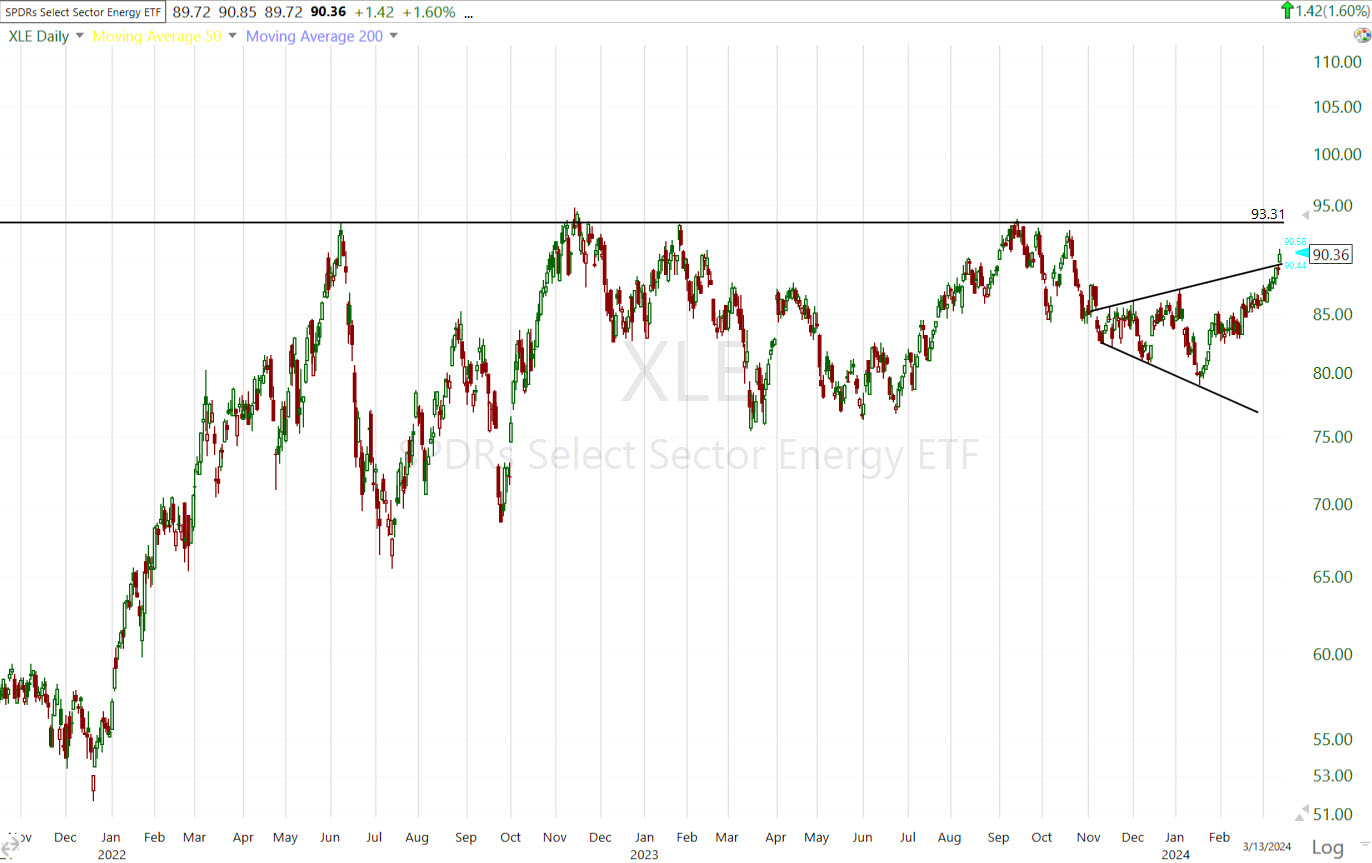 Energy sector (daily) – Also note the broadening formation to the far right.
A broadening formation is a sign of a chaotic, directionless, leadership-less market/sector that’s reacting chaotically to news and rumors. Given the preference for mega-caps and growth over value in 2024, it’s no surprise Energy has been a hard sector to buy. We’ve followed crude oil’s twisting and changing path for a while and that flows to the energy sector. But, price broke out of the broadening formation today.
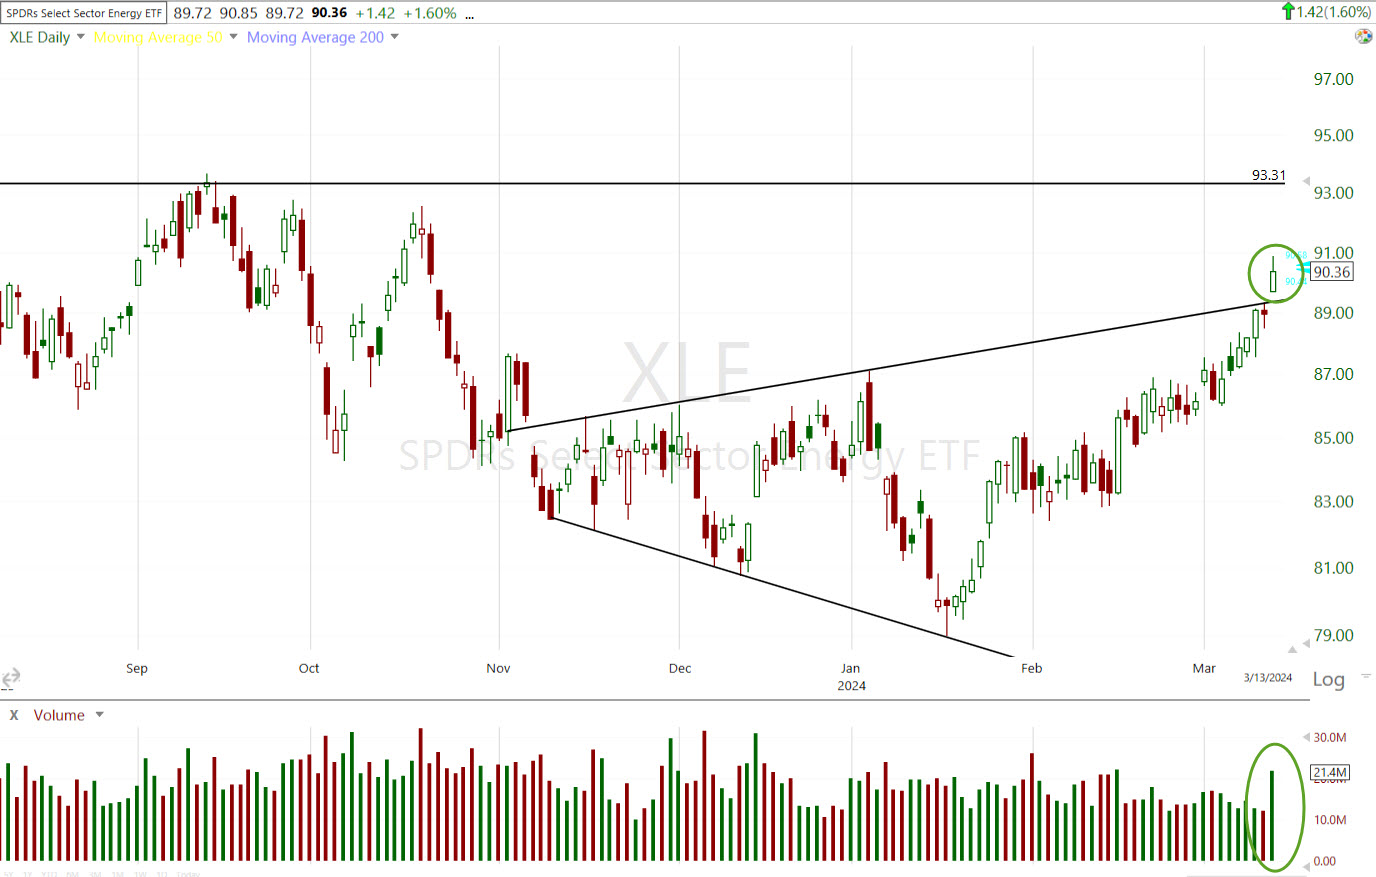 Energy sector (daily) – notice the nice heavy volume on the breakout too. Honestly, am I excited about being long energy? No. There’s a big zone of resistance just above. Maybe if WTI Crude breaks out above $80 and really tears higher.
Another interesting development is the Materials sector…
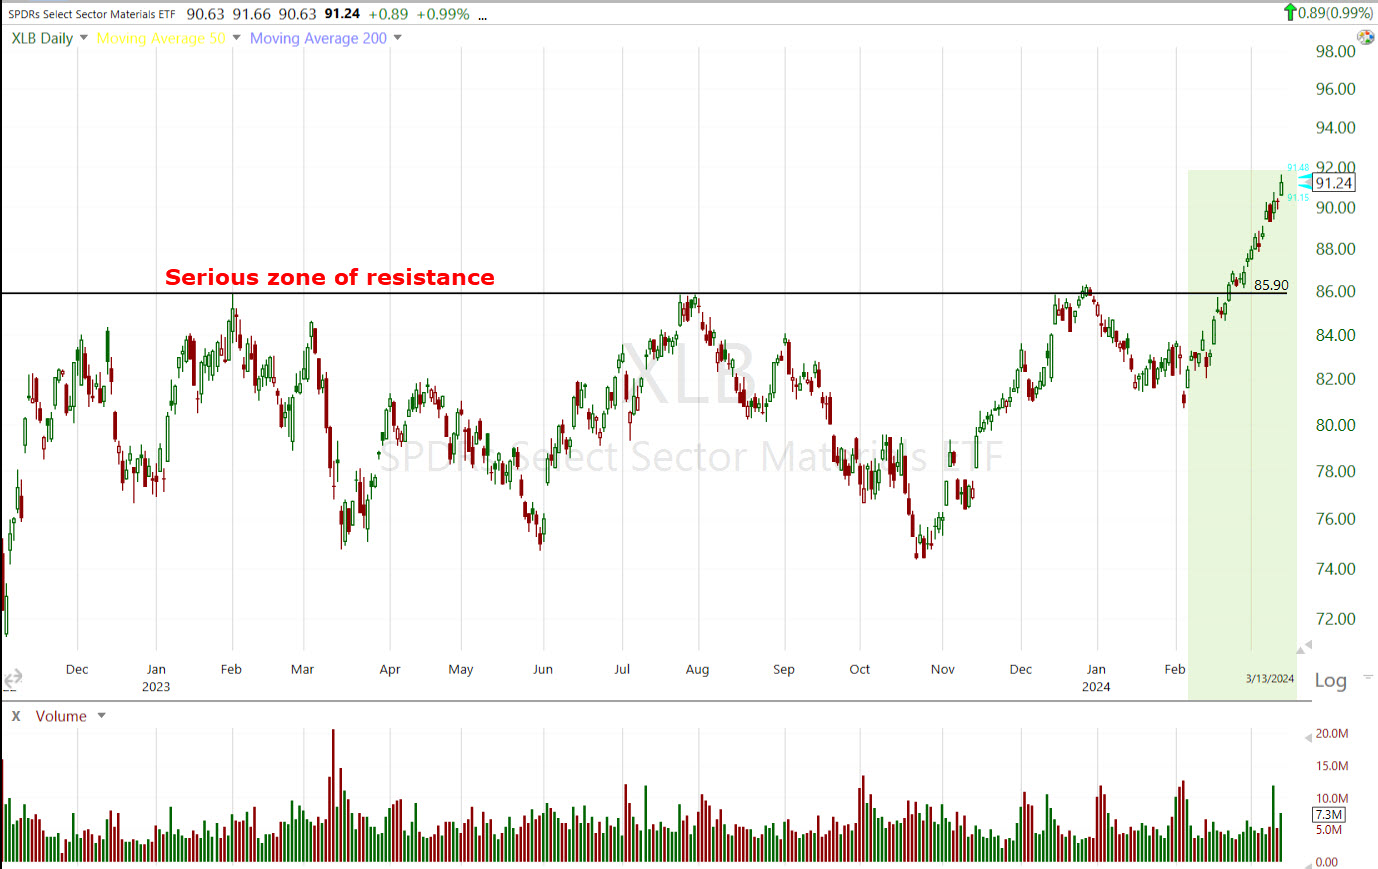 Materials sector (daily) – The sector has gained over +12% off early February lows.
Like copper, I’ve been aware of the large consolidations in some commodities, and related sectors and stocks. I’ve been aware of this large consolidation in Freeport-McMoran (FCX +7.55%) for a while, but it’s also been a large and long downward sloping consolidation of 15 months. It’s not exactly where you want to park money, but it too broke out today.
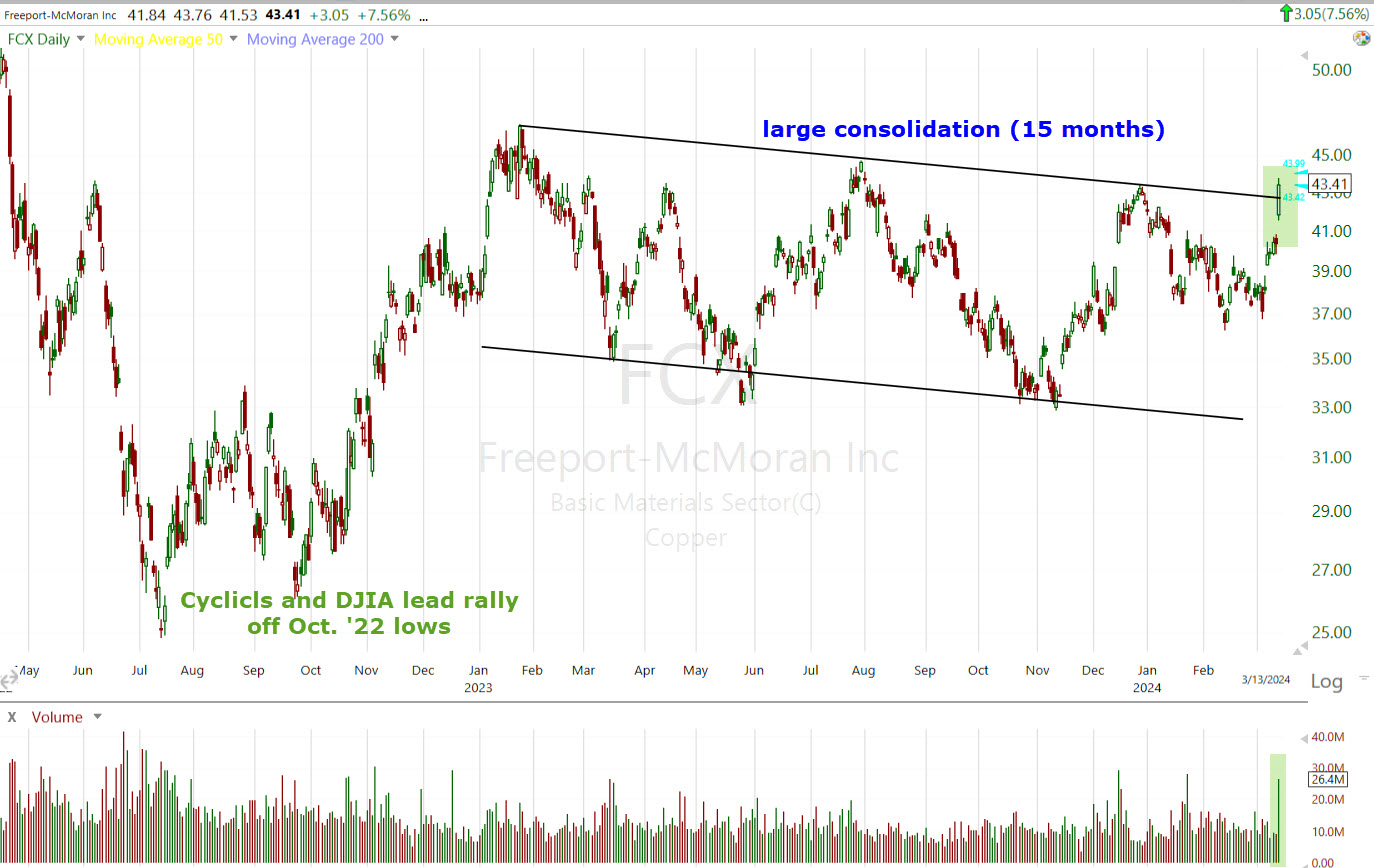 FCX (daily) – Ad with good volume. Why? Copper.
The more important takeaway from these charts is the shift we’re seeing in market tone and bias. Consider the timing of the gains in the Materials sector. What’s the message of the market? The bump in inflation.
I think investors are starting to show signs of favoring assets that are Value style factors, and that could benefit from a bump in inflation… like Energy and Materials. I’d put them on your radar, and be aware of the message in context of the big picture.
Internals
Advancers (1657) edged out Decliners (1127) at the NYSE – nothing special about the margin. Volume was interestingly heavier than usual at 1.1 bln shares. NASDAQ Composite Advancers/Decliners were nearly even – decliners had a 100 issue edge.
For a second day there was nothing remotely close to a Dominant price/volume relationship, despite the noticeably heavier volume.
Breadth oscillators are low grade overbought at 85.
A quick reminder of what the big picture is and why I say, “Fertile ground”….
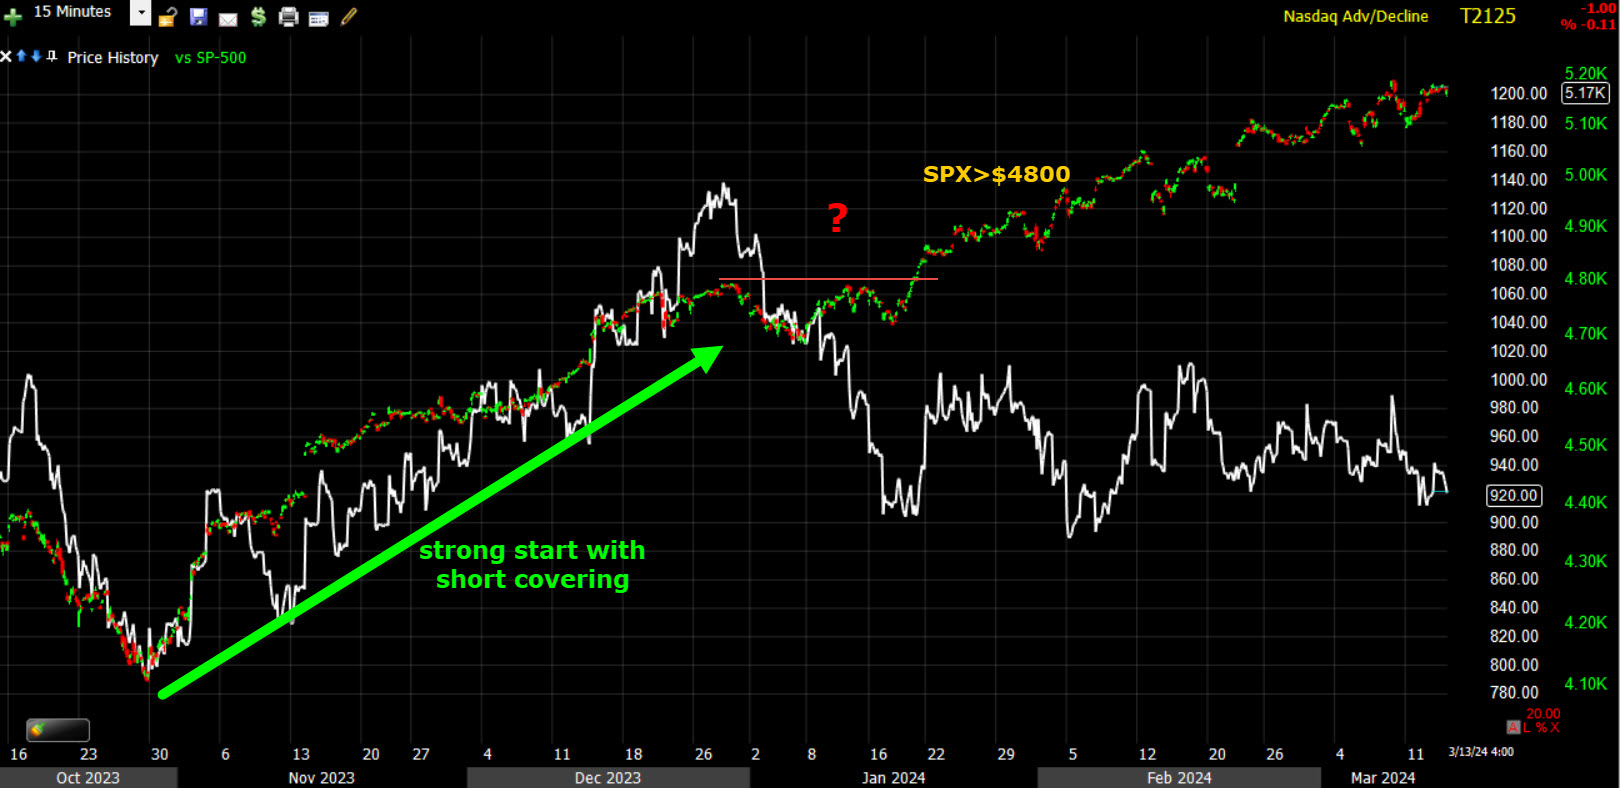 SPX (15m) and NASDAQ Composite’s Advance/Decline Line – Breadth was stellar in November/December. There’s no disputing that. The surprising factor was that we got so many, and such large short squeezes, and back to back (5 major squeezes). When those ended, so did market breadth/participation.
Remember that 5-week S&P consolidation below $4800, before the daily new record highs? That’s when market breadth started falling apart. At that point, only the mega-caps could lift the market with the “AI” narrative fueling the frenzy that helped the S&P breaking out of the 5 week consolidation and above $4800.
In such a thin market, the question you have to ask is, “What happens when those handful of heavily weighted mega-caps start to give way and break down?” There’s not much support from the rest of the “market of stocks”.
What’s worse, from a longer term perspective the COMPQX’s A/D line is the lowest its been since the “almost bear market” of early 2016. That means weaker than 2022’s bear market; weaker than at the height of the Covid Crash… and equity averages are just off all time highs!
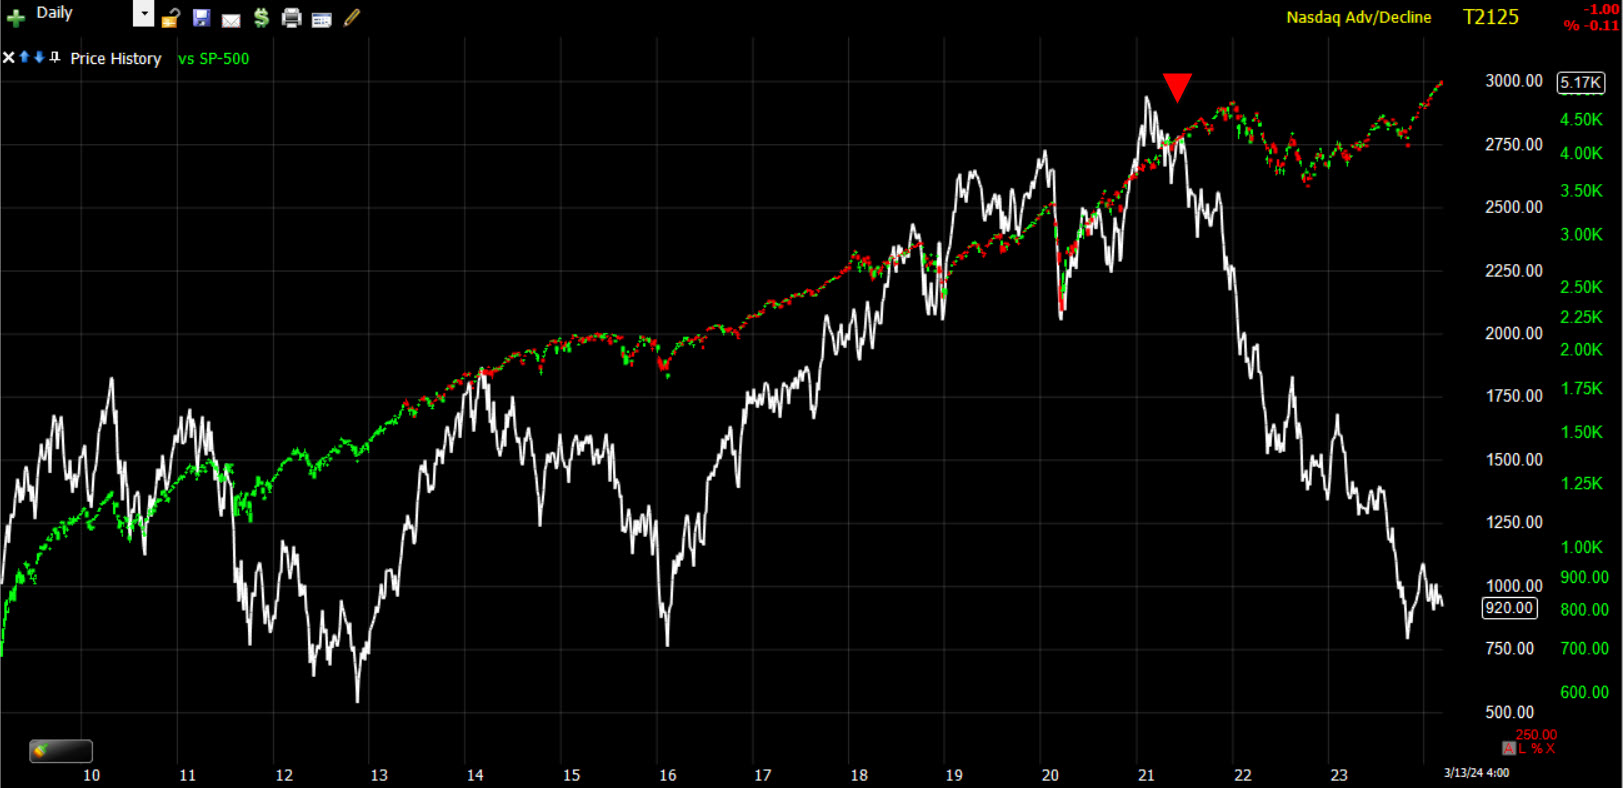
SPX (daily) and NASDAQ Composite’s Advance/Decline Line. Since the 2009 low, investors have slowly and steadily favored the mega-caps. What use to be a market of stocks, is a stock market run by 7 mega-caps. The rest of the stocks market is virtually nowhere to be found, and that accelerated into the 2022 top and bear market, right to the present. This is one of a few charts that make me think that an important long-term double top could form right here (between current highs and 2022 highs). Fertile Ground!
That’s a nice segue for this tidbit I gleaned from Sentiment Trader…
“Tech Stocks presently account for as large of a percentage of total U.S. and Global Market Cap as they did during the Peak of the Dot Com Bubble.”
Treasuries
Treasuries settled with losses again, and yields rose pretty uniformly across the curve (4 bp) like yesterday. That tells me that yesterday all of the asset classes took CPI seriously and discounted it, while Tech did not. The 10-yr yield rose four basis points to 4.19% and the 2-yr yield rose two basis points to 4.62%.
On a related note, today’s $22 billion 30-yr bond reopening was met with excellent demand.
Currencies and Commodities
The U.S. Dollar Index ended down about a tenth of a percent. Intraday weakness was caused by a rallying Yen (USD/JPY lower) as it looks likely the BOJ exits negative interest rate policy next week. The big moves in the dollar recently have all been about foreign developments, not so much U.S. developments. Keep watching it and know why it’s moving.
WTI Crude oil closed up by+2.9% and took another run at the $80 resistance zone.
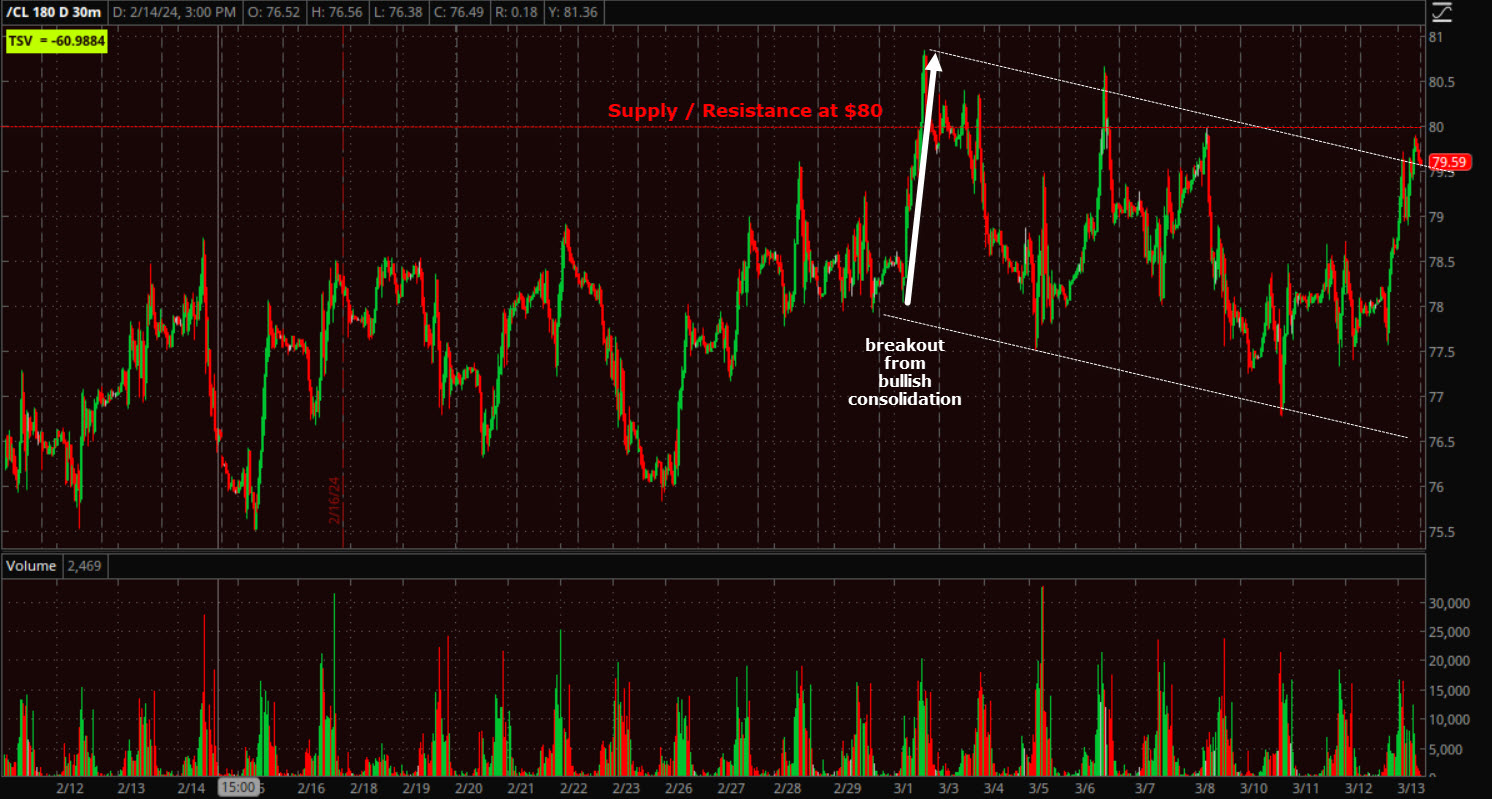 WTI Crude Oil futures (60m) –There might be a case for a bull flag here under $80. The volume is right; it comes after a breakout from a bullish consolidation that ran into resistance at $80 and it acts like a bull flag. The caveat is that the advance (flag pole) into the potential bull flag, isn’t large enough to be in scale with a typical bull flag. The mitigating factor of that concern is that this was the breakout point. I’m taking it with a gain of salt right now. What’s important is whether or not Crude breaks through $80. I think the chances are better than not. That then becomes an inflationary issue, a Fed issue, and a market issue – especially after what copper did today.
While Crude breaking out has a more significant downstream effect on inflation, in the meantime those pesky volatile energy prices that the Fed likes to ignore in measuring inflation, are about to hit the gasoline pumps. Whole sale gasoline prices are rising sharply. The DOE report earlier today showed another big draw in gasoline inventories today.
Pump prices about to surge?
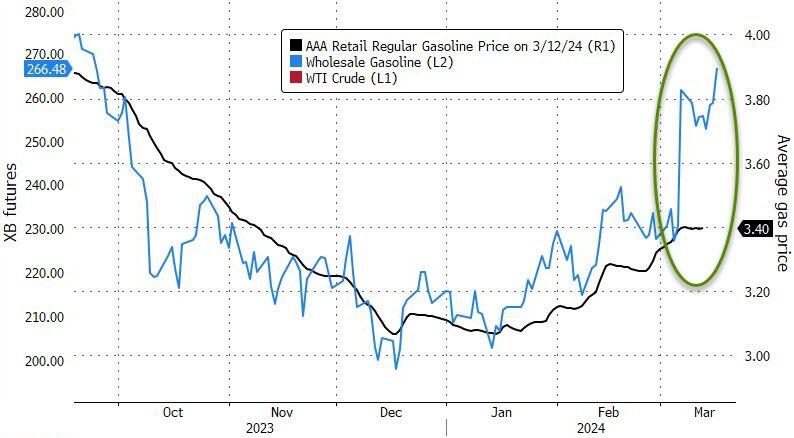
Source: Bloomberg
Gold rallied to erase most of yesterday’s CPI losses, gaining +0.7% to $2,180.80/oz, which was in large part due to a sinking dollar on the BOJ rate news. Gold appears to be entering the consolidation phase I’ve suspected was on the way due to recent price/volume.
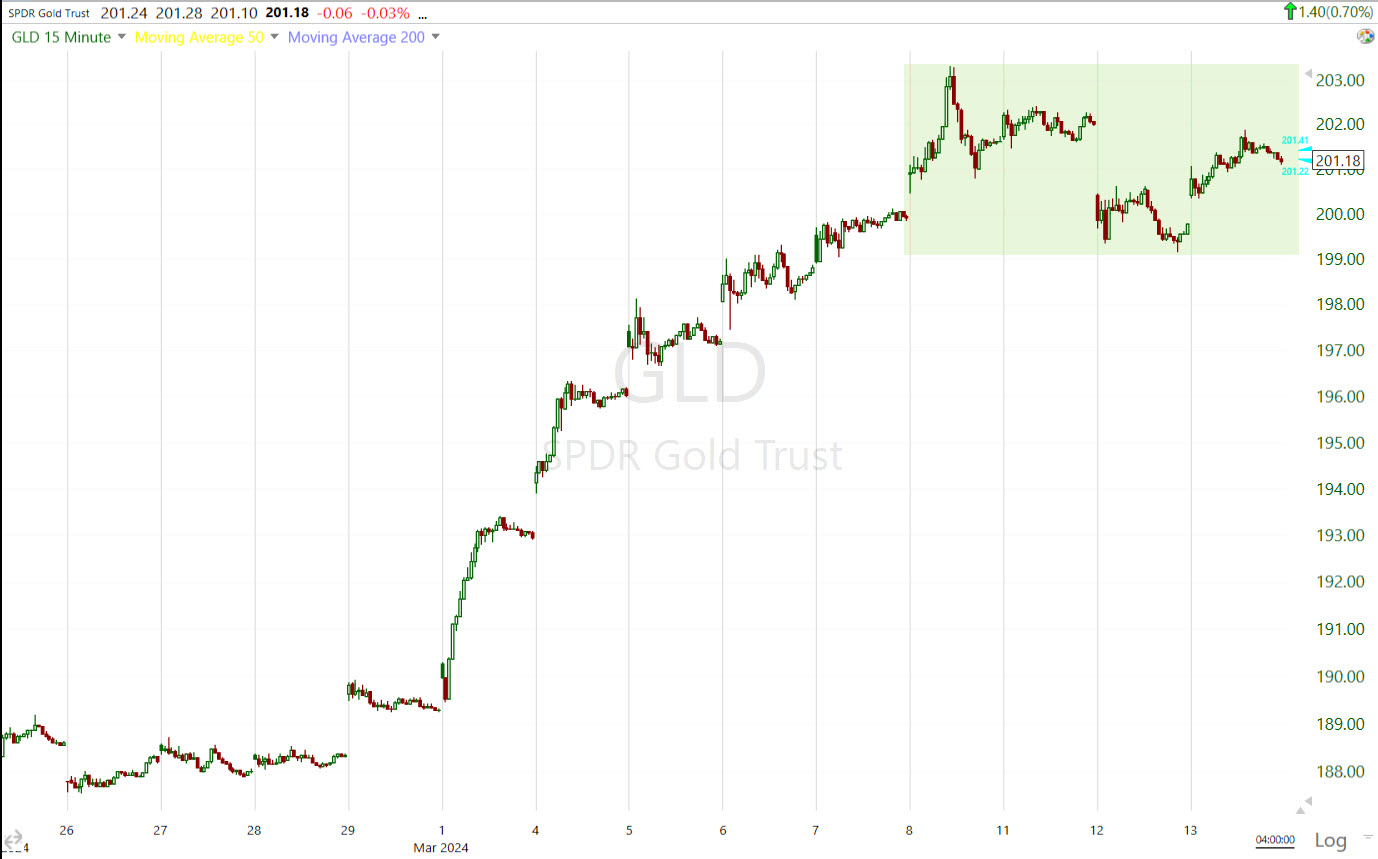
I prefer GLD’s chart (15m) over gold futures for looking at price consolidations. I feel like there’s less noise. It looks like gold is entering that much needed consolidation phase (shaded green). I can’t say what type of consolidation yet, but there are no indications of anything suspect at this point. I expect a bullish consolidation to flesh itself out.
Copper was a huge and important mover today as “Chinese smelters, which process half of the world’s mined copper, agreed on a joint production cut.” – source: MiningCopper.com
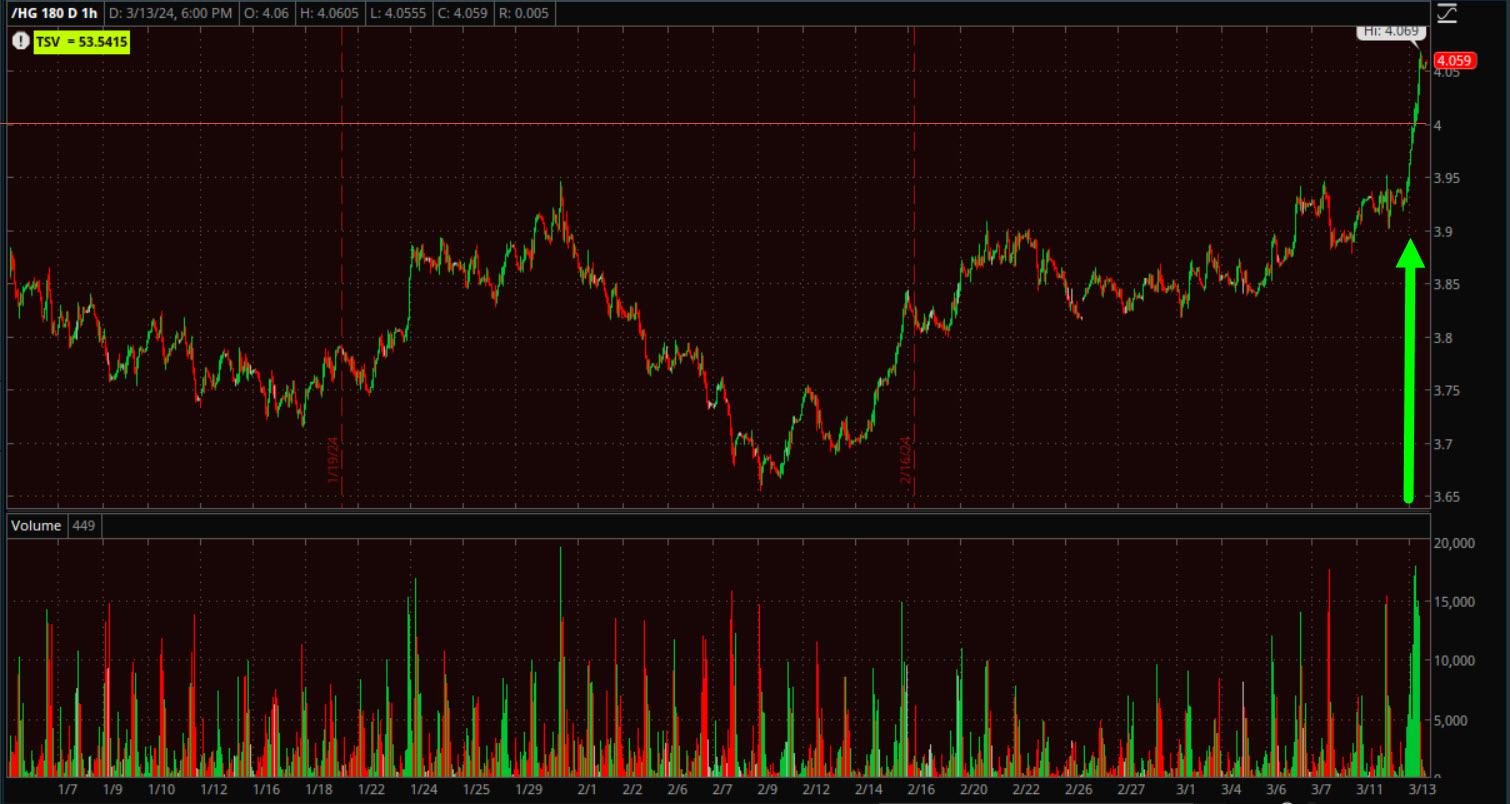 Copper futures (60m) – The price gain was huge, as was the volume. That’s bullish price/volume action.
Copper broke out above $4.00/lb. which is a level that it hasn’t spent much time above historically
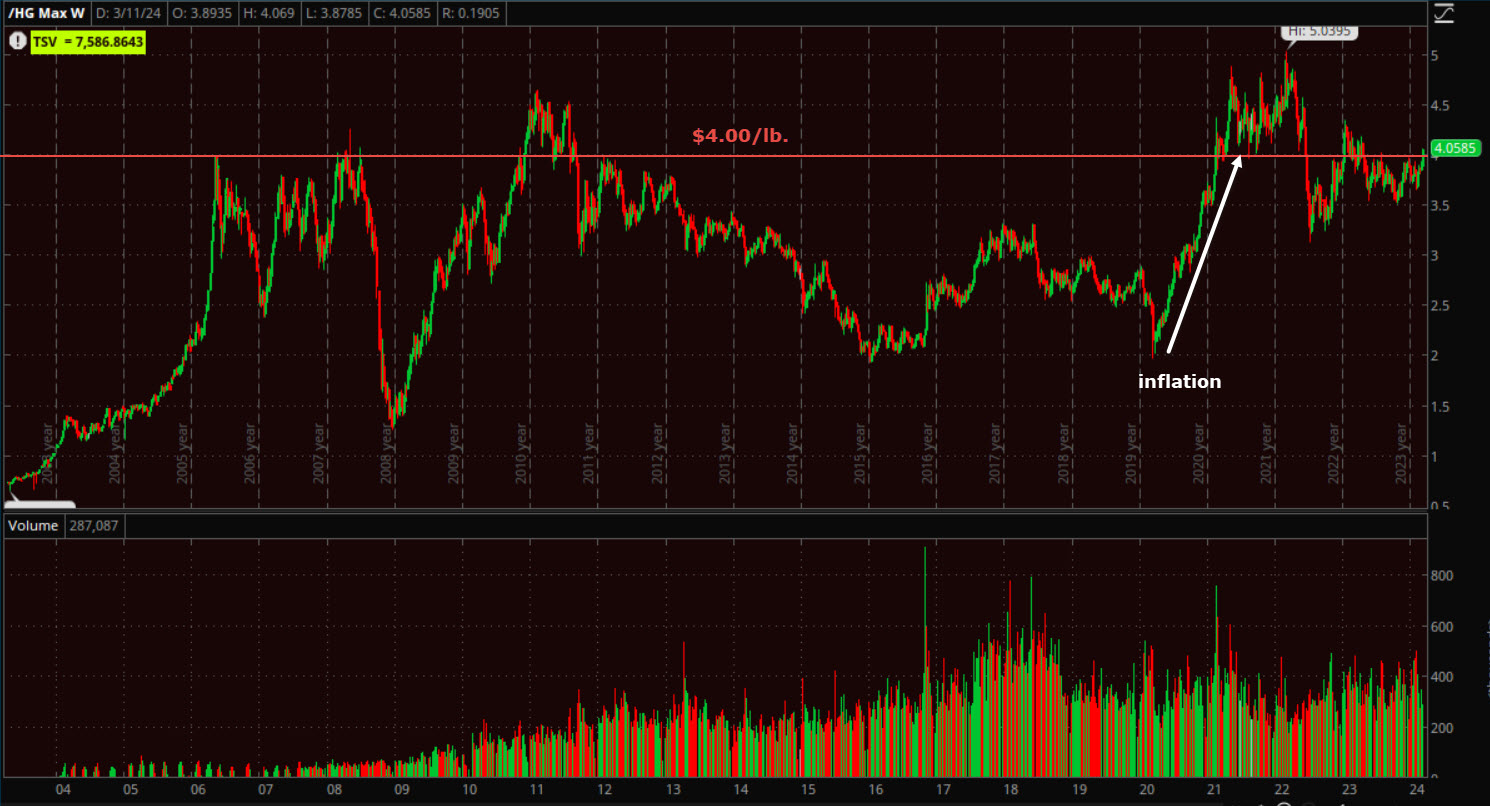 Copper futures (weekly) – You can see the inflation surge off 2020 lows. Since the peak, copper has spent more than 14 months in a big consolidation.
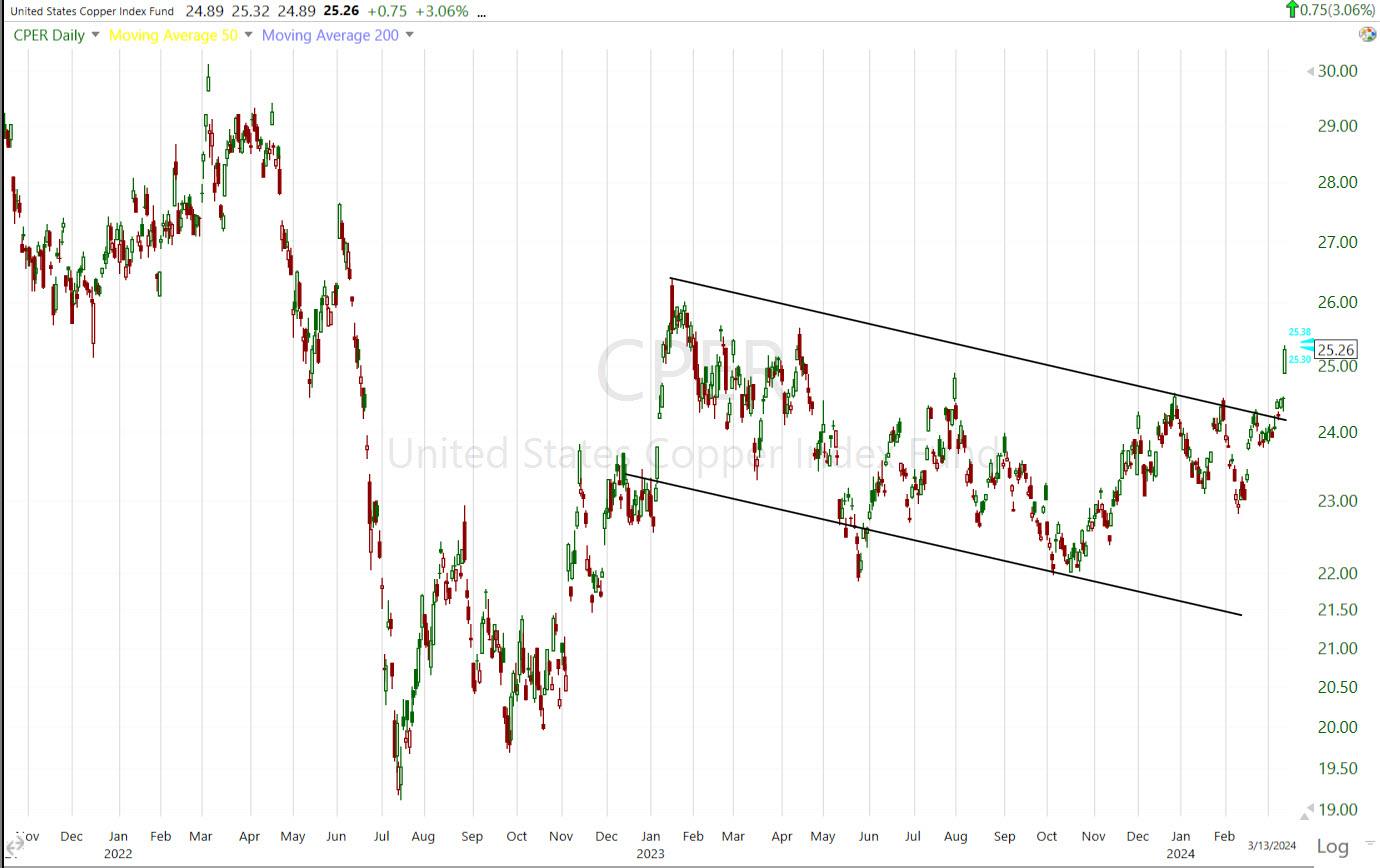 CPER (daily) – Usually consolidations aren’t more than 2-3 weeks, but commodities tend to bend that general rule. This is the form of a bull flag. I’ve been aware of it for a long time and just always figured if it breaks out, we’ll be in a new wave of inflation, which as you know, I haven’t seen evidence for making that call.
It is important to the inflation dynamic to understand the full scope of the situation in copper, and especially this detail…
“Copper inventory in warehouses monitored by SHFE rose steeply to 239,245 tonnes as at March 8 from 30,905 tonnes in the beginning of the year.” – source: MiningCopper.com
Bitcoin (BTC/USD) is up about +2.5% as of this writing. It set a new record high above $73k, after a strong bounce-back from yesterday’s CPI losses when buyers stepped in at the test of $69k.
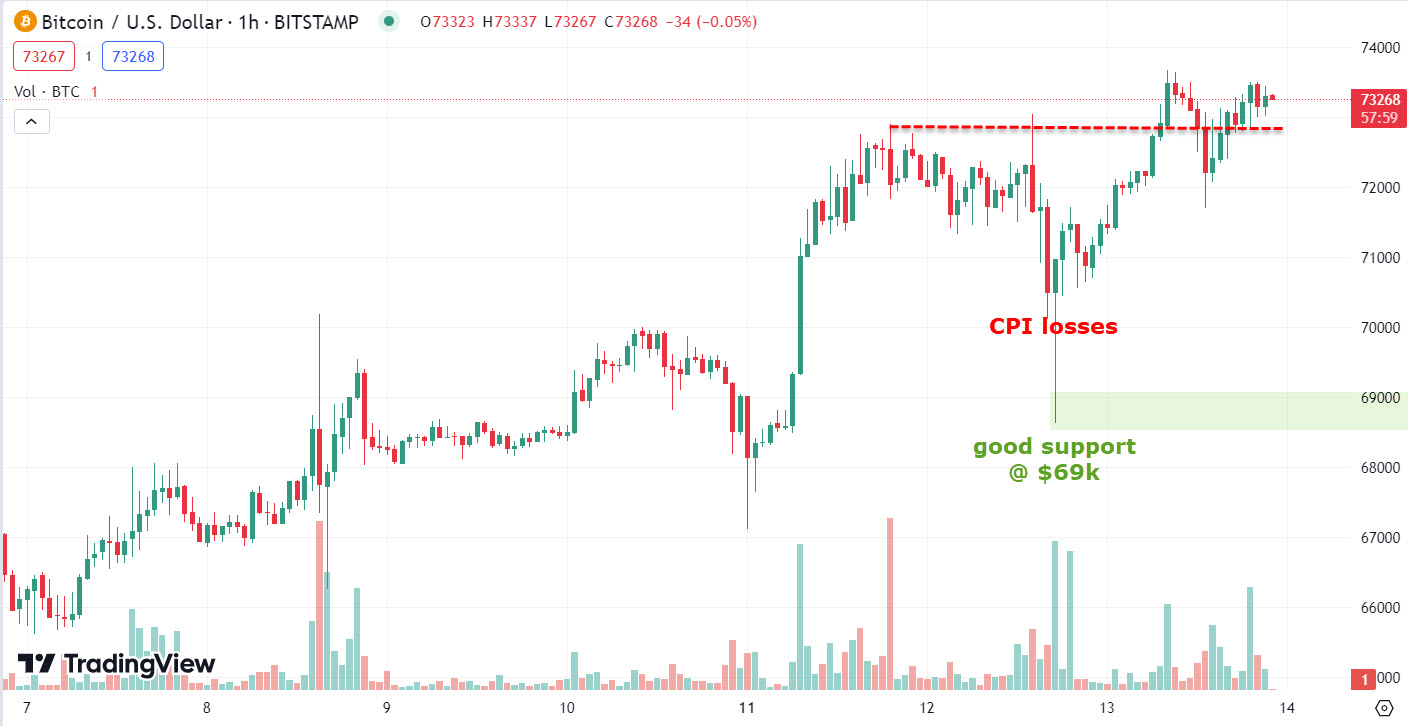 BTC/USD (2H) – I don’t love the fact it wasn’t a decisive breakout, and I don’t love volume which we can see declining on the advance off $69k. I wouldn’t throw BTC out of bed for eating crackers at this point, I’m just clocking the tone as it develops.
I also want to note, for whatever it’s worth, Bitcoin futures’ volume and 3C charts were noticeably weaker today.
 BTC futures (2m w/ 3C)
And this isn’t a day, it’s a trend for this record setting run. Bitcoin futures really highlight the falling volume into the rally…
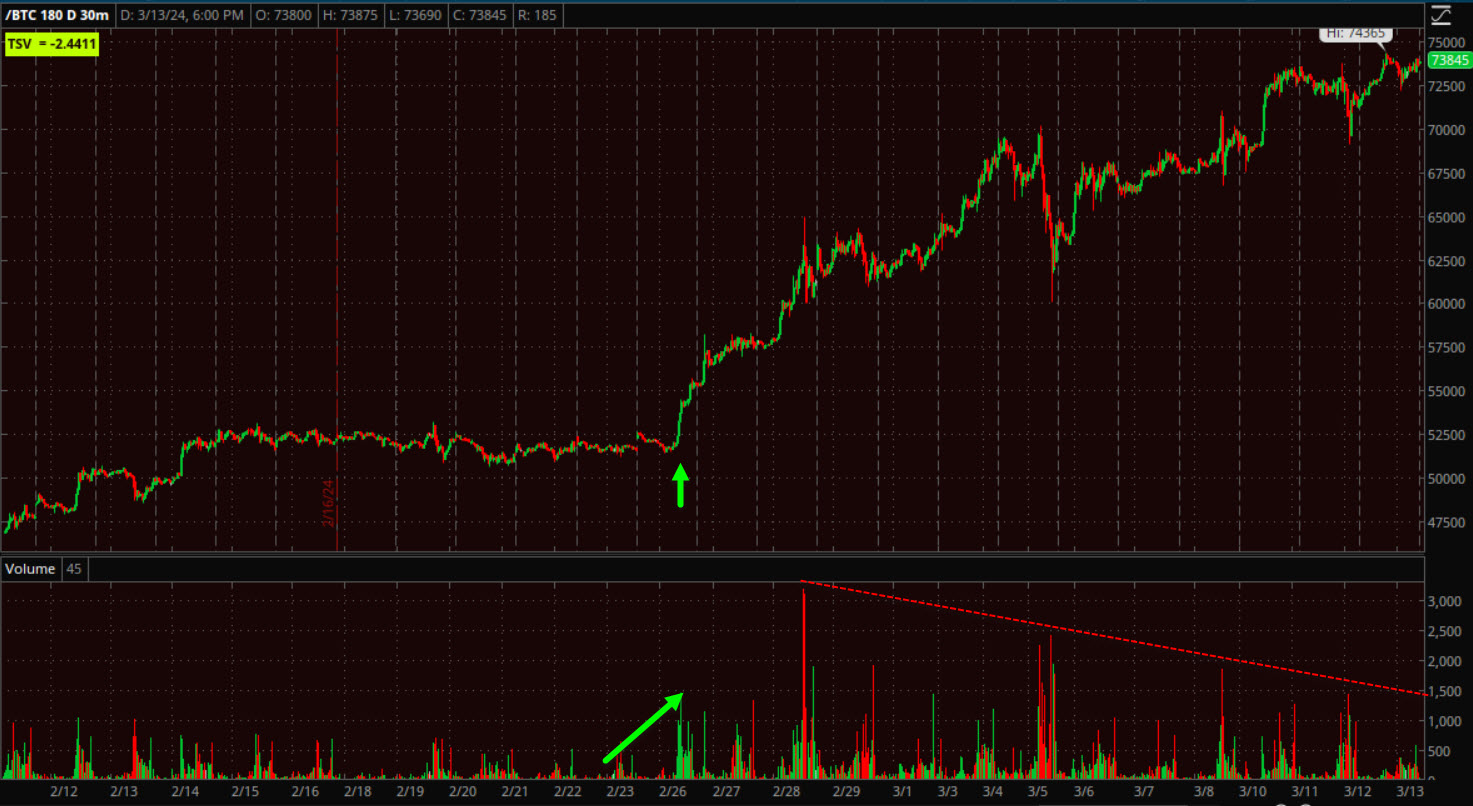 BTC futures (30m) – the volume started out great on the run, but has since been in decline with a lot of red volume bars.
My crypto pick –because I preferred not to chase price, and thought it was a strong bullish price set-up — Solana, is up +9% at the time of this writing.
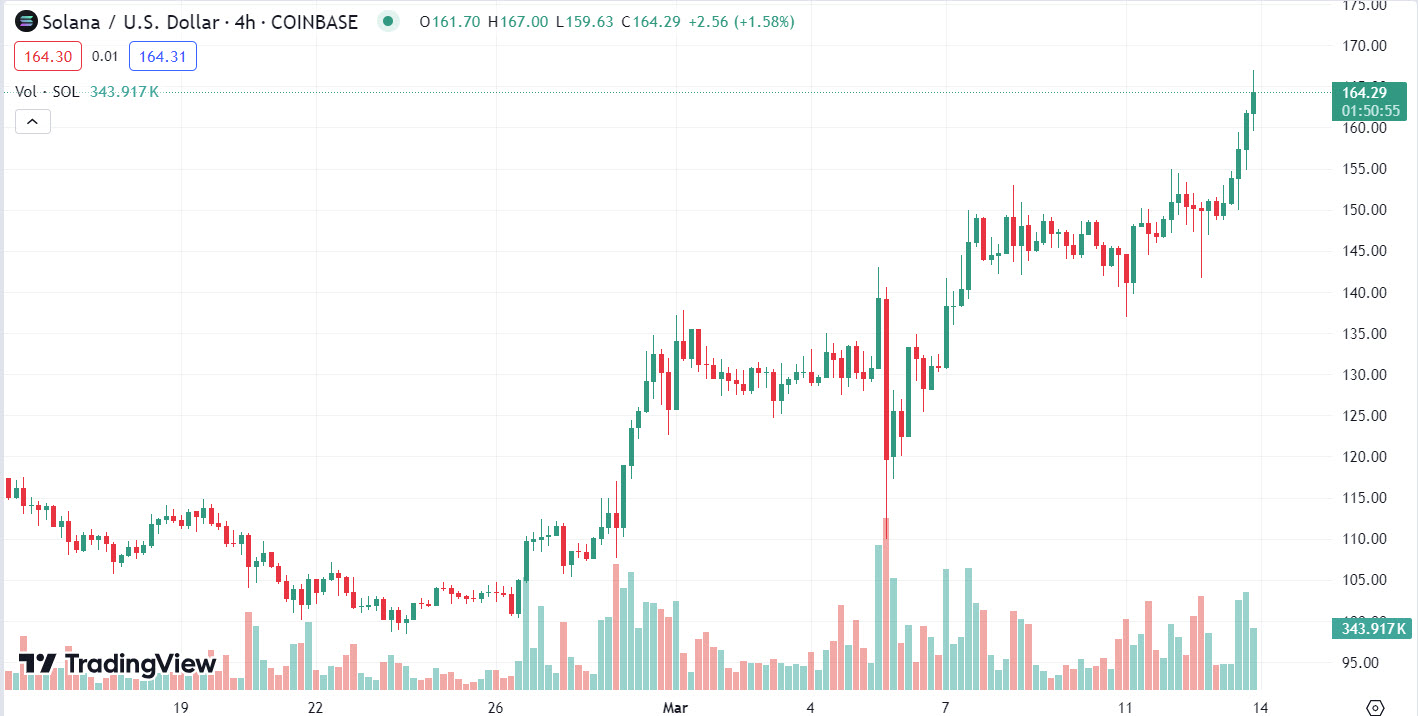 SOL/USD (2H)
SOL was at $117.93 when I first threw the idea out there in April 28th’s Daily Wrap. It’s now at 164. That’s nearly a 40% gain in 2 weeks, plus the risk/reward and probabilities looked more favorable to me.
Summary
I’ll probably use the phrase, “Fertile ground” more often. This refers to months of negative divergences with Credit (institutional money); alligator jaws divergences on 3C charts; the macro environment; thin market breadth, highly concentrated positioning, euphoric sentiment. I could go on and on. We’re not seeing the market breadth and strength of 2020-2021, or October 2022, or even November 2023. Right now we have some breadth indicators that are the worst I’ve seen in years – some in decades. That’s “Fertile ground”.
There’s no arguing that an overbought market can stay overbought much longer than any of us think reasonable. That’s the nature of euphoria in markets. Just as we saw intense fear in October. Overbought markets can produce some spectacular gains. Frenzies and euphoria often do. However, this is a thin market. I’ve seen my share of thin markets and while I wouldn’t say, “short it all now”, I don’t trust them. Thin markets that are heavily concentrated in one group of stocks, that’s this overbought, is like skating real fast on very thin ice. Things can change and get very chaotic very quickly.
What can pop the Mag-7 and Semi bubble? The same thing that popped it in 2022. Higher yields. I don’t think the Fed hikes again, but probably stays higher for longer. We’ll find out next week. I’m also not a fearmonger saying that we’re headed for a 1970’s resurgence in inflation. I think a “bump” in inflation can pop the bubble of a thin market that’s priced to perfection.
Copper’s run today just adds to the inflationary pressure. Granted, this is not about high demand for copper. It’s about Chinese smelters agreeing to limit production like OPEC does for oil. Still, it’s an increases cost in an important supply chain. It’s a supply side issue, but so was the out of control inflation surge after Covid. It’s enough to cause trouble for the high-flying, crowded leadership positions.
I think we’re seeing more and more evidence of a top process unfolding. The flagship of the 2024 rally, Semiconductors, have produced no gains in 3 weeks, but huge volatility lately.
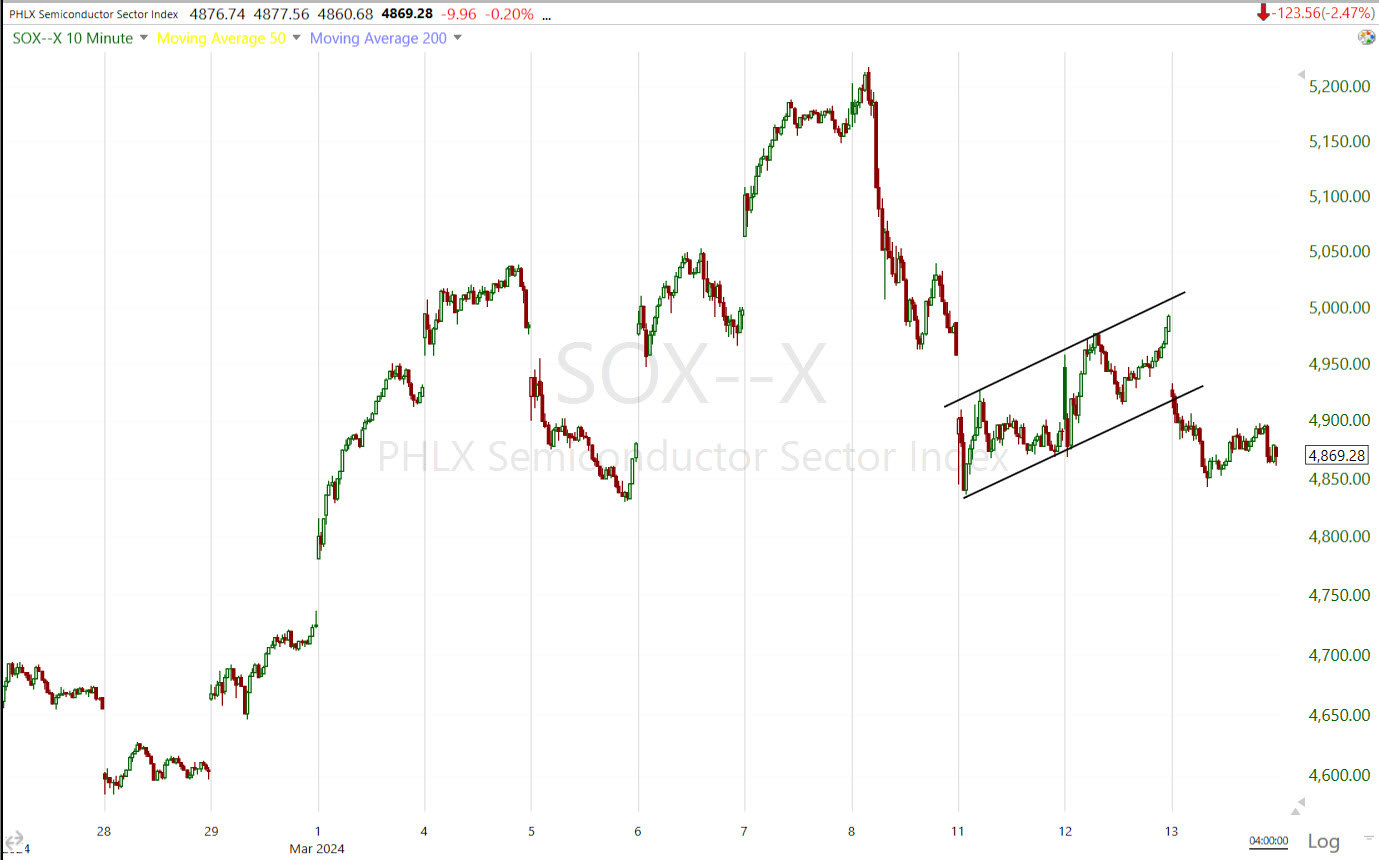 SOX (10m) – If this isn’t an important change in tone and message from the market, I don’t know what is. We’ve got a bear flag that broke today. We have the rough outline of a small Head and Shoulders top with perfect confirming volume. We’ve got bearish intraday price action today. This is the market leader.
That doesn’t mean there aren’t long opportunities that are looking more and more interesting. I threw FXI (China 25 +0.33%) out there for a swing trade. It’s halfway to the measured move. It probably sees a small bullish consolidation here at the halfway point as is usually the case.
Emerging Markets (EEM -0.3%) is starting to look interesting.
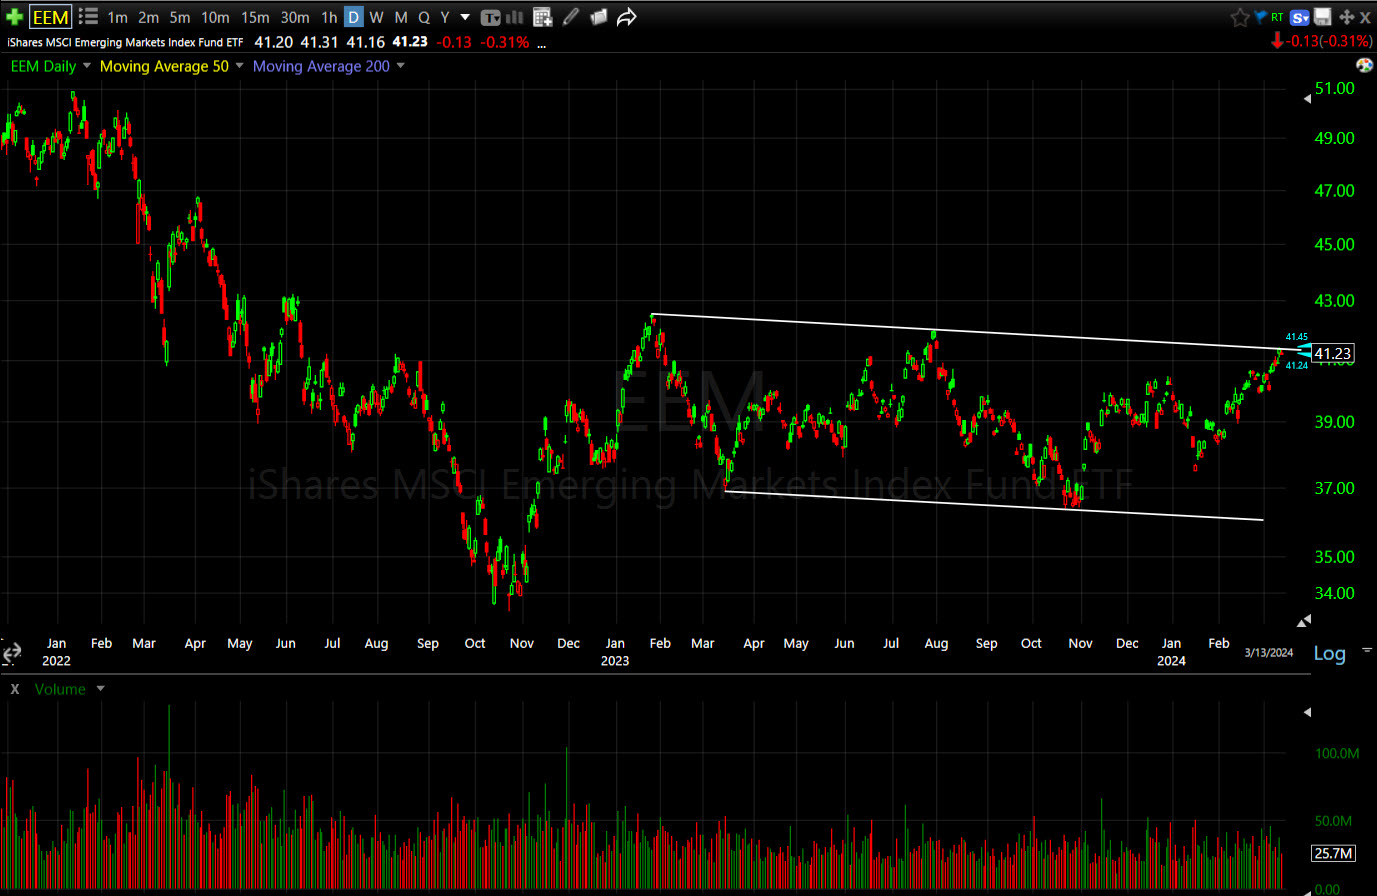 EEM (daily) – This is another huge consolidation since Jan. of 2023- similar to copper and FCX. Might it breakout soon too? It’s on my radar. And what’s the message there? Could money flows be shifting out of the U.S. and to other nations/markets? That’s one reason I’ve been so interested in what the Dollar does from here.
Tomorrow is PPI (Producer Price Index) and Retail Sales. PPI is not quite as closely watched as CPI (Consumer Price Index), but could change how CPI is perceived, and just ahead of next week’s FOMC meeting.
Overnight
S&P futures are up +0.1% tonight, led by NASDAQ-100 futures (+0.25%). that seems to be the Tech dip-buyers, and who can blame them, it’s worked well in 2024. but… just ahead of PPI and Retail Sales?
The U.S. Dollar Index is up 0.05%.
WTI Crude Oil futures are up +0.05% just under $80 ($79.77/bbl).
Gold futures are down -0.15% and look to have entered the consolidation phase.
Bitcoin futures are down -0.1%.
The 2-yr yield is up 1 basis point and the 10-yr unchanged.
Thursday’s economic calendar features:
- 8:30 ET: February PPI (prior 0.3%), Core PPI (prior 0.5%), February Retail Sales (prior -0.8%), Retail Sales ex-auto (prior -0.6%), weekly Initial Claims (prior 217,000), and Continuing Claims (prior 1.906 mln)
- 10:00 ET: January Business Inventories (prior 0.4%)
- 10:30 ET: Weekly natural gas inventories (prior -40 bcf)