The major indices opened somewhat soft after ugly overnight data out of China, but quickly shifted into rally mode after the 8:30 a.m. U.S. economic data sent TSY yields lower.
The the People’s Bank of China announced a 10 basis points cut in the one-year medium-term lending facility rate to 2.65%. China also reported some weaker than expected retail sales, industrial production, and fixed asset investment data for May.
Briefly, this morning’s U.S. economic data was mixed in aggregate, but featured a modest 0.1% increase in May retail sales, excluding autos, the highest four-week moving average for initial claims since November 20, 2021, and some year-over-year deflation in import and export prices.
The ECB hiked rates by 25 basis points as expected, but had a credible hawkish tone with regard to further rate hikes, which sent the Euro soaring against the U.S. Dollar (EUR/USD +1.2% -the biggest 1-day gain since early February) after a Fed rate hike pause. It is obvious in how yields fell sharply at 8:30, the market was more concerned about the weak, or higher than expected Initial Jobless Claims.
Beyond that, I think today was just an extension of what we saw yesterday…
“As you may know by my last few posts of the day, the market’s initial hawkish reaction faded to something more along the lines of the market not believing the more hawkish than expected Dot-Plot. We can see evidence of that everywhere, from how the major averages closed, to S&P sectors, the Dollar and fixed income.”
As for timing with regard to a Fed rate hike pause, it’s not much different than yesterday’s Afternoon Update,
“…I’m not sure this is the “sell the news” aspect of the Fed pause, I actually expect that to take the rest of the month”
Or with a little more detail from a week ago, from Thursday June 8th’s Daily Wrap,
“ An S&P close above $4300 would very likely start the short covering, which is buying demand, which would send prices higher, causing more shorts at a larger loss to start covering, until we have a full blown short squeeze. Dumb money, listening to CNBC and Goldman Sachs tell them that we’re in a new bull market and that Small Caps’ week of outperformance is an indication the economy is improving, will likely buy this crap, quite literally, which is exactly the group of people smart money wants to unload their shares on at higher prices. That’s been my expectation for the end of Phase I, catalyzed buy a “Sell the news” event if and when the Fed fails to hike rates next week. I don’t expect there will be an immediate sell the news on no rate hike, but rather we’d likely see an initial rally, but smart money that’s been front-running the Fed ending its rate hike cycle with peak inflation and peak hawkishness last year, will use that to sell into.”
Averages
All of the major averages closed higher with the S&P, NASDAQ-100 and Dow coming in with nearly the exact same price-percentage gain. Small Caps were trading around their flat line or in the red until shortly after this post – Small Caps Getting Ready, They rallied into the late afternoon, closing just off the day’s high. Dow Transports (+1.55%) were not too different than Dow Industrials. All of these similar percent changes suggest it was just a broad- buy everything kind of risk-on day.
S&P-500 ⇧ 1.22 %
NASDAQ ⇧ 1.20 %
DOW JONES ⇧ 1.26 %
RUSSELL 2000 ⇧ 0.81 %
The major indices all closed near their highs of the day, which had the S&P 500 above 4,400.
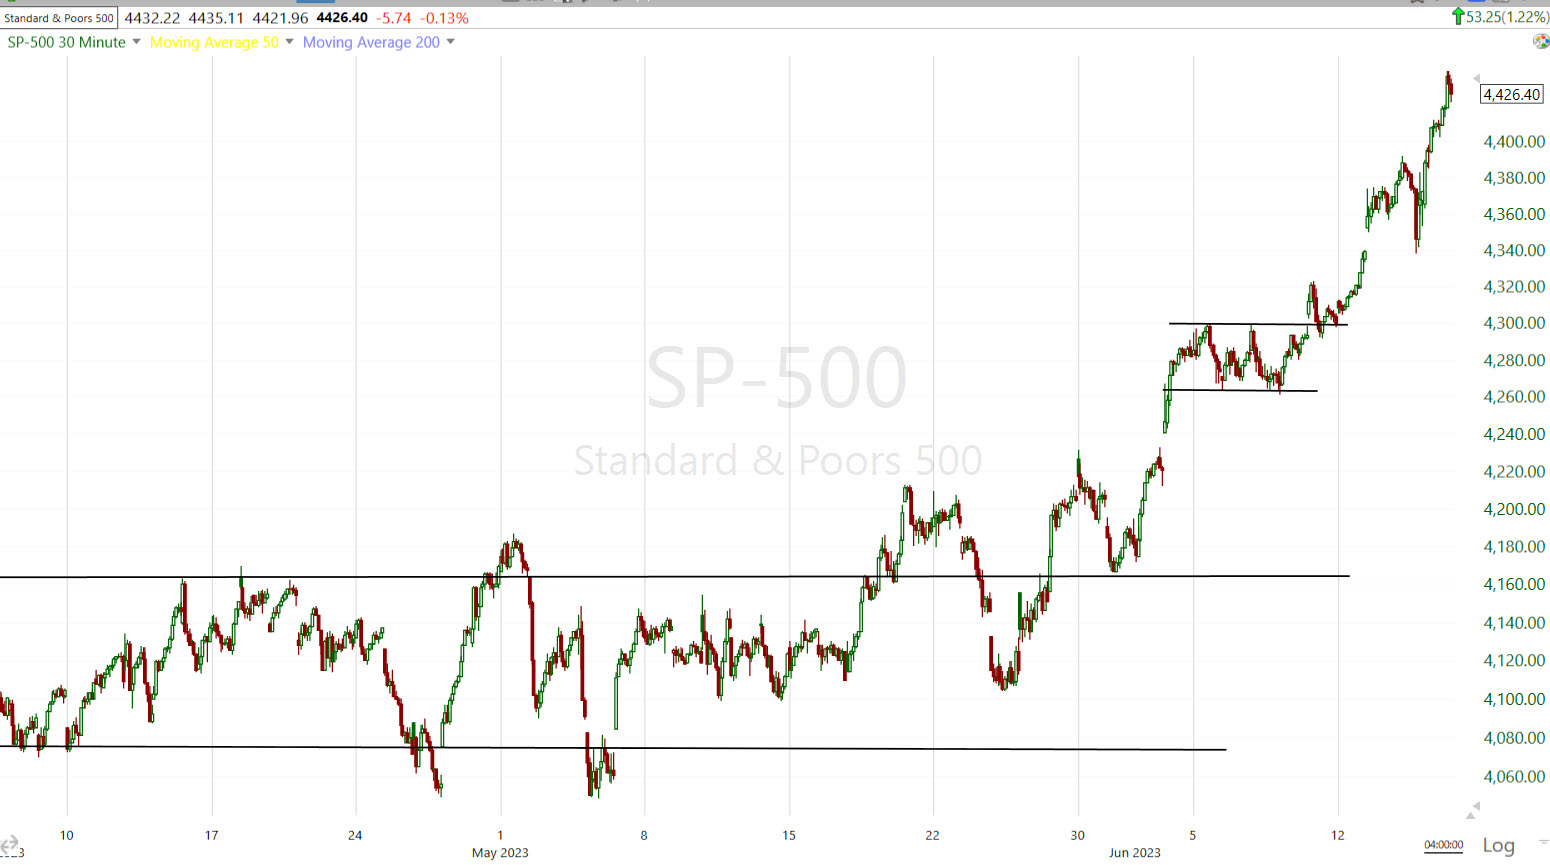 SP-500 (30m) – Not that price gains aren’t bullish, but price is getting frothier in a near vertical rally recently with no notable bullish consolidations to build in support along the way.
The Dow mad a notable technical achievement…
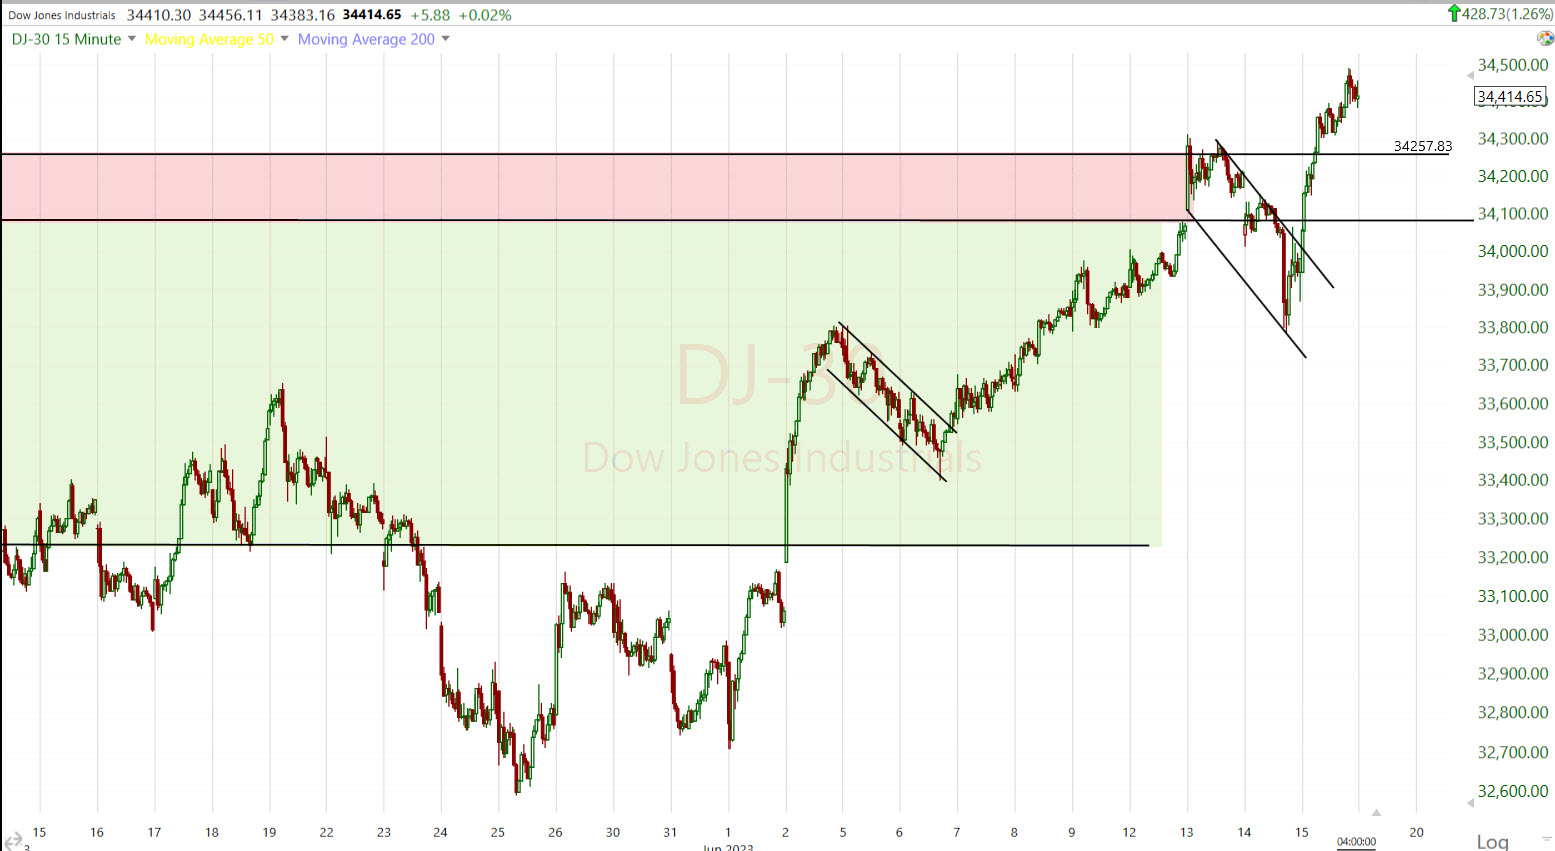 Dow (15m) after popping back into the 8 week lateral range for the S&P (green), the Dow broke out above, but was turned back at May 1 resistance from a failed breakout. The Dow consolidated in a bull flag the prior 2 days, and made another run at resistance, this time closing above. The Dow still has resistance just above from November/December 2022.
The NASDAQ-100 continues to act very well on good volume…
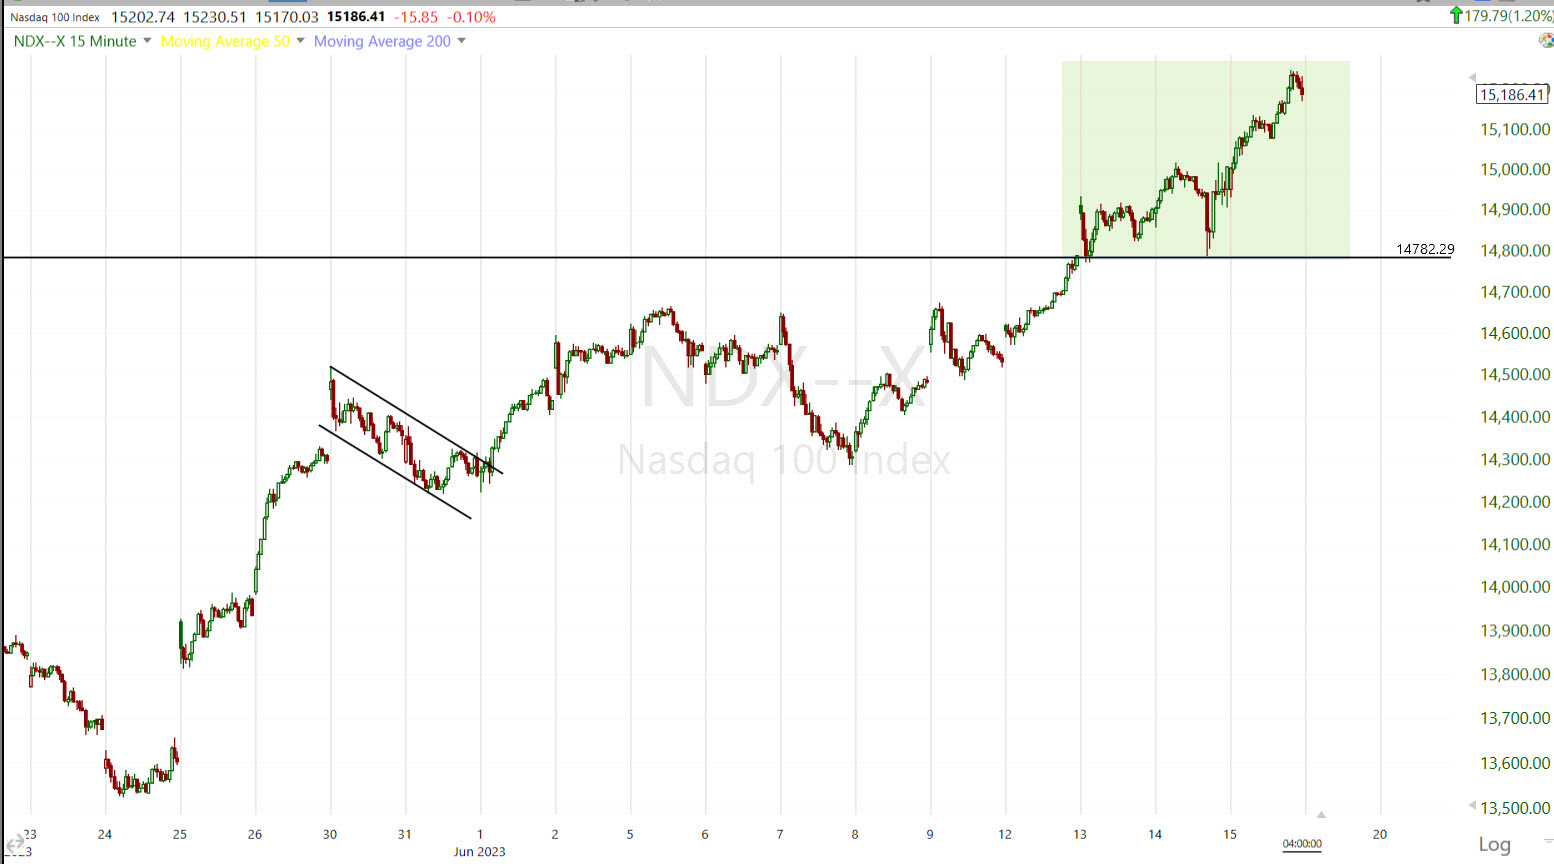 NASDAQ-100 (15m) but we haven’t seen many, if any bullish consolidations, especially since trading above its measured move. Translation = this is a market getting speculative and frothy, and risks a blow-off top like event.
As for Small Caps, they just saved a breakout from a bull flag from being invalidated (failed breakout lead to fast price reversals).
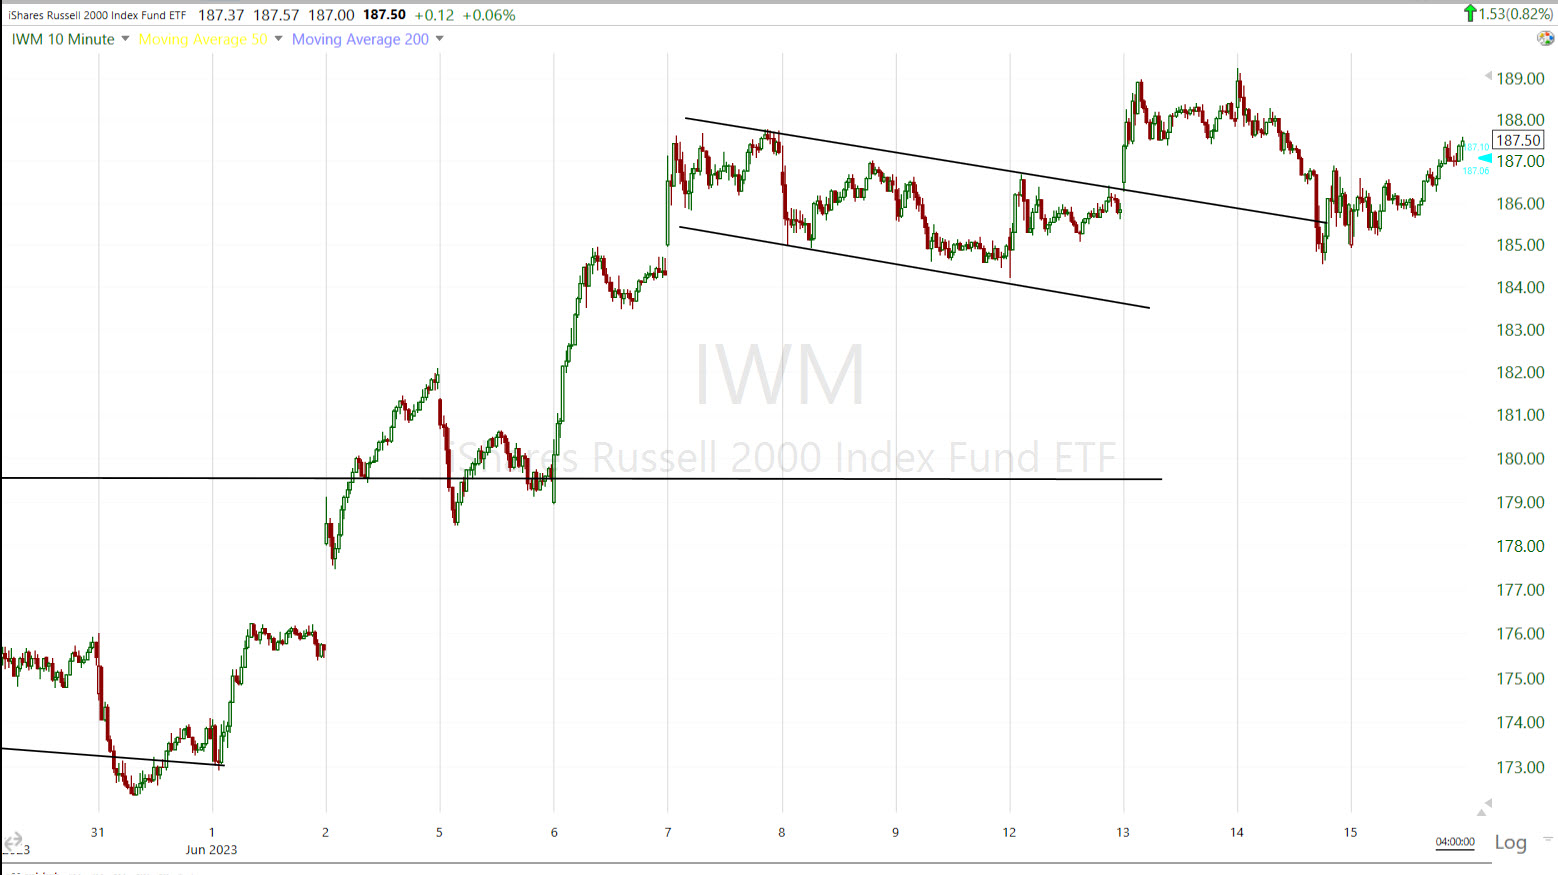 IWM (10m) – I’ve said numerous times that Small Caps aren’t going anywhere without the Regional Banks. IWM tried to breakout a bit early while the Regional Banks are still within bullish flag consolidations.
With the S&P above $4200, $4300 and closing above $4400 today, I’m seeing a consistent trend of short covering, or a Short Squeeze.
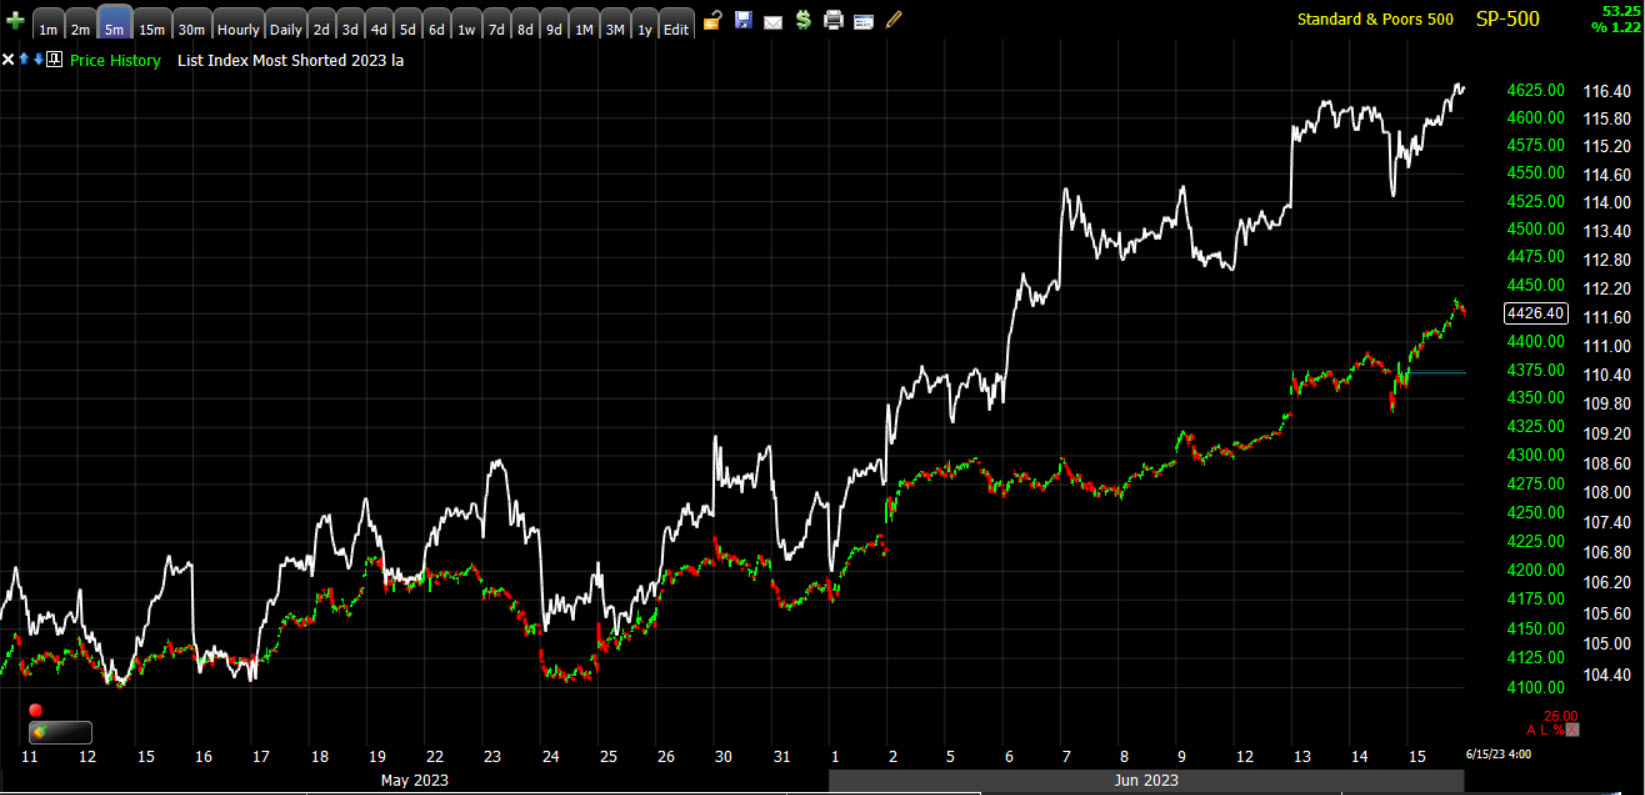 SP-500 (3m) and my Most Shorted Index (white).
I touched on Volatility’s relative strength in most of today’s posts. This post probably has some of the most interesting information as it relates to VIX. VIX ended with a +4.5% gain, and near session highs, much like the S&P. This positive correlation is not a good sign for the market, and if it goes on longer, the implications for the equity market will become more dire. VVIX also ended unusually green, up +2.2%.
The Absolute Breadth Index ended at 32 today which is a decent way off from a long volatility signal with a close below 14, but I have noticed over the years that often a sharp drop in the ABI, does lead to a sub-14 close and long volatility signal.
S&P sectors
Another sign of broad-based gains and risk sentiment, all 11 S&P sectors closed higher today. Just as was the case this morning, there really was no clear sector bias, just broad risk-on sentiment. There was no notable out or under performance either. I highlighted the sectors that closes up at least 1%.
The mega-cap index (MGK +1.35%) barely outperformed the S&P-500 Equal Weight Index (+1.15%).
The PHLX Semiconductor Index was an area of weakness with semis (SOX) falling -0.9% with nearly every component sporting a loss. Intel (INTC +0.7%), however, went against the grain after the company announced the release of its newest quantum research chip. I have an interesting 3C chart of NVDA below in the summary section.
Regional Banks (+1.9%) actually outperformed, but still haven’t broken out of their bull flag yet.
Materials ⇧ 0.85 %
Energy ⇧ 1.10 %
Financials ⇧ 1.32 %
Industrial ⇧ 1.51 %
Technology ⇧ 1.29 %
Consumer Staples ⇧ 1.00 %
Utilities ⇧ 1.09 %
Health Care ⇧ 1.55 %
Consumer Discretionary ⇧ 0.65 %
Real Estate ⇧ 0.43 %
Communications ⇧ 1.59 %
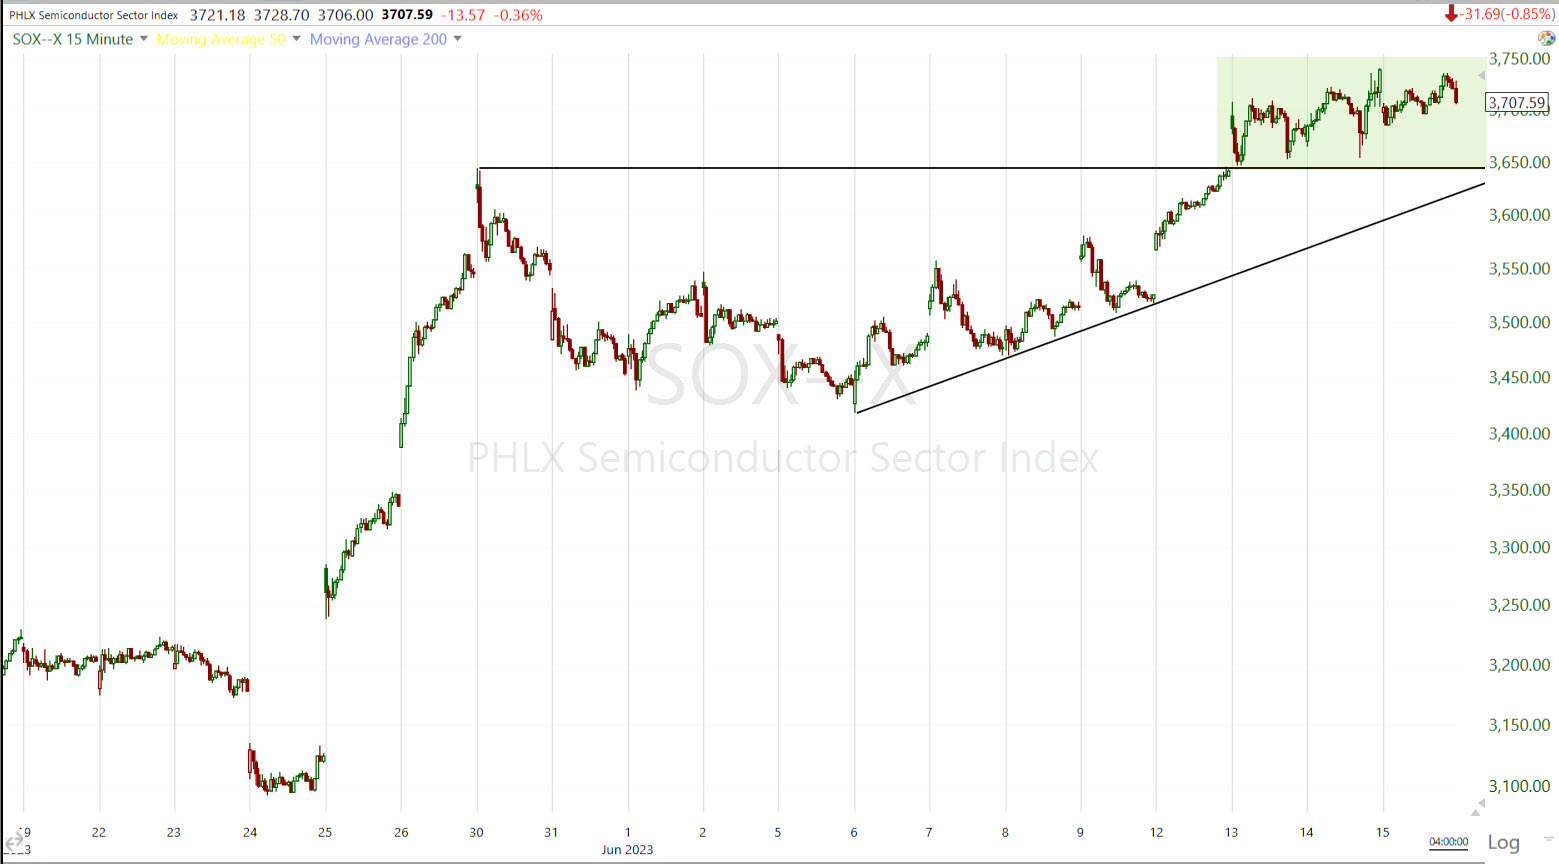 Semiconductors / SOX Index (15m) with a weak breakout from the bullish ascending triangle. This is one of the most dangerous times in a breakout. A solidly bullish breakout should be definitive on rising volume. Three days after breaking out, this is not definitive in any way.
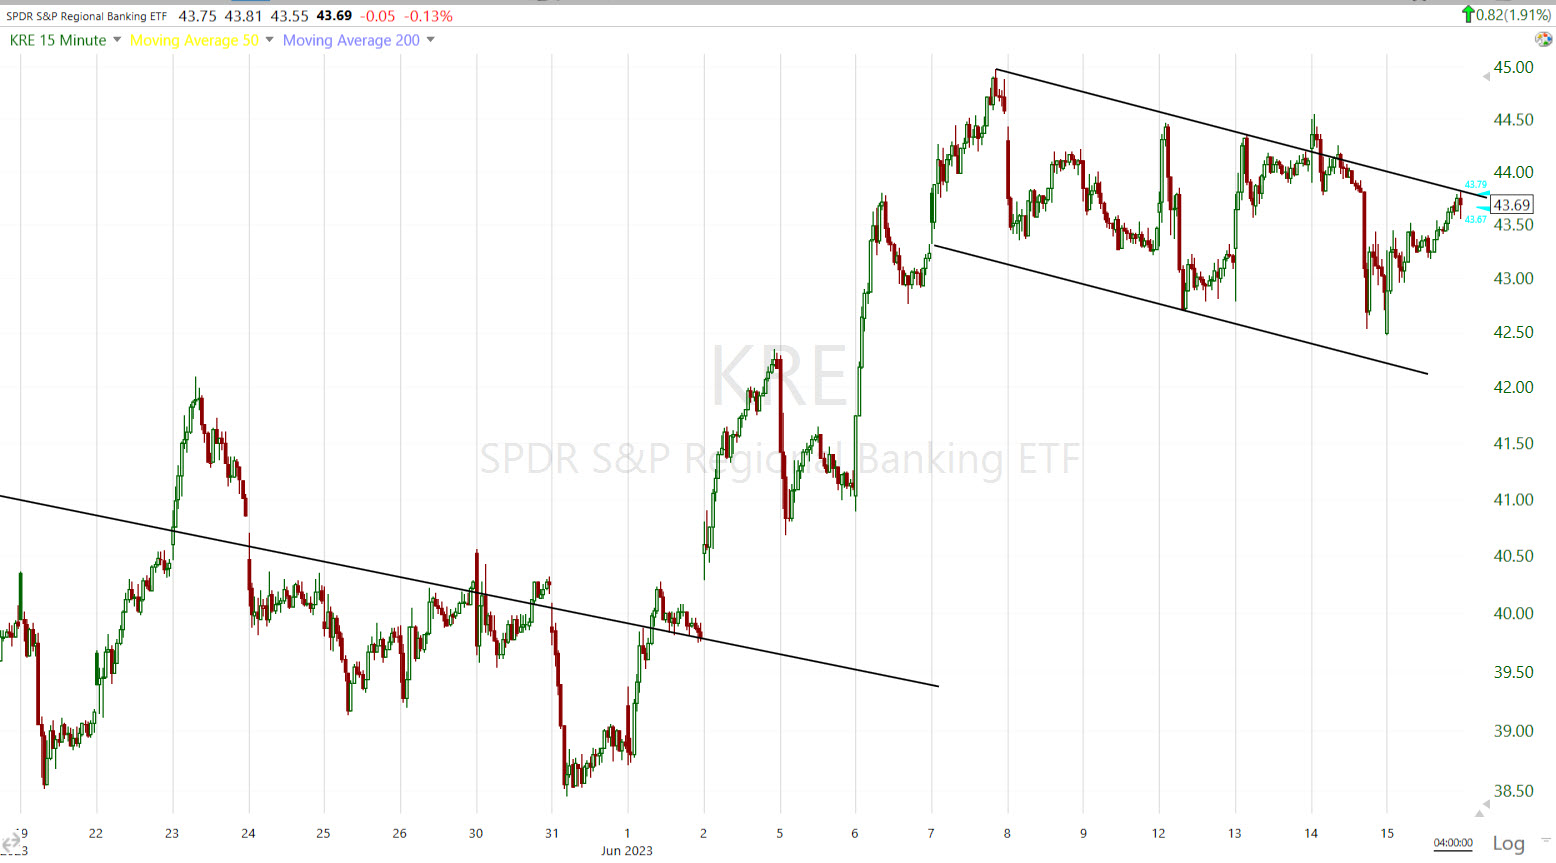 Regional Banks (15m) still looking good in the bull flag. As mentioned earlier, the volume pattern is completely wrong for a bullish consolidation, but there probably be some leeway given due to yesterday’s heavy FOMC volume.
Internals
NYAE Advancers (2135) outpaced Decliners (745) by better than a 2-to-1 ratio, and on pretty heavy volume again at 1 bn. shares.
On the day the NASDAQ-100’s advance/decline line looked the best, while the broader NYSE and NASDAQ Composite’s looked a bit worse, but these are just short term signals for the moment, and probably reflecting Small Caps’ early underperformance.
There was no truly Dominant price/volume relationship, but most of the major averages leaned toward Close Up/Volume Down, which is the weakest, most suspect p/v relationship and the 3rd component necessary for 1-day overbought internals. The relationship was not that clearly dominant.
Overall market breadth is now a liability, whereas up until February, it was one of those aspects of the market that was so strong, it was virtually impossible to expect the market to lose any meaningful ground.
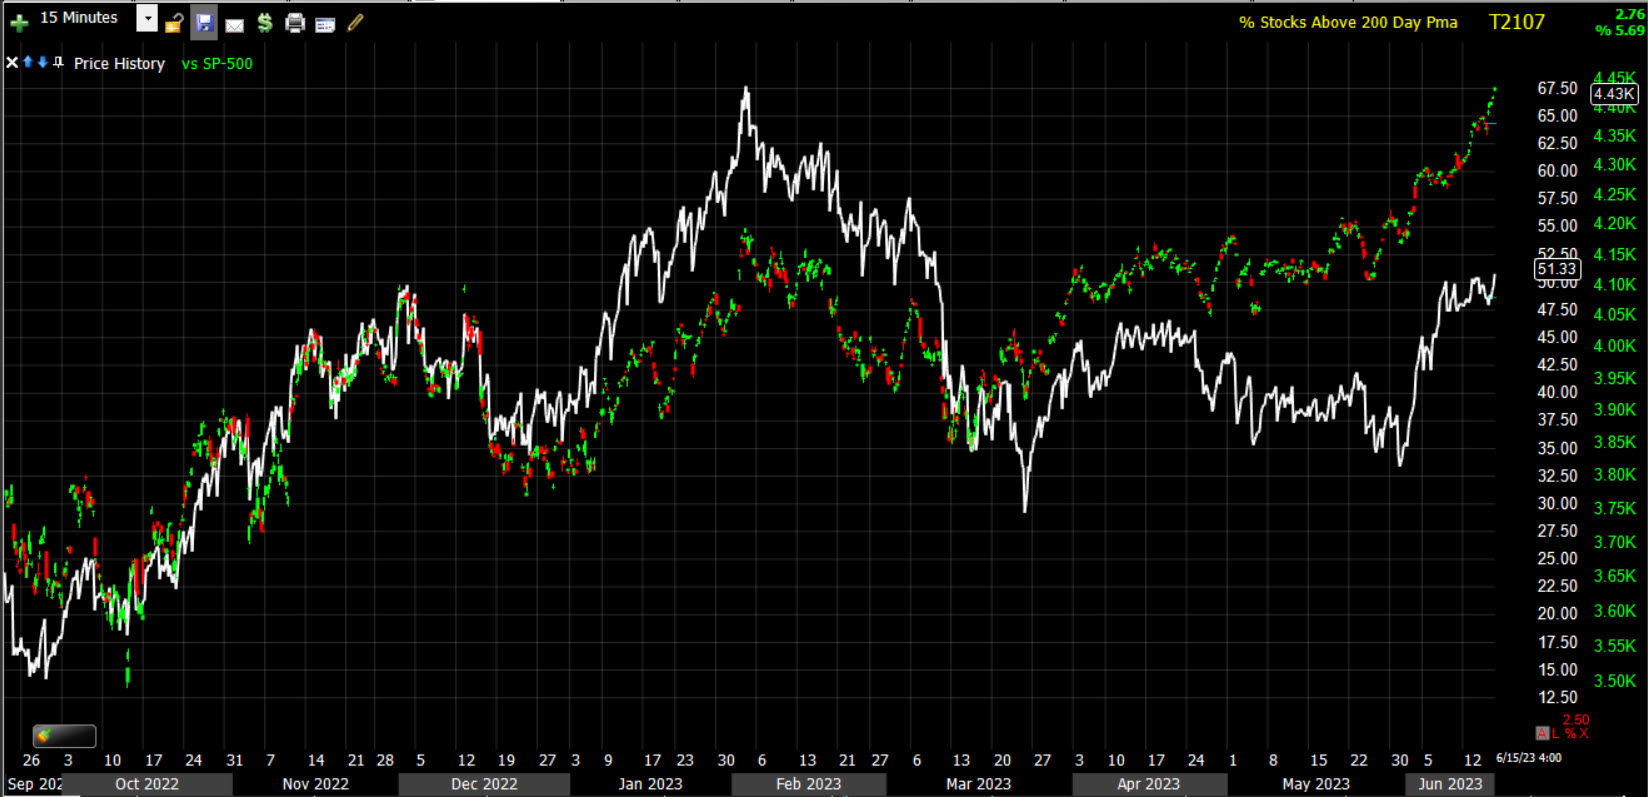 SP-500 (15m) and the Percentage of NYSE Stocks Trading Above their 200-Day SMA’s. There has been some slight improvement in June with Small Caps’ early strength, but overall market breadth is becoming more of a concern – especially with near parabolic advances in the major averages without taking the time to consolidate gains.
Treasuries
Treasuries settled with gains across the curve in response to this morning’s data, which is seen as a sign of confidence that the Fed is done raising rates. The 2-year yield was down six basis points to 4.64%. Just for perspective, the 2-year yield was up +6 bp when I wrote the A.M. update, The 10-year yield was down seven basis points to 3.73%. The drop in market rates was a big support factor for equities today.
I wasn’t very impressed with High yield Credit (HYG +0.5%), although it did improve a bit late this afternoon. Still, I don’t see the short term trigger to ignite the powder that’s present in a larger negative divgernece between credit ad the S&P.
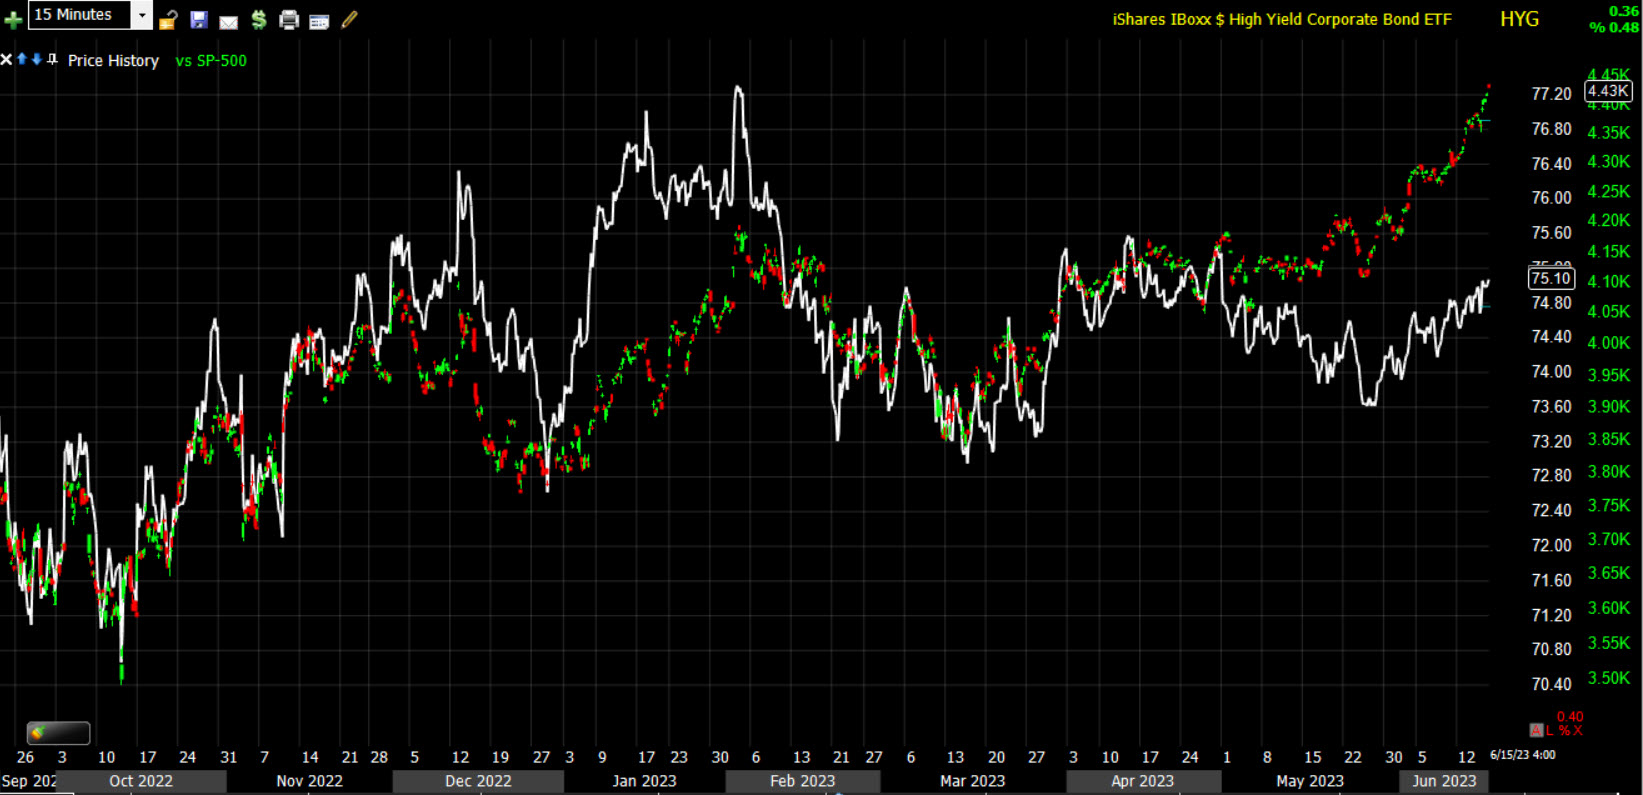 SP-500 (15m) and HYG (white). While there’s a clear big picture divergence in HYG not confirming S&P’s price trend, it will almost certainly take the short term relationship to negatively diverge as well as a sign of an imminent, or impending change in market trend.
Currencies and Commodities
The U.S. Dollar Index dropped by the most (-0.8%) since early February today.
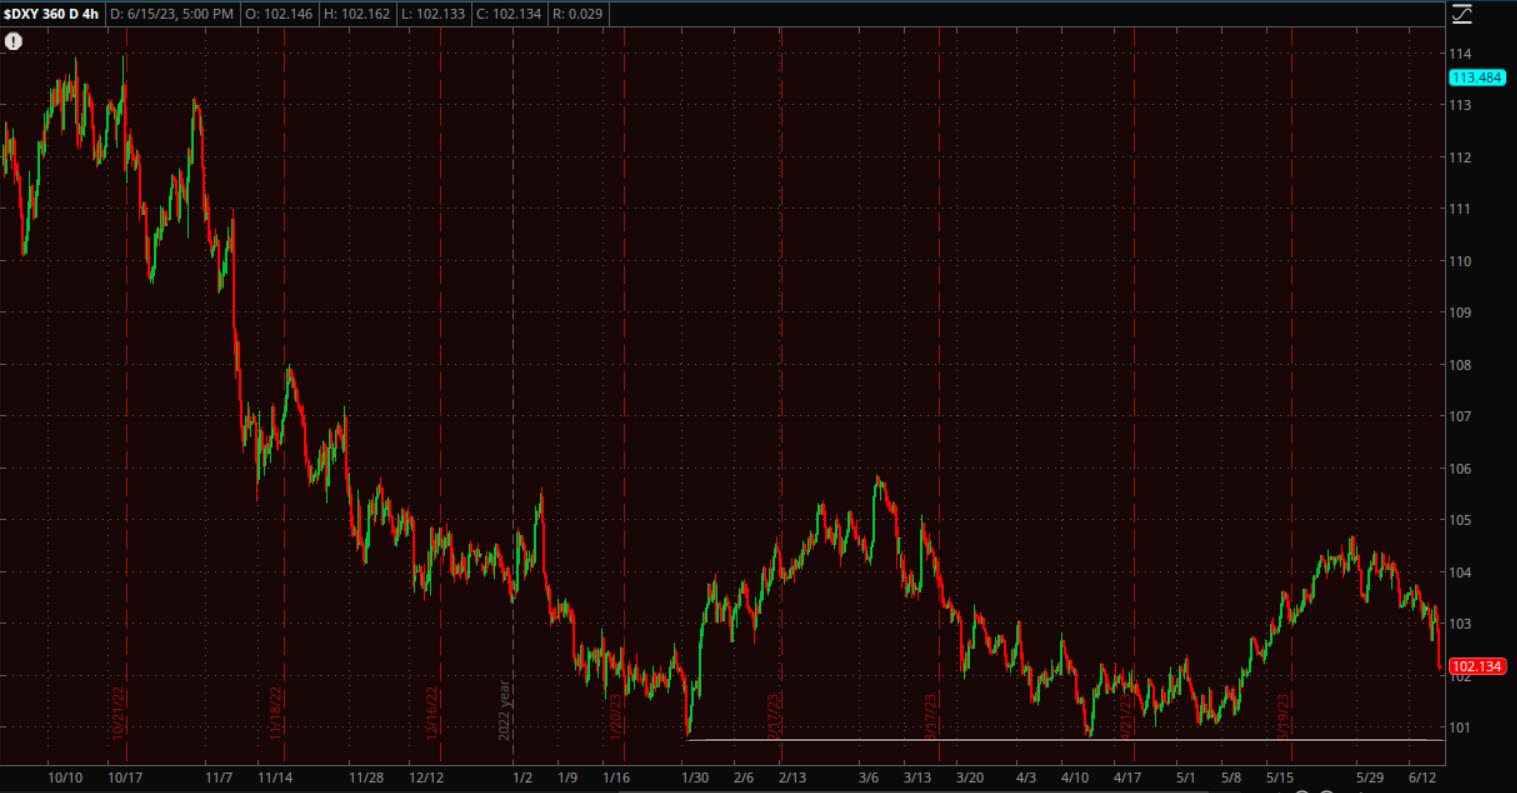 Dollar Index (4H)
WTI crude oil futures rose +3.6% to $70.69/bbl.
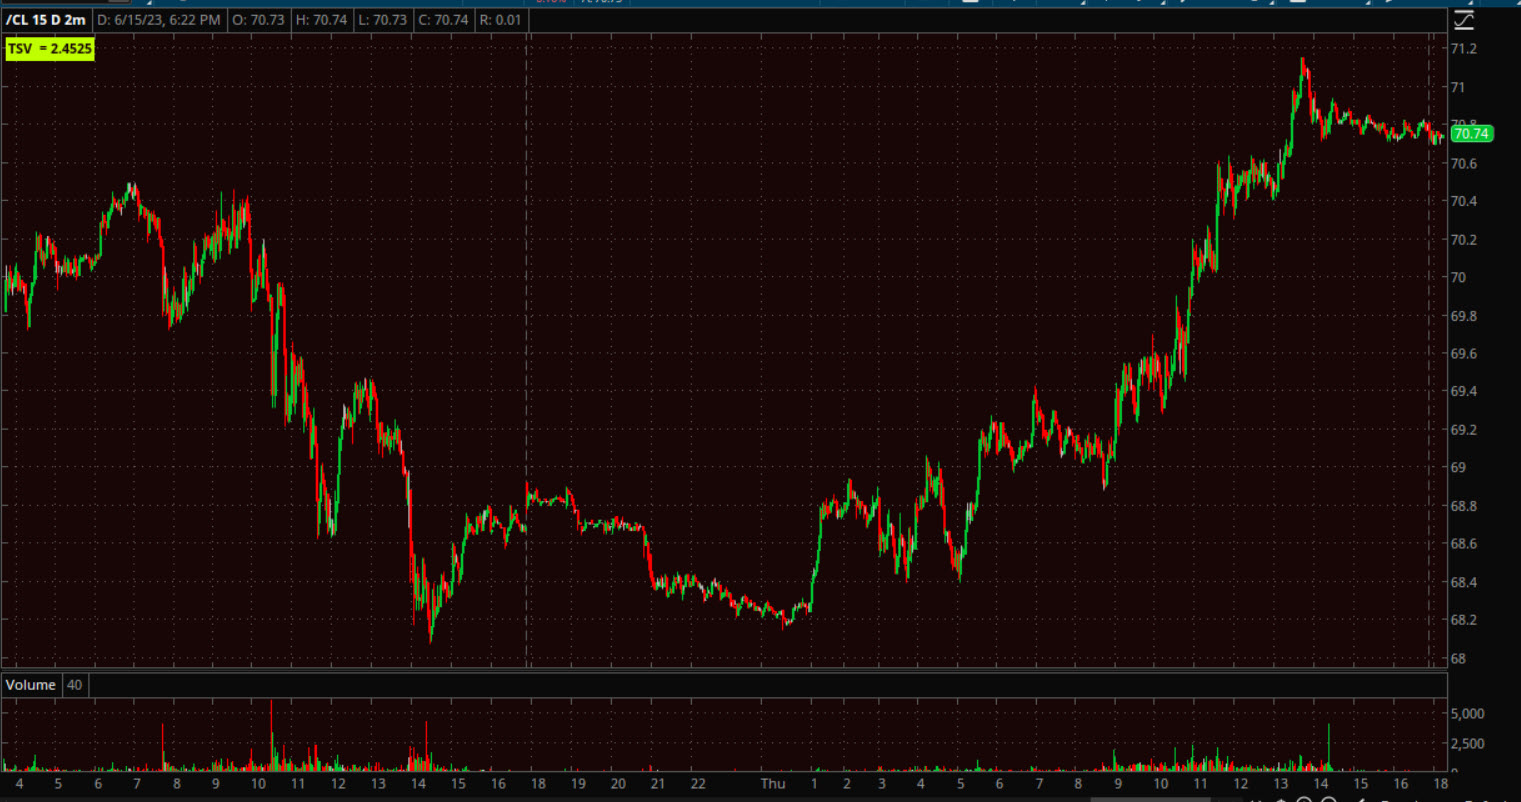 WTI Crude Oil Futures (2m) recouped all of yesterday’s losses after finding support at $68.
Gold futures gained +0.1% to $1,970.70/oz, climbing out of overnight losses as the dollar and bond yields got smacked after a batch of economic data out this morning. Ultimately gold retraced all of yesterday’s post FOMC losses.
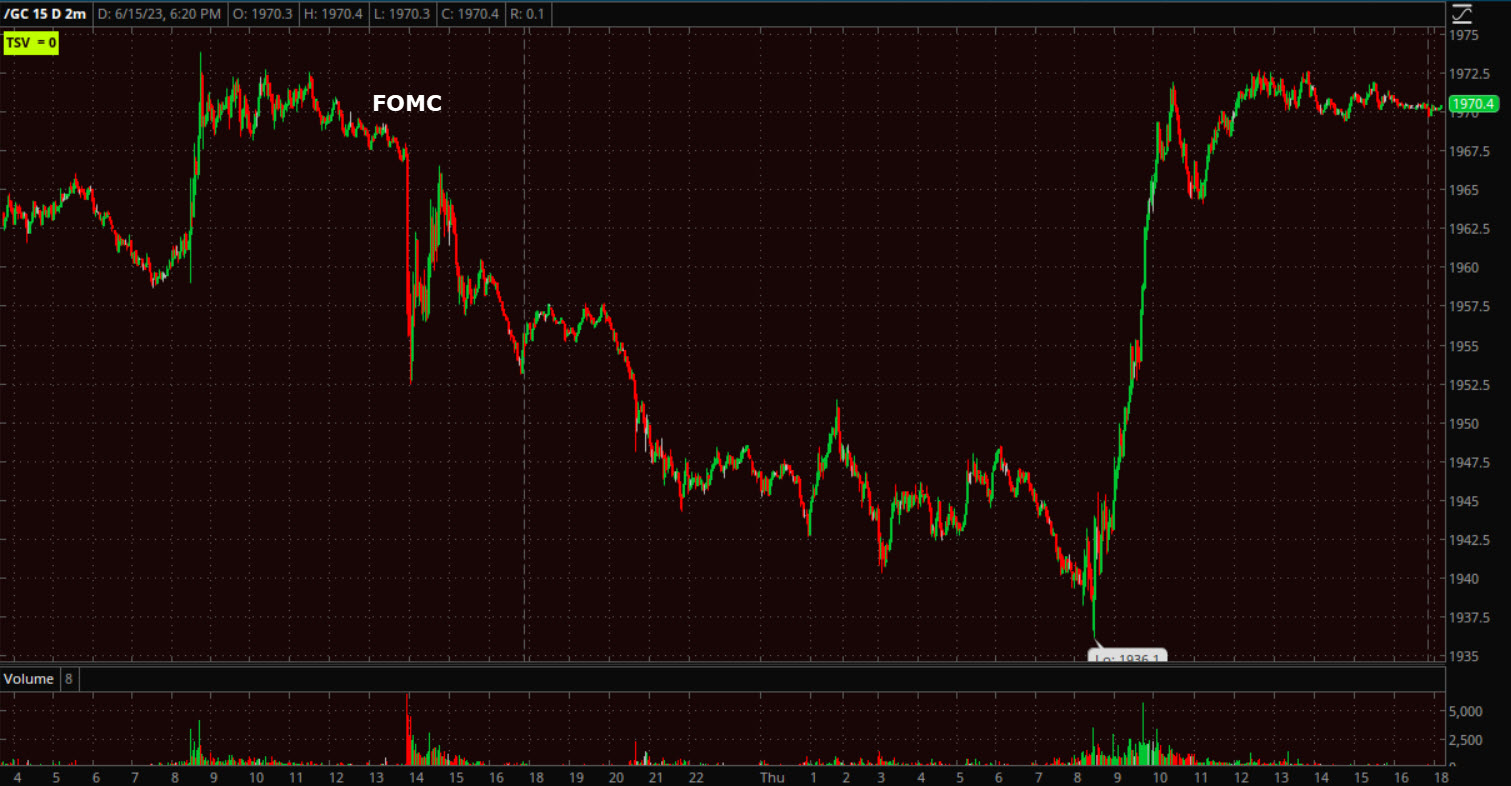 Gold futures (2m) retracing all post FOMC losses.
Summary
The chase is on (short covering, performance catch-up, FOMO, etc) all sparked by the S&P closing above levels like $200, $4300, and now $4400; and of course the Fed Pause. This is how dumb money gets sucked into a rally that many f them have hated for 7 months. This also gives institutional money the opportunity to sell into higher price.
I still think that it could take the rest of this month for smart money to unload positions, but what’s more important right now is gathering evidence of a systematic trend of distribution, not just a few charts here and there. We’ll almost certainly get other corroborating signals as well, such as that which we are starting to see in Volatility/VIX now.
First I want to start with the notable transition in S&P and NASDAQ’s 3c charts coming into January. I’m about to lose the ability to scale the charts. As much intraday data as Stockfinder gives you, it’s not unlimited, so I want to get them out there 1 more time.
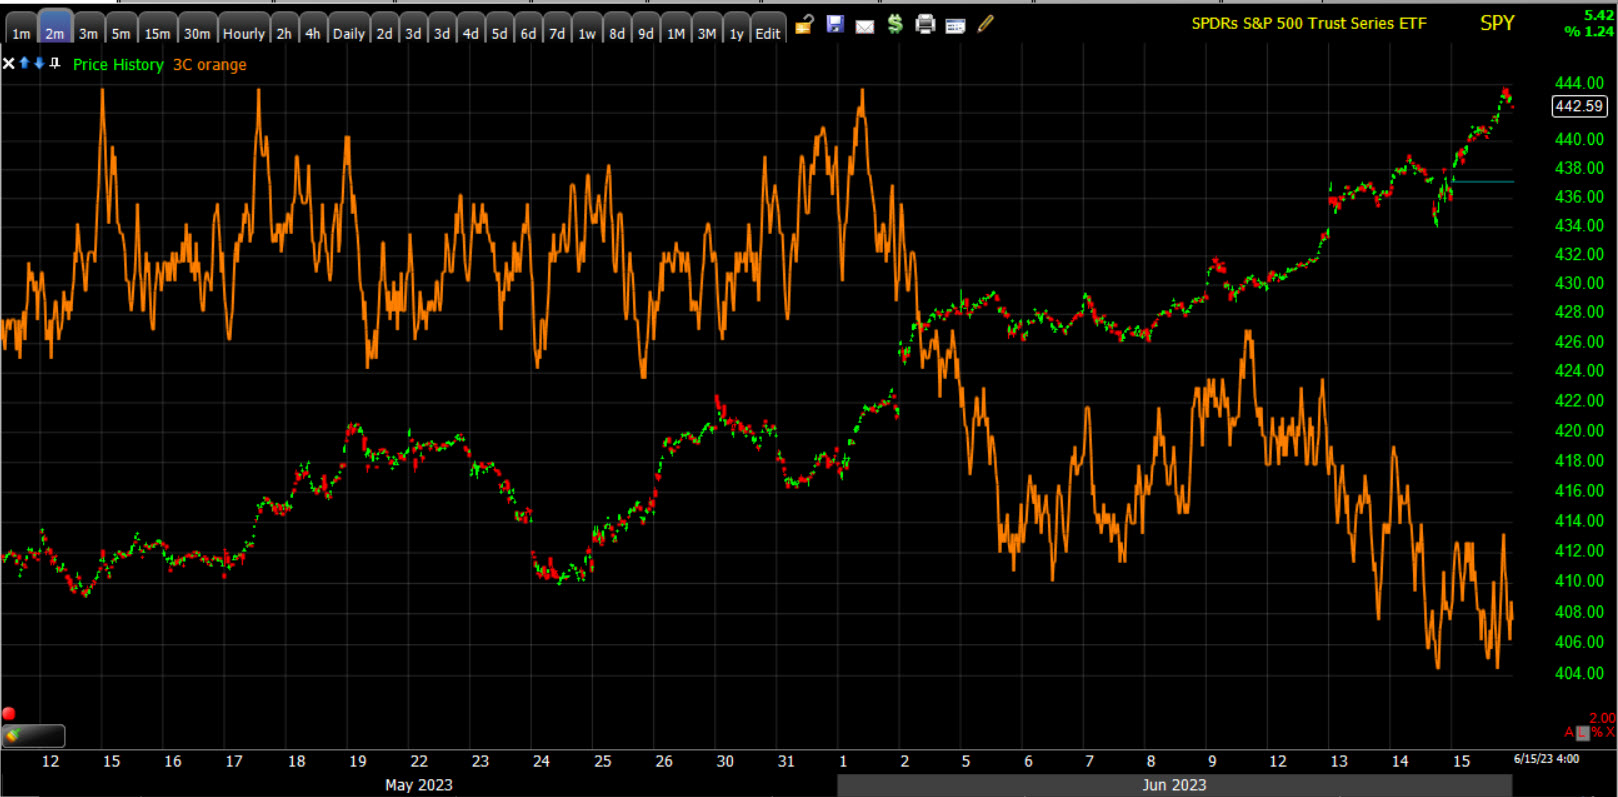 SPY (2m) with 3C going from confirming and leading price higher up until the end of May, to a drastic shift in tone into June. NASDAQ/QQQ is similar, while Small Caps (and the Dow to a lesser degree)did the exact opposite and went from weak 3C tone until the end of May, then much better 3C charts into June.
In terms of the short term trends, which now need to confirm the longer, some areas like the Dow/DIA are showing clear negative divergences.
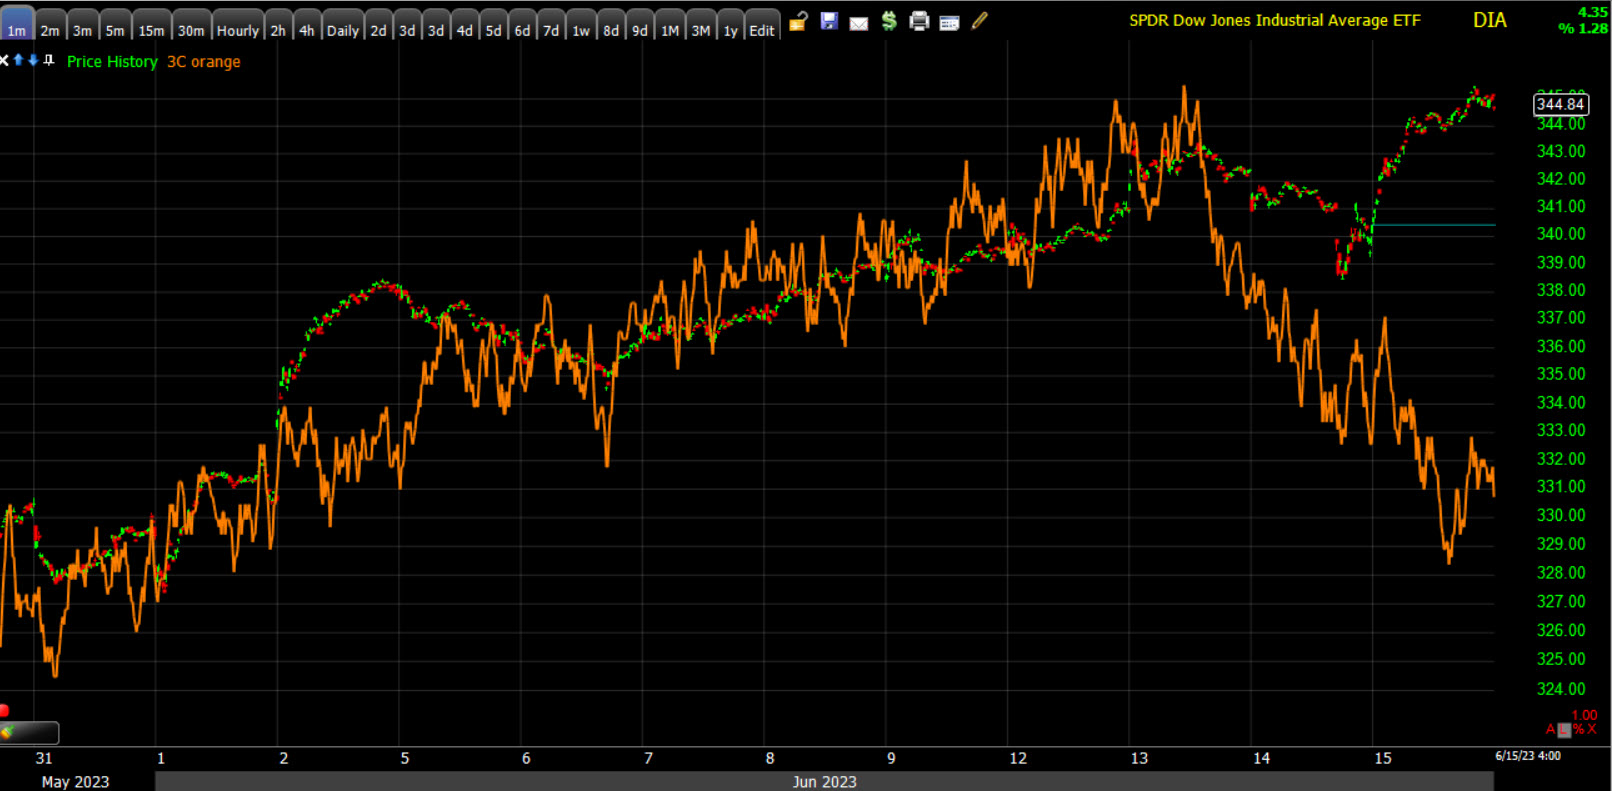 DIA (1m) with near perfect 3C confirmation of June gains, until very recently.
As for influential stocks, I’ve mentioned Apple a few times.
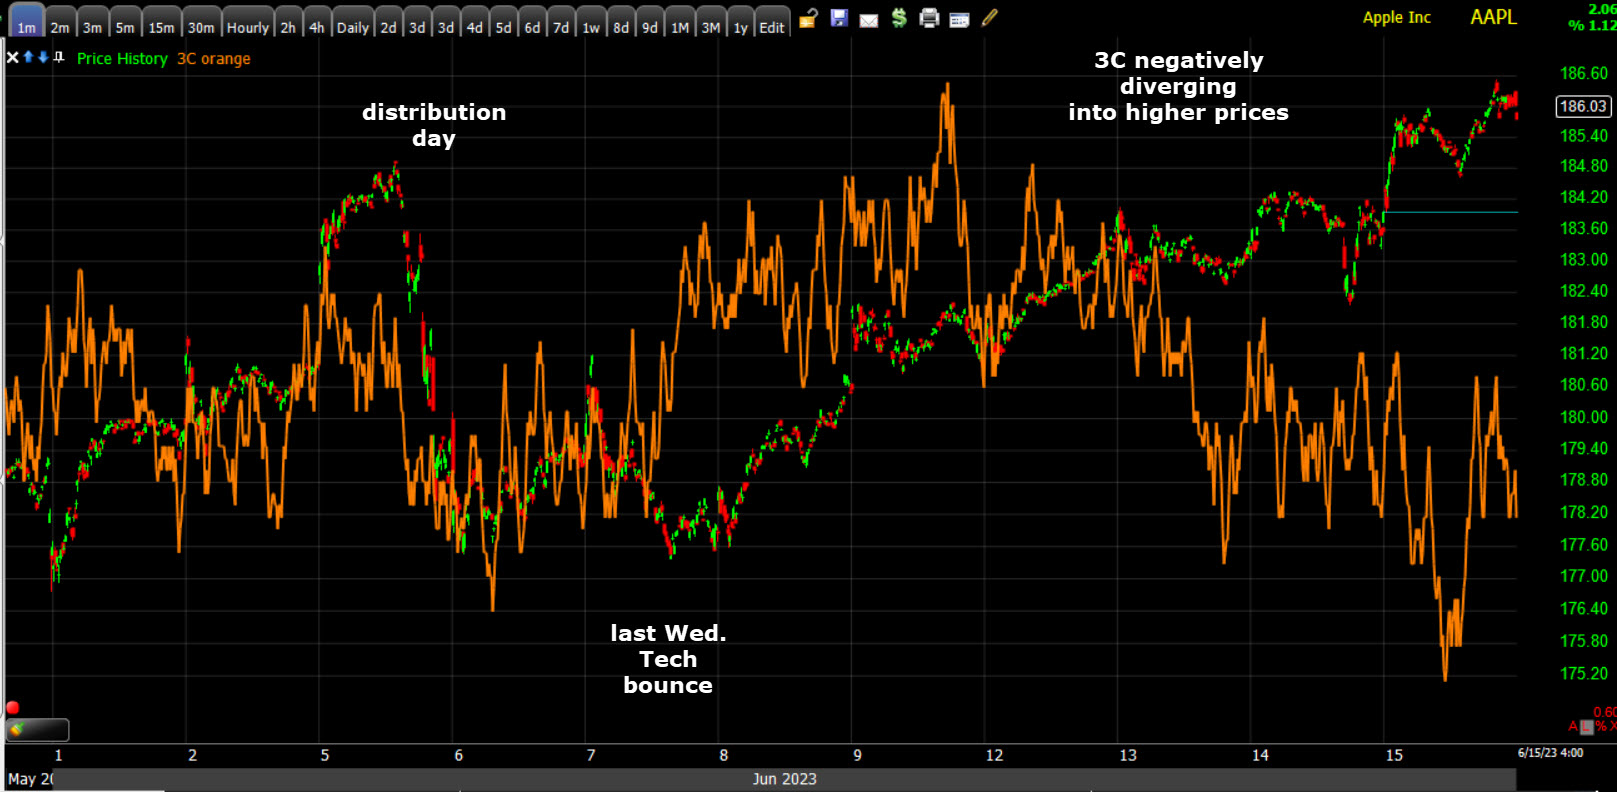 AAPL (1m) with 3C showing a great example of selling into price strength shortly after last week’s Tech bounce got off the ground.
After a massive 14 consecutive day rally on heavy volume, Tesla (TSLA -0.35%) which gained over 40% over that period, is showing recent weakness on 3C charts.
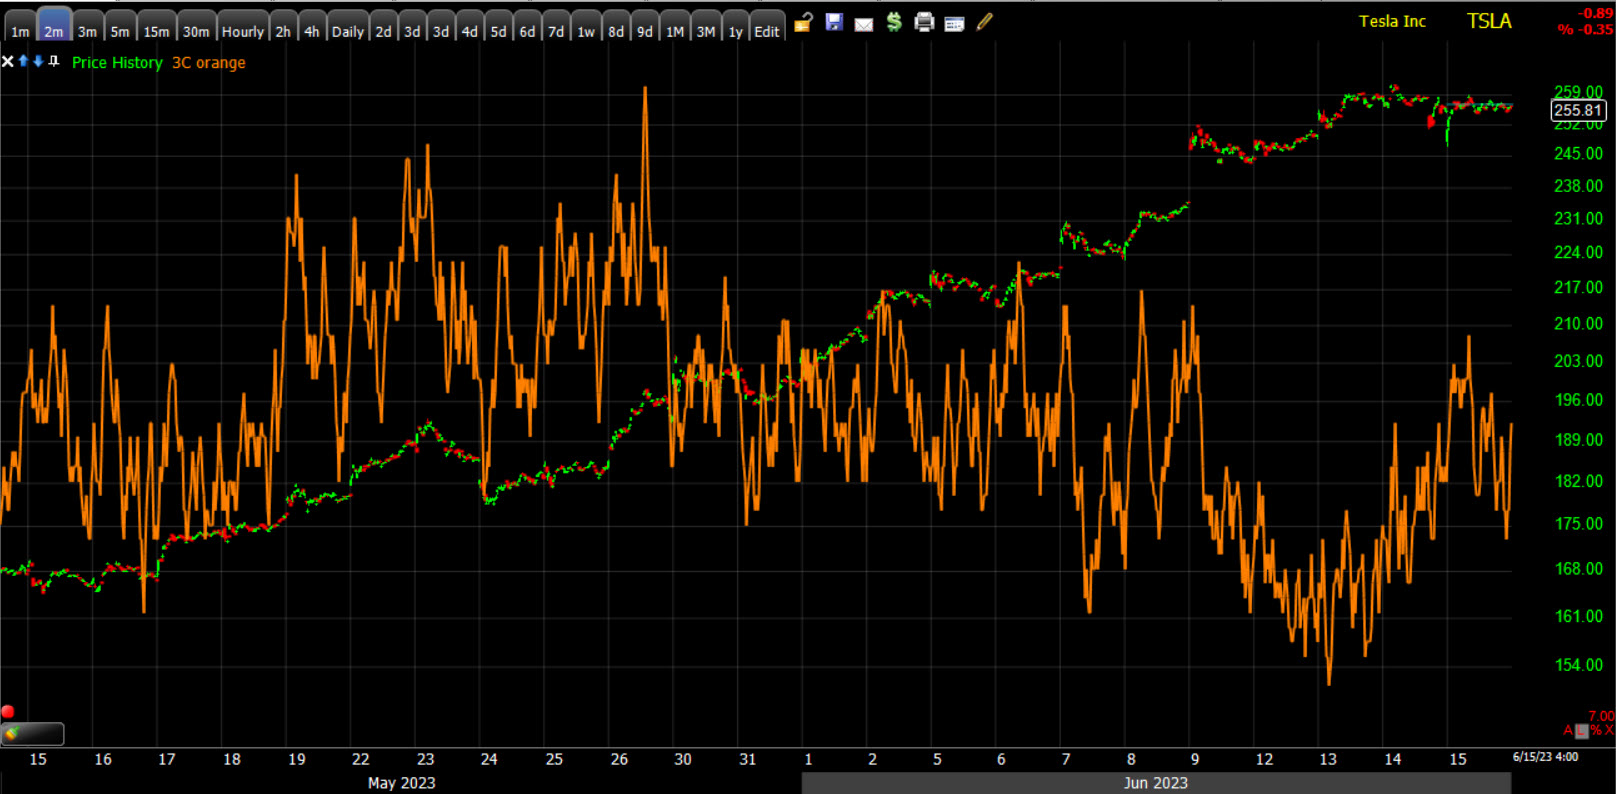 TSLA (2m) with the more sensitive 3C timeframe negatively diverging into June 1st, like most of the mega-caps.
And cleaning up some of the noise and looking at a longer term trend chart, we get the same…
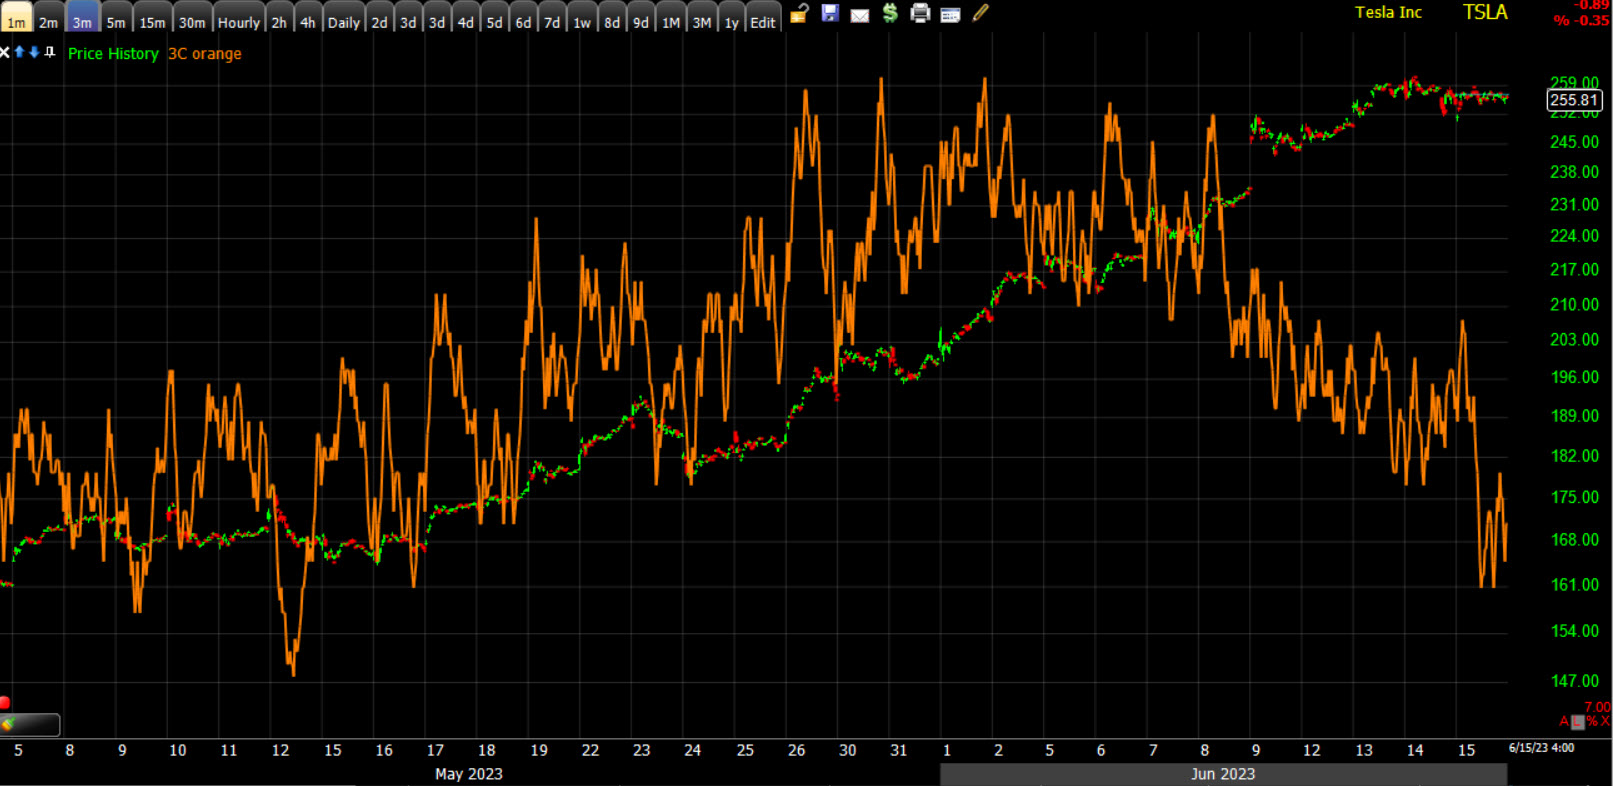 TSLA (3m)
I can’t say for sure whether this is sellers taking profits and exiting the trade, or its a part of a distribution trend, but based on the next chart, my instinct is that it’s the latter. Since the weaker 3C tone started into June, I suspect at least part of it is the weaker tone among mega-caps coming into June. We just have to keep watching. 3C stands for , “Compare, Compare, Compare” so when there’s a clear trend among a majority of important stocks, sectors and averages, it will be VERY obvious.
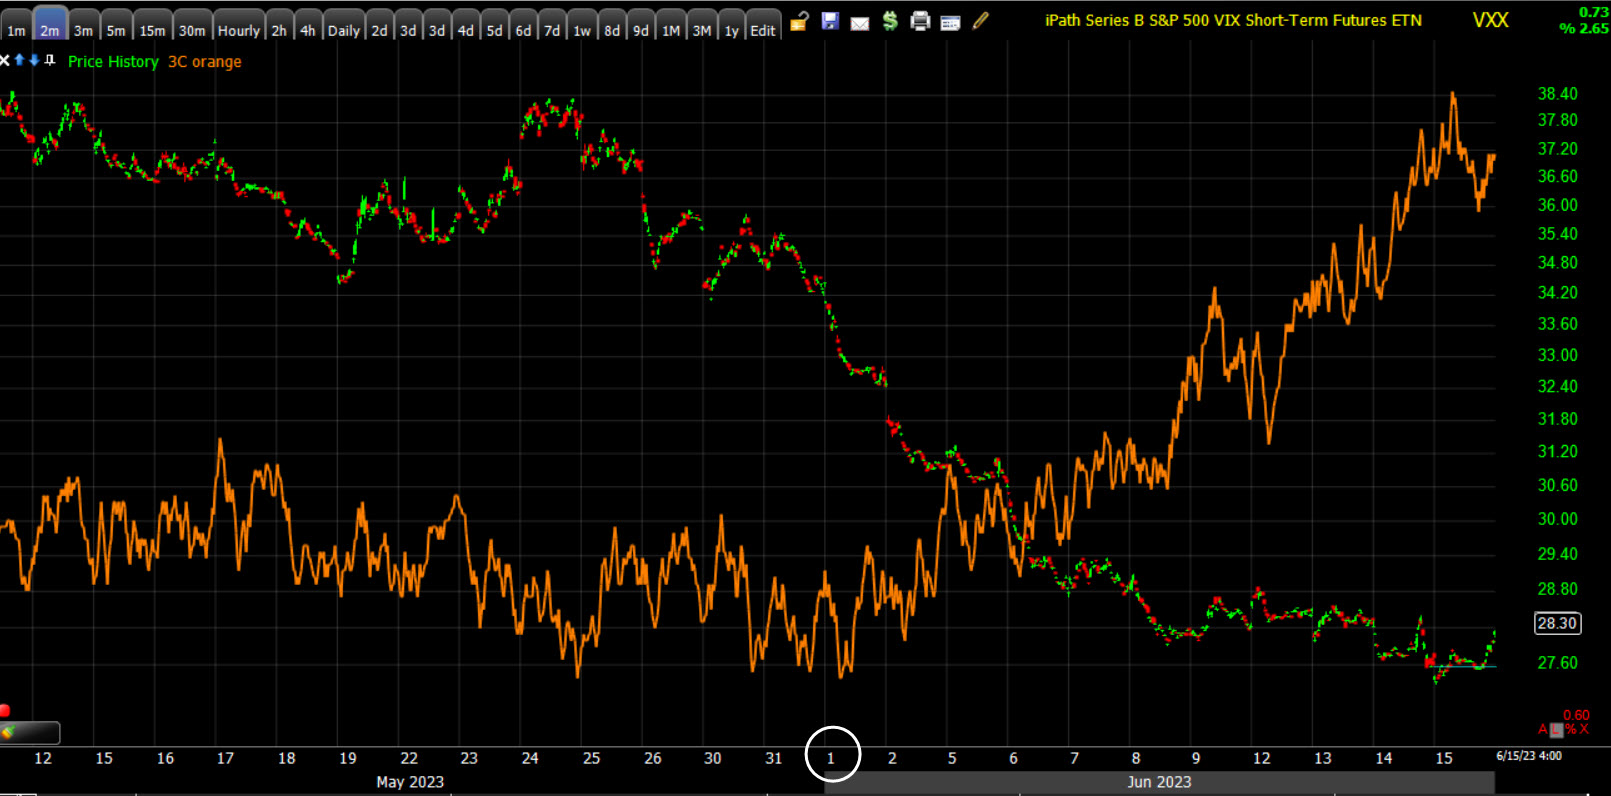 VXX (1m) notice where 3C starts to really turn up .. right at June 3rd. So my guess is that rather than a rotation to small caps like we’ve seen in the Dow and NASDAQ-100, this is something more serious and small Caps are just some late-stage rally bargain hunting.
Another key stock, since it’s been the posterchild for the “AI” craze, is Nvidia (NVDA -0.8%).
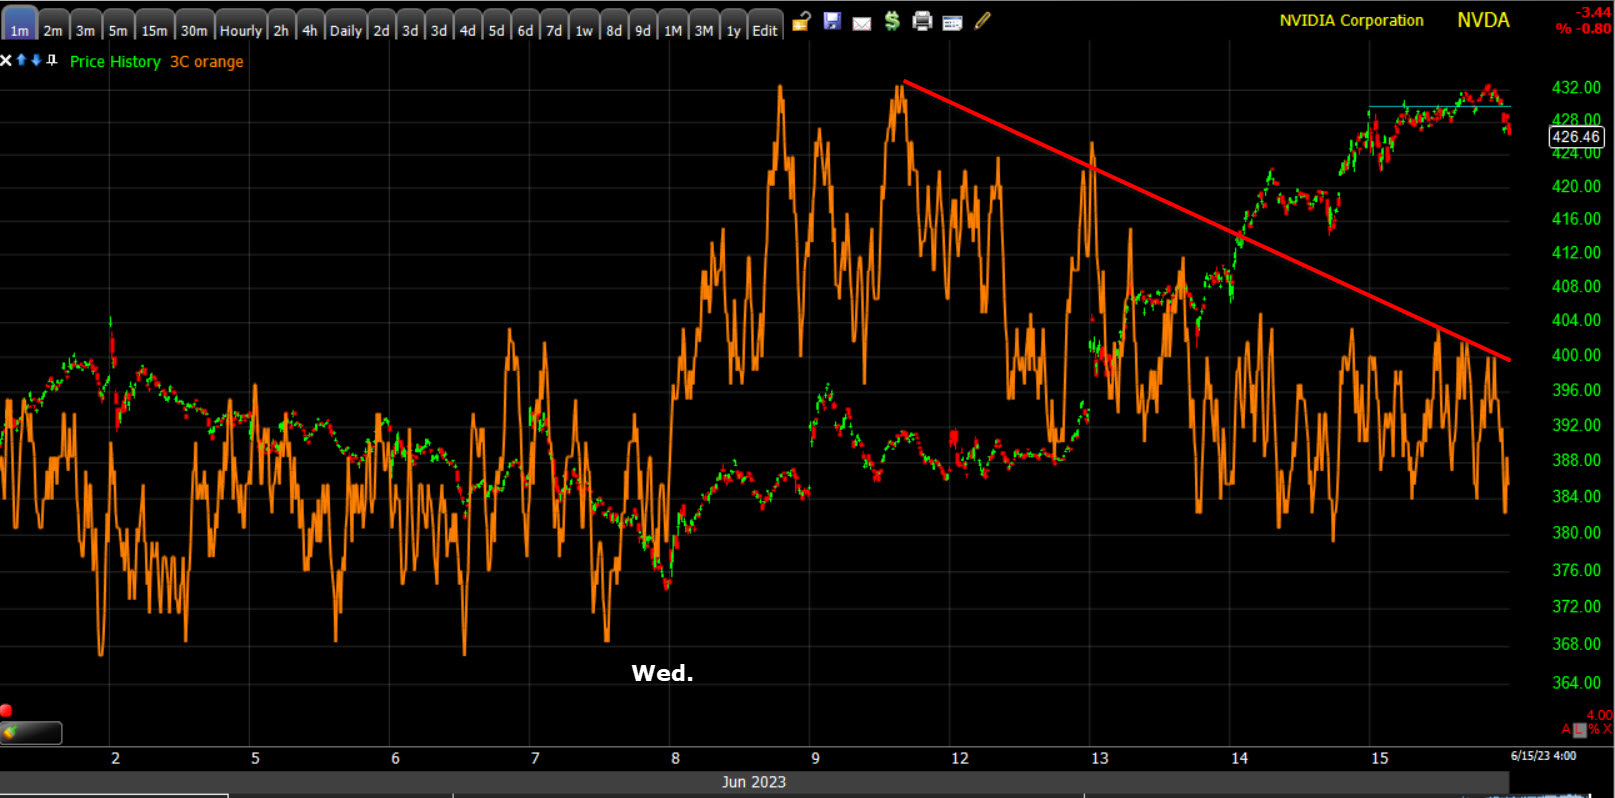 NVDA (1m) short term 3C trend shows the same positive tone change last Wednesday afternoon pointed out in Wednesday’s (June 7th) Afternoon Update, and recent weakness in 3C (like Apple) as there’s strong opportunity to sell into price gains.
Here’s a broader 3C trend of NVDA…
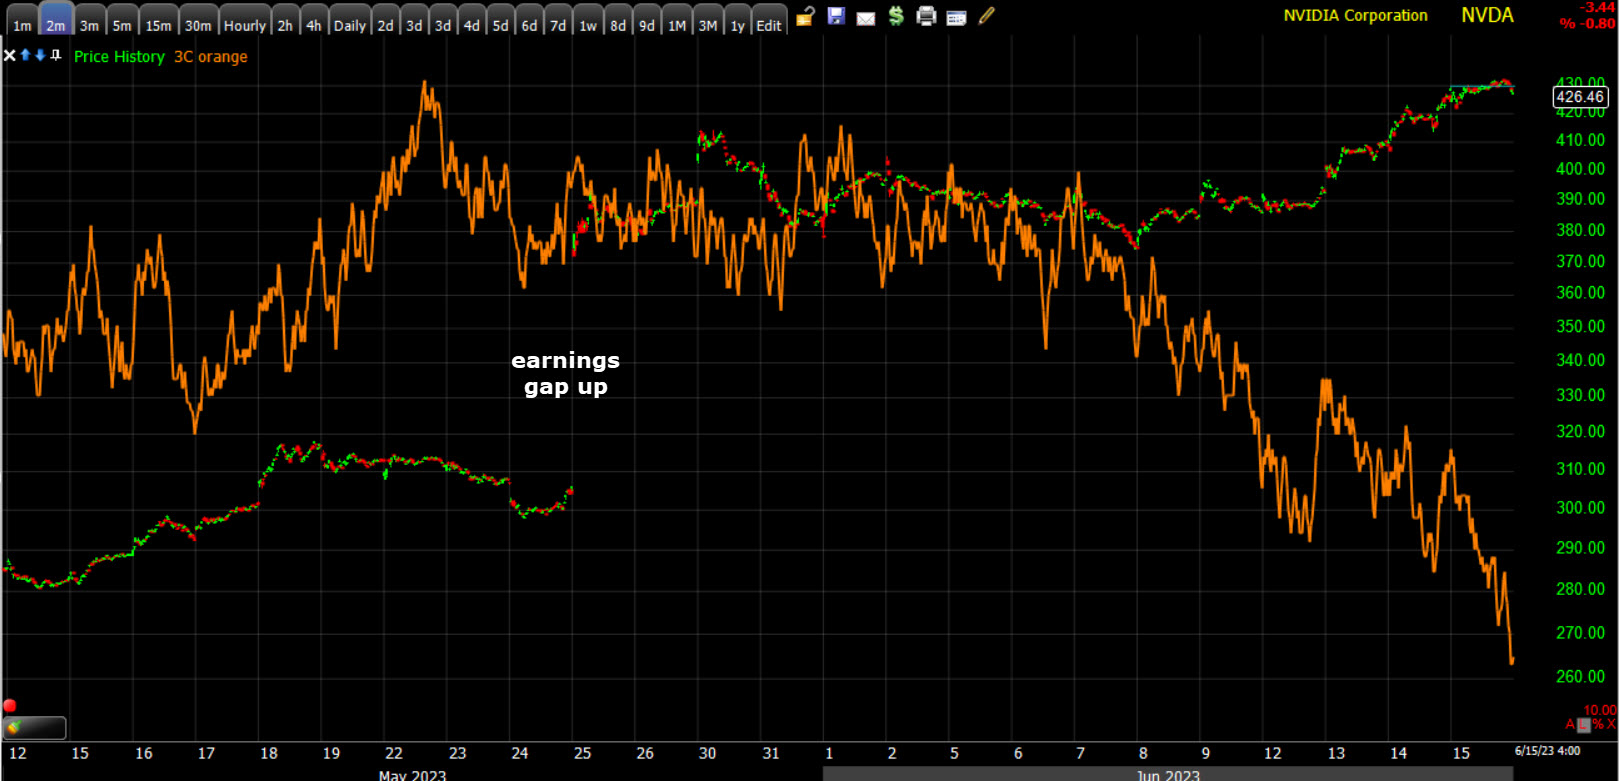 NVDA (3m) since the earnings gap up, 3C moved similar to price (confirmation), but the last week or so has seen a VERY clear 3C negative divergence that’s now a leading negative divergence (the strongest kind of divergence). Still, the longer they can keep prices up and supported, the worse these divergences should become, and migrate to longer, stronger 3C timeframes.
I’ve tried to be very careful about what distribution looks like… that it’s not an event, but a process. If my timing on Phase II transition is correct, then we should have about 2 more weeks to gather evidence of a trend of distribution. I expected to see it in the mega-cap stocks first (as we are above) due to their large cap status, how many funds hold them as core positions, and the fact that they’re having to unwind an 8 month rally, or in Tech’s case, at least a 5 month rally. That doesn’t happen overnight, but I do believe we have all the pieces now in place and I do think a trend of distribution and transition to Phase II is VERY likely and relatively close in terms of timing.
Overnight
S&P futures, and most index futures, are down just -0.1%. 3C charts are pretty solid into the early overnight session, so I suspect that support has something to do with the max-pain op-ex price pin (the level at which the greatest dollar amount of options expire worthless as smart money usually sells the options, while retail or dumb money buys them – the majority of options purchased expire worthless) heading into tomorrow’s Quad-witching options expiration. If I had to guess, I’d guess the max-pain level is S&P $4400.
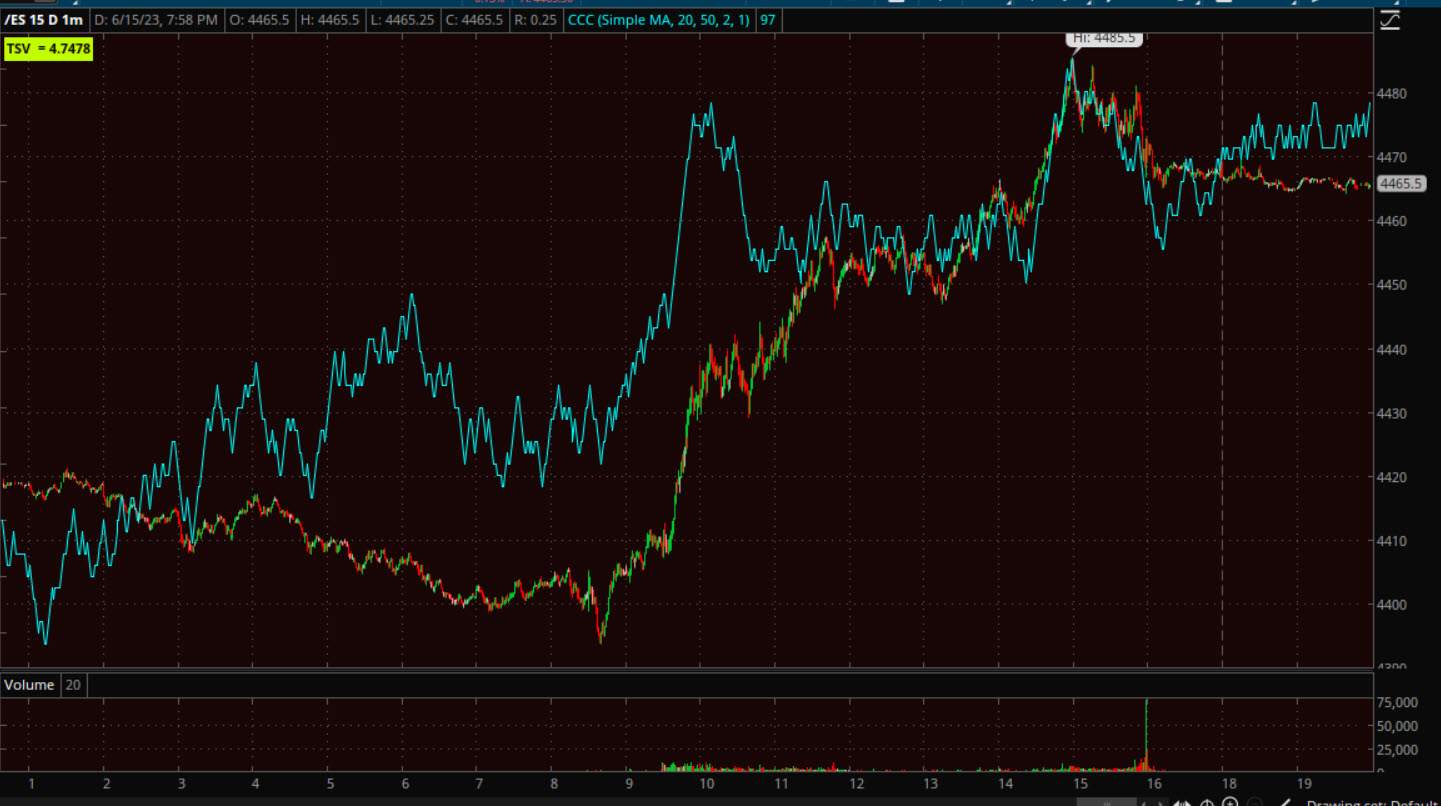 ES (1m)
The U.S. Dollar Index is unchanged.
WTI Crude Oil futures are down -0.1% and in a consolidation of the day’s gains.
Gold futures are unchanged as well and in a consolidation of the morning gains.
Bitcoin futures are up just +0.35%.
Two and 10-year Yields are a half of a basis point on either side of unchanged.
Economic data tomorrow is limited to the preliminary University of Michigan Consumer Sentiment Survey for June (prior 59.2) at 10:00 a.m. ET.