Today saw follow-through buying of a broad-based nature. Some decent earnings results out of the Industrial sector and the Consumer Discretionary sector helped set the tone this morning.
Also, soft Services and Manufacturing survey data (PMI) that lowered market rates didn’t hurt either. Manufacturing PMI slipped back into contraction and Services PMI were weaker than expected. Bad economic news was good news for the market. This gives the market some slight glimmer of hope that the soft data may sway the Fed to cut rates sooner and more than previously priced in, although very modestly. It should, however, be noted that within the Services PMI prices are rising. The PMI data gave rate cut expectations a small boost with the market pricing in 45 basis points of rate cuts for full-year 2024, off last week’s low of 38 basis points of rate cuts (less than 2 rate cuts for FY2024).
The main factors driving the bounce are CTA’s done selling (for now); the oversold market conditions from last week; while inflationary commodities, rates and a U.S. Dollar that reflect inflation are all in consolidation and out of the market’s immediate line of sight and concern.
Like yesterday the early bid in stocks got some support when the 2-yr yield tested and backed down from 5.00%. Both Small-Cap stocks and Mega-Cap stocks participated in the rebound. Russell 2000 futures were lagging behind the other major averages in pre-market until the 9:45 a.m. ET PMI data sent yields lower and Small Caps higher. The Russell 2000 jumped 1.8% while the Vanguard Mega-Cap Growth ETF (MGK) gained 1.7%.
A stronger-than-expected New Home Sales Report for March at 10:00 a.m. ET didn’t change the Treasury market’s trajectory, which garnered some additional support at 1:00 p.m. ET from a $69 billion 2-yr note auction that was met with strong demand.
Averages
Like yesterday, both large-cap Tech heavy NASDAQ-100 and Small Cap Russell 2000 outperformed, while the Dow was the laggard for a second day. The major indices closed near their best levels of the day.
S&P-500 ⇧ 1.20 %
NASDAQ ⇧ 1.51 %
DOW JONES ⇧ 0.69 %
RUSSELL 2000 ⇧ 1.79 %
In the short-term I’m leaning tactically bullish, but I do have reservations with such important earnings this week. Intermediate-term I’m obviously leaning bearish. Long-term or primary trend I’m a little less certain about how things develop, but I’m also leaning bearish. If the short-term oversold bounce fleshes out clear topping patterns, that may firm up my longer term or primary trend view. The primary trend view is more about visibility and forecasting at this point.
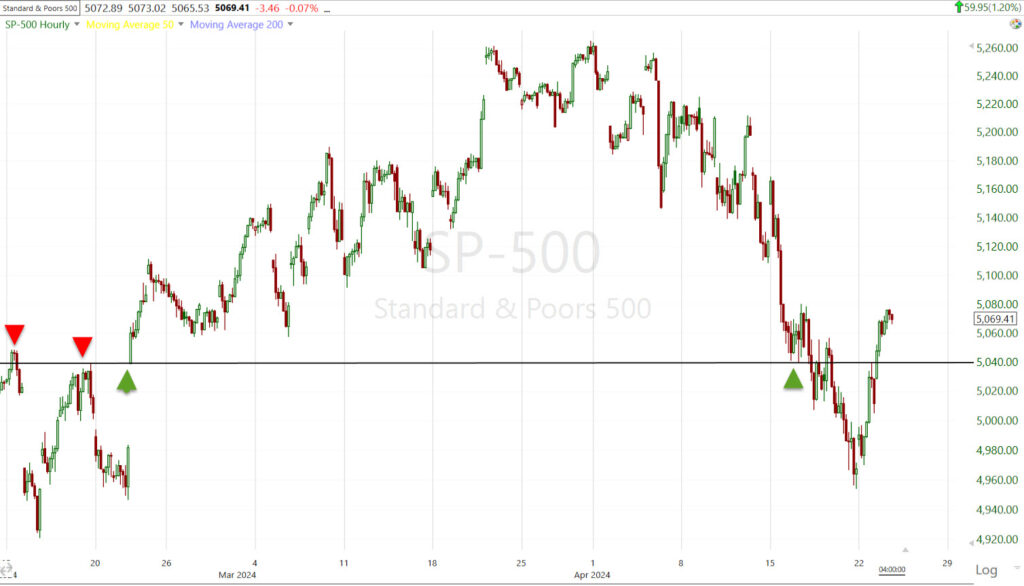
The S&P’s $5,000 level is clearly a big psychological level. The evidence of that is the wall of puts at $5,000, which is why price climbing above this week was a bullish tactical achievement, but recall the $5040 level I was very interested in early last week. Here’s why…
SPX (60m) – The rule of thumb is, “former resistance, once broken, turns into support” and vice-versa.
Because of the uncertainty ahead with the SuperBowl of earnings this week and some important inflation data, I’d prefer to have the strongest set-up possible before getting tactically long in any type of size.
Picking up on the idea of a pull back to make a higher low and better confirm the break of the short-term downtrend (which I’d say is broken) and offer a better risk/reward profile, I’d like to see a set-up something like this…
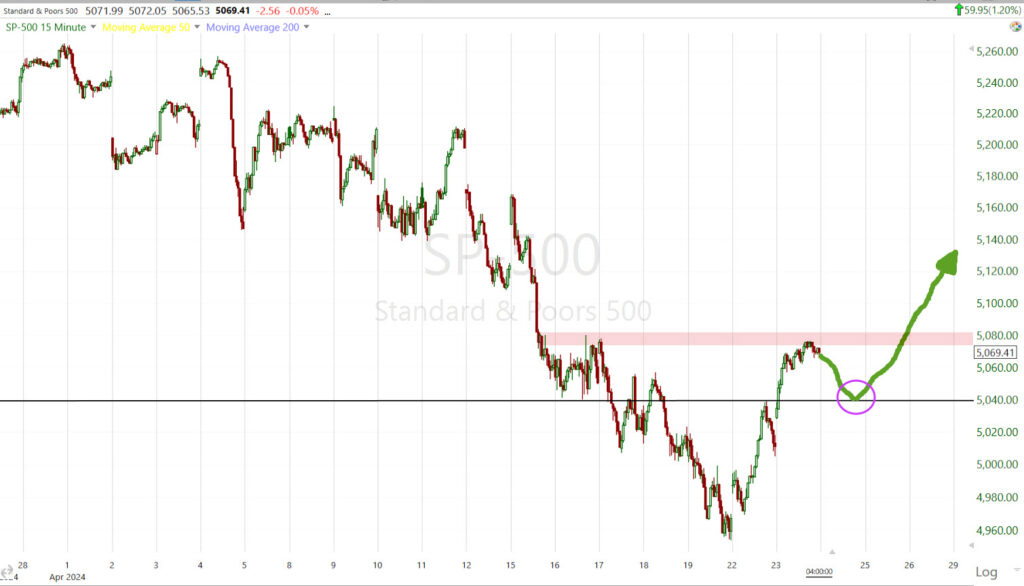 SPX (15m) – a pull back (and it doesn’t have to happen tomorrow) not only gives us a higher low to go with the higher high and define the start of a short-term up-trend, but it also gives something similar to a small inverse H&S base, which can also give us a measured move upside target. Then it’s easier to asses the risk/reward profile and the probabilities of a short-term tactical long posture go way up. $5040 makes sense, but with Tesla’s earnings tonight we may not see that tomorrow. The exact price level isn’t the key factor, the higher low in price is the key factor. That can happen at a higher level than $5040, or a lower level, just as long as it’s not below $4953.56 (Friday’s low). It can happen in another average other than the S&P too.
I think the more important and profitable trade is ultimately going to be a short trade (or longer term position) after a decent bounce, as long as that decent bounce is to a lower high (no higher than approx. SPX $5254). I suspect that will also flesh out a top pattern and give us targets, timing and higher probabilities/more certainty for the position. It doesn’t have to take the shape of a H&S. There’s a concept I call “The Whimper Rally” which I’ve seen over and over again from the 1929’s crash, 1987’s crash, 2007/2008 into the Financial Crisis, 2018’s -20% SPX decline and more in other assets/stocks. If this bounce is weak I’ll elaborate more on what the Whimper Rally looks like and how to trade it, but it’s not anything I’ve ever seen classified by technical traders, yet it appears over and over throughout history, whether at market tops leading to trend reversals, or before crashes. My base case is not for a crash at this time, but a trend reversal.
Getting back to today… a couple of averages are running into technical levels like Dow Transports testing into the 200-day from below and Small Caps testing into the 100-day from below. I don’t think these technical levels are that important considering everything else this week, but I’m aware of them.
Today’s short squeeze was significantly larger than yesterday’s, which almost always supports Small Caps the most.
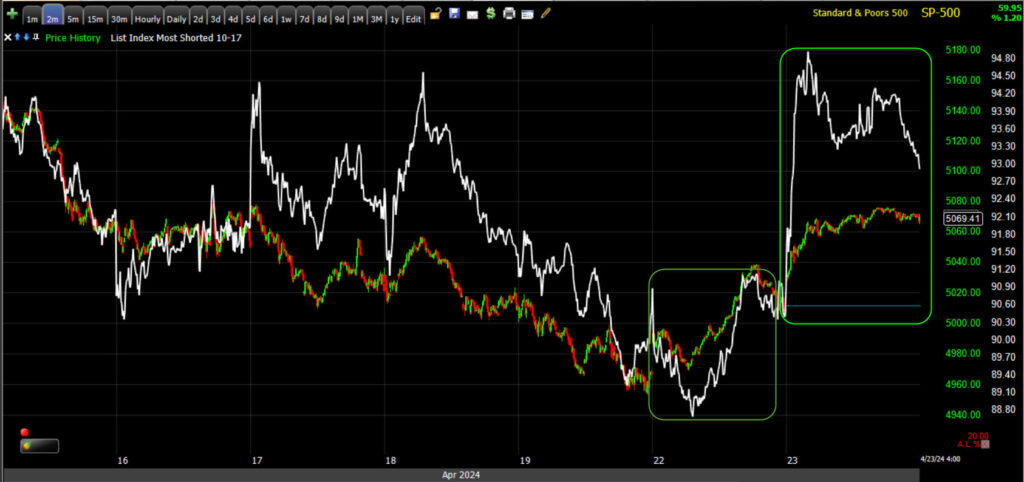 SPX (2m) and MSI – Yesterday’s squeeze vs. today’s.
The short squeeze is still nowhere near the size of the cluster of short squeezes in November and December; any of which on their own were the largest in a couple of years…
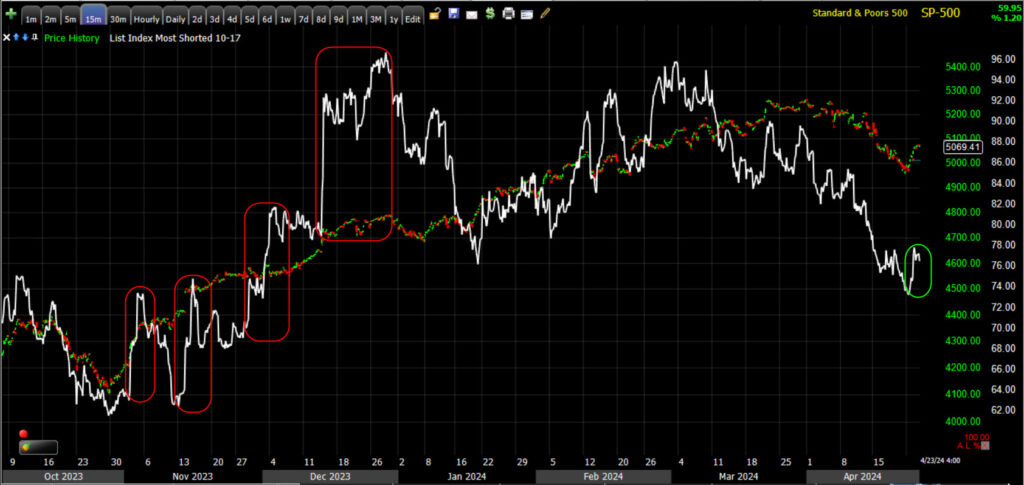 SPX (15m) and MSI with today’s squeeze in green vs. the November/December short squeezes in red.
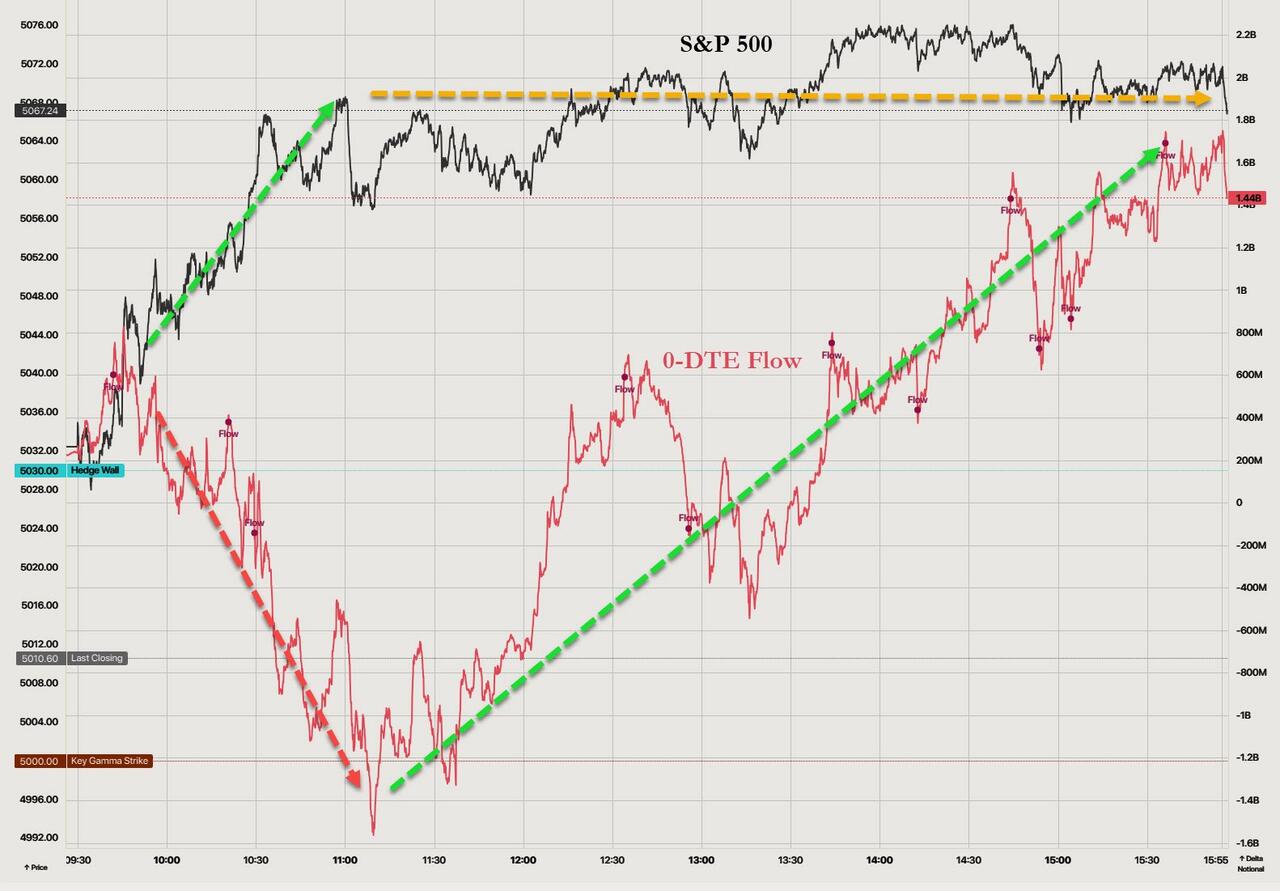
I don’t usually pay much attention to 0-DTE options traders, but today I have some interest given this afternoon’s 3C signals.
0-DTE traders faded the opening ramp and short squeeze aggressively, but were forced to cover through afternoon. The positive delta flow from 0-DTE did nothing to boost the averages which moved into an intraday consolidation, suggesting there were ‘fundamental’ sellers offsetting that flow.
Source: SpotGamma
On a side note, Goldman Sach’s trading desk noted that fast money Hedge Funds are buying, while “Long-Only” funds are selling.
“Our floor is skewed 6% better to buy overall with HFs driving most of our flows. The HF demand is a function of Info Tech Buying (again… mix of LC Tech, semis, select SW), Discretionary demand (mostly e-commerce), Industrials, Comms Svcs, Energy, and Staples… Hcare is the only Sector being sold by HFs. Short Ratios are moderate to low today
LOs are selling Info Tech (pockets of SW), Energy selling, Comm Svcs, Fins.”
VIX (-7.4%) is coming down pretty fast as traders are getting more bullish and geopolitical risks in the Middle East have faded as they usually do, “A flash in the pan.” VVIX is down -8% and as I showed in the Early Update, VIX’s relative performance divergences or signals are led by VVIX, and both tend to lead the market. Here’s the excerpt from this morning…
“Pro Tip: VVIX’s relative performance leads VIX and VIX’s relative performance often leads the S&P, thus it can be said that VVIX’s relative performance divergences leads the S&P.
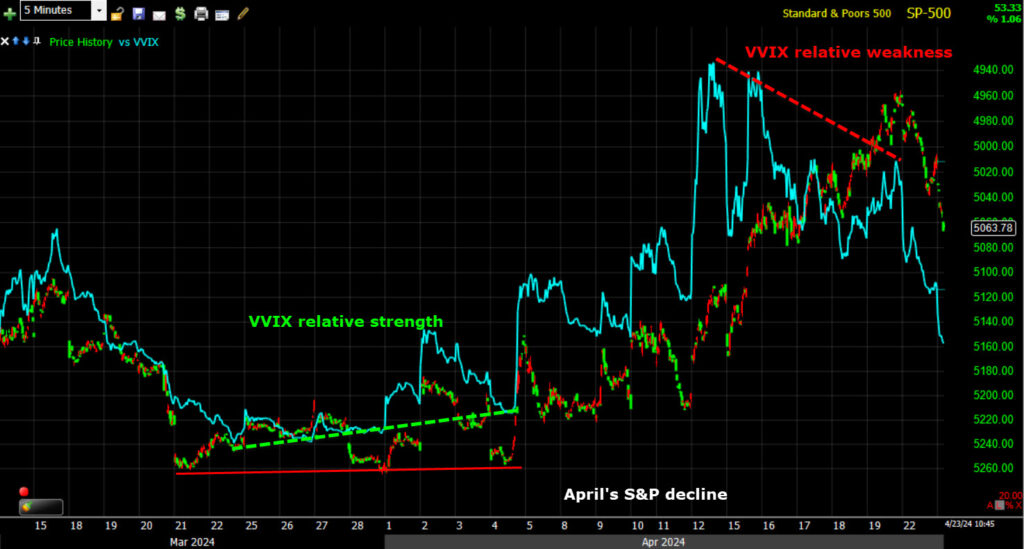 SP-500 (5m w/ price inverted for context) and VVIX. VVIX’s relative strength/positive divergence led the S&P lower into April (remember S&P’s price is inverted), and recent relative weakness is leading the anticipated oversold bounce for stocks.”
Volatility is telling us this market wants to go higher in the short-term.
The Absolute Breadth Index ended at 41.
S&P sectors
10 of 11 S&P sectors closed higher with the 3 mega-cap heavy sectors (Technology, Communications and Consumer Discretionary) at the top of the leaderboard along with heavily weighted Health Care. These mega-cap heavy sectors are the sectors that got beat up the most last week by the CTA’s, the most oversold, the ones most likely to rally short-term and with rates stable in consolidations they would normally have every opportunity to do so. The wild card is mega-cap earnings and inflation data later this week that could through a cog in the wheel.
On the earnings front, GE Aerospace (GE +8.3%), UPS (UPS +2.4%), Danaher (DHR +7.2%), General Motors (GM +4.4%), and PulteGroup (PHM +3.8%) set the positive tone this morning in pre-market. Disappointing results and/or guidance from Nucor (NUE -8.9%) and Packaging Corp. (PKG -4.8%) left the Materials sector as the only sector in the red.
The mega-caps (+1.6%) outperformed the equal weight S&P by 85 basis points. The mega-caps underperformed the same equal weight index by 450 basis points last week alone. After 7 consecutive days down and a decline of -18.6% over the same period, Tesla (TSLA +1.8%) broke the losing streak ahead of its quarterly earnings results after today’s close.
The Philadelphia Semiconductor Index added another +2.2% after yesterday’s bullish inside day (or Harami in Japanese candlestick vernacular).
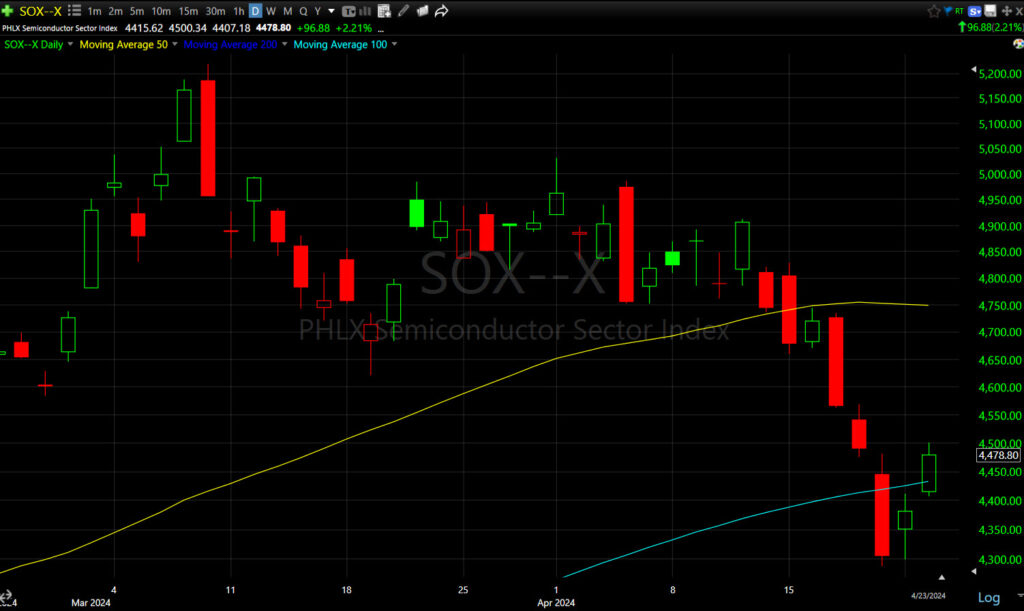 SOX Index (daily) – still it’s a drop in the bucket relative to recent selling, but it’s the type of oversold bounce expected as we neared the end of last week.
Materials ⇩ -0.86 %
Energy ⇧ 0.55 %
Financials ⇧ 0.64 %
Industrial ⇧ 1.39 %
Technology ⇧ 1.48 %
Consumer Staples ⇧ 0.28 %
Utilities ⇧ 0.47 %
Health Care ⇧ 1.30 %
Consumer Discretionary ⇧ 1.19 %
Real Estate ⇧ 0.91 %
Communications ⇧ 1.52 %
Regional Banks (+1.15%) have completed the back-test of the large bear flag and have nearly filled the gap. After they fill the gap, they’re going to be on my radar. They don’t look good, but a rising tide lifts all boats. If they start underperforming after filling the gap, then we may have something to work with in looking for the short-entry set-up.
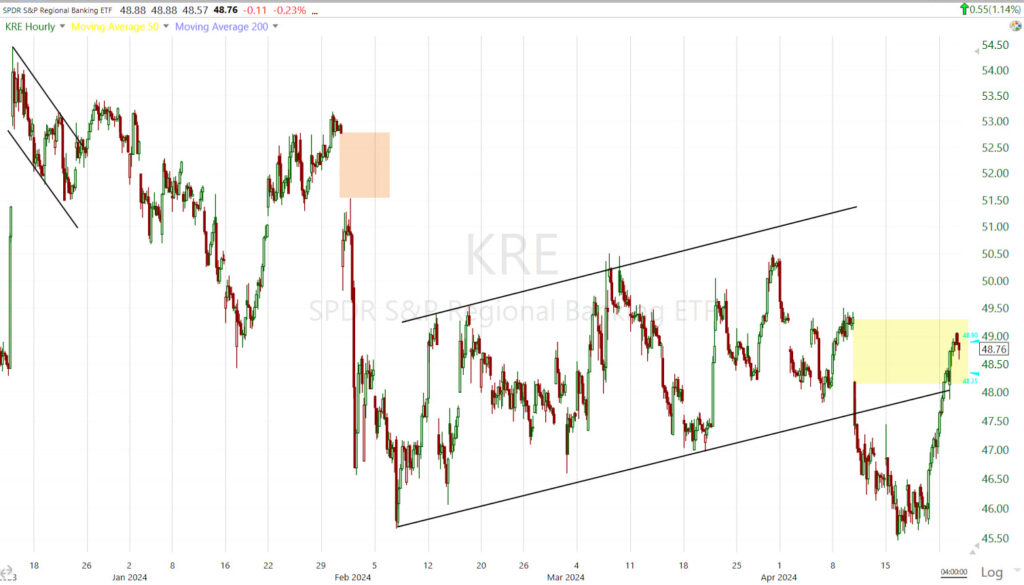 Regional Banks (60m) – they should fill the rest of the yellow gap. I don’t know about the orange gap around $53. That looks like a bearish breakaway gap and if so, it likely is not filled. If price were to fill the orange gap, then we’ll be looking at this chart with fresh eyes. I do think this is going to be a trouble area because of the CRE exposure as we move forward this year, especially with the Fed moving toward an even “higher for longer” rate stance.
Internals
Advancers led Decliners by a nearly 5-to-1 margin at the NYSE and by a nearly 3-to-1 margin at the NASDAQ Composite. Volume was lighter today at 907 mln. shares. That’s not a great sign, but it’s also been a trend this year – rallying on declining volume, declining on heavier volume.
There was another strong Dominant price/volume relationship today, the same as yesterday, Close Up/Volume Down with about 70% of component stocks. This is the most suspect of the 4 possible relationships. Today’s internals fulfill all of the criteria for a solid 1-day overbought signal.
My breadth oscillator is at 77 so it has a little more to go before resetting into overbought levels in the 90’s.
I have so many chart templates full of custom indicators, scans and trading systems from decades of doing this, I nearly forgot about them. I think maybe 50 different templates and each may have a half-dozen custom indicators, scans, etc. I loaded one up after a comment someone made earlier today. I wanted to double check for myself. Over the past few months you may recall that I’ve noted several times that the NASDAQ-100’s advance/decline line, that doesn’t often diverge from the index, has been negatively diverging. I suppose I shouldn’t be too surprised at what I found.
The percentage of NASDAQ-100 component stocks trading below their 50-day SMA is just off the October low level when the NASDAQ-100 was -23.8% lower than today’s close.
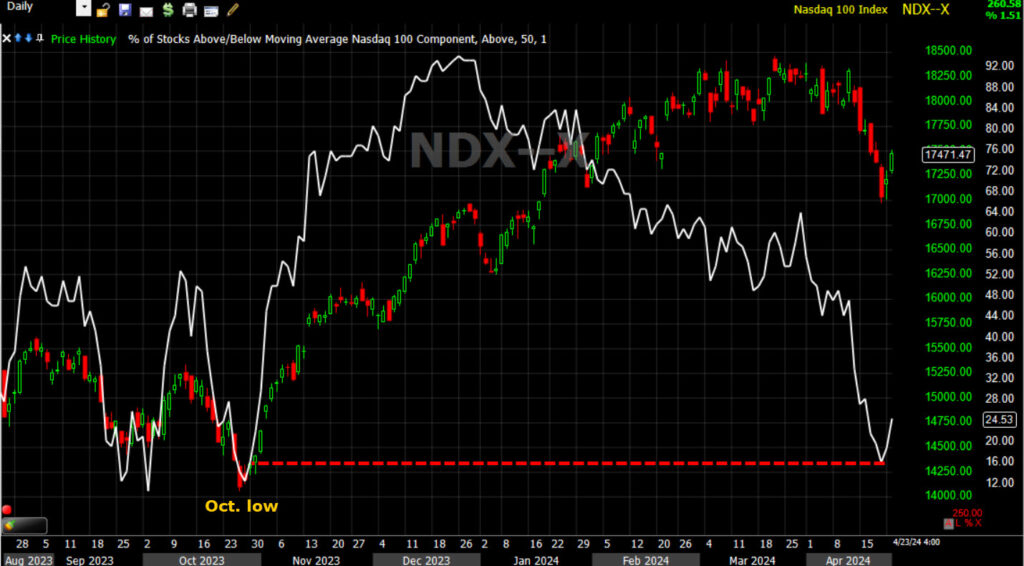 (daily) That’s stunning. The percentage of NASDAQ-100 component stocks is almost as low as the October low after the averages trended down for 3 months, while the NASDAQ index itself is nearly 24% higher! I quickly walked the chart back through time back to 2004 and there’s not many examples like this.
This chart sparked my curiosity and I flipped through a few more of the 50 or so templates I have.
Here’s another I created that basically shows the same information in a different format.
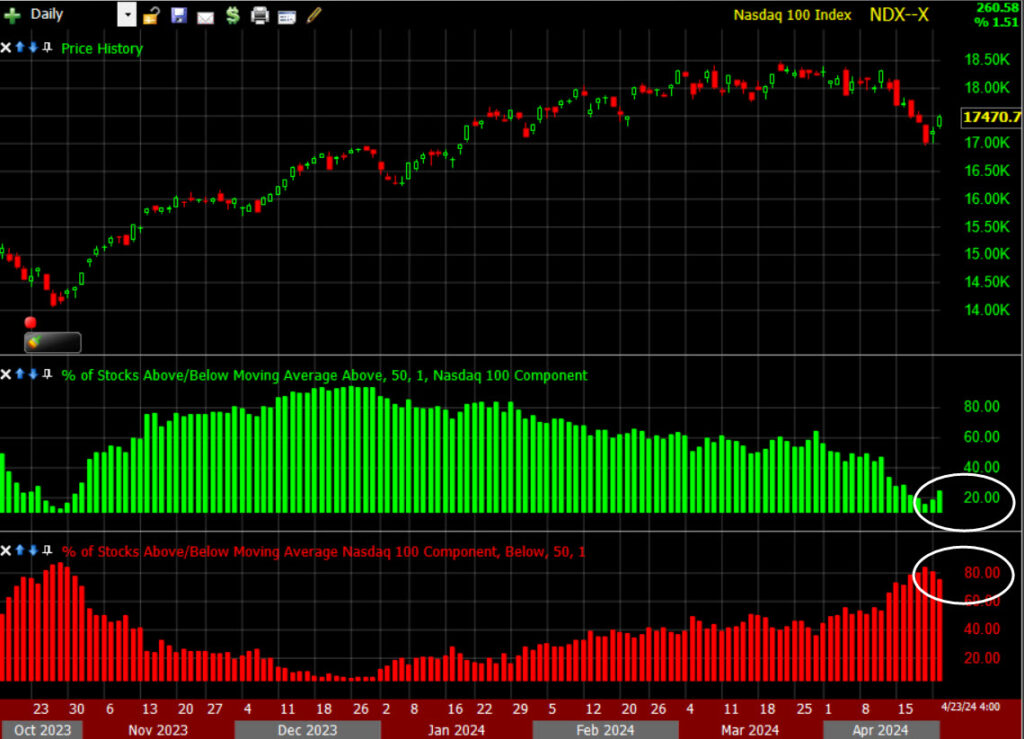 NASDAQ-100 (daily) and the percentage of the NASDAQ-100 component stocks trading above their 50-day (green) and below their 50-day (red). As of today 24% of NASDAQ-100 stocks are above their 50-day and 76% are below. As of Friday’s low it was 16% above and 84% below. By way of contrast, at the October low to the far left side of the chart the percentages were similar (13% and 87%), but the difference is that at the October low the market had already been trending down in a sub-intermediate down trend for 3 months coming off July’s high and H&S tops. In other words the picture now is similar to then, but then we were at the tail end of a 3 month down trend, not a week of price pulling back.
While I was pulling up various templates, I ran into this… The Percentage of NASDAQ-100 component stocks trading above their 200-day moving average.
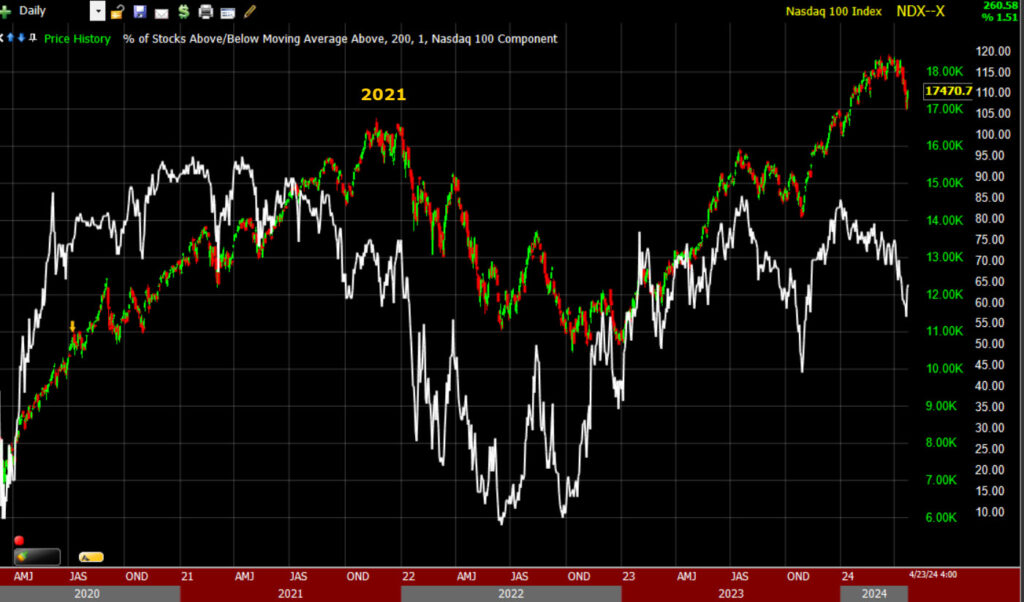 (daily) – The current readings aren’t too dissimilar to the deterioration in market breadth into the 2021 record high and top leading into the 2022 bear market. Back then it was a similar situation in which the mega-caps had led the market higher in 2021 (small caps went sideways), and in to the end of the year slowly the market leaders (mega-caps) fell off like we’ve seen the last couple of months in mega-caps and semiconductors, or NASDAQ-100 stocks.
And wow… I almost forgot about this one. I won an award (of sorts) for this custom Trend Channel. It considers recent price volatility to determine the channel. It’s meant exclusively for trend trading. In an uptrend the highest point of the lower channel is the stop, or the break of the trend. In a downtrend the lowest point of the upper channel is the stop or break of the trend. I used this for years. I can hardly believe I forgot about it.
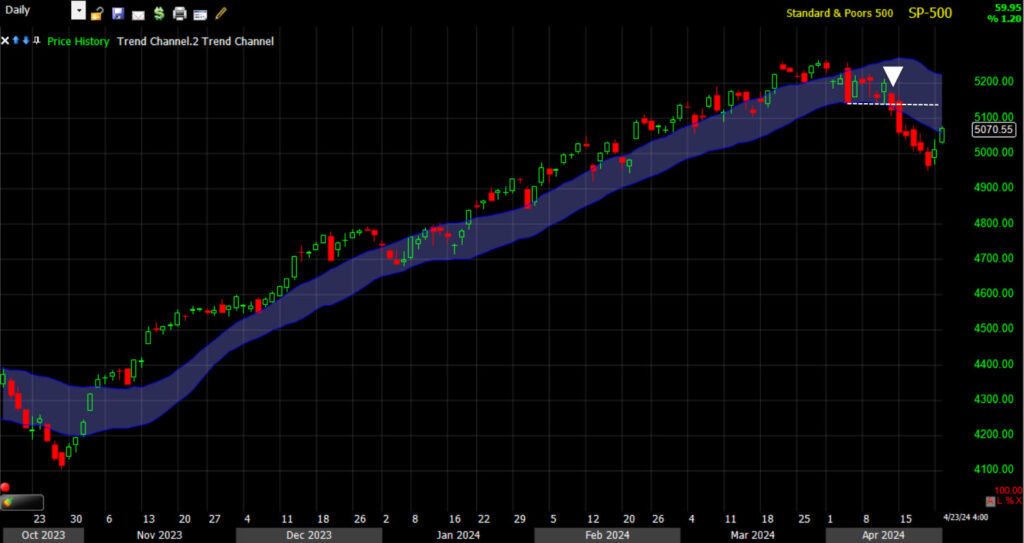 SPX (daily) the up trend off the October 2023 low didn’t have a single violation of the channel (or stop out) until April 12th (white arrow and dashed trend line). This doesn’t necessarily mean, “Go short right now” , but it tells you that there’s a very high probability that something big changed and the trend is over.
I think I’ll add a library of the numerous custom indicators, scans, strategies and back-tests to the “Resources and Concepts” page of The Technical Take website for anyone interested in perusing through them.
The takeaway from these handful of indicators is that there’s a very low probability that an oversold bounce is going to repair the massive damage to the indices. In fact it’s likely that the divergences get worse, making that the ideal time to get into some longer term trend short positions.
Treasuries
After testing 5.00% again this morning, the 2-yr yield settled the day down five basis points to 4.92%. The 10-yr yield dipped three basis points to 4.60%. 2-yr yield (daily) – While higher rates are not a current market worry this week, investors aren’t noticing, or perhaps caring, that the consolidation is that of a bullish ascending triangle (consolidation/trend continuation pattern).
Other yields across the curve are consolidating bullishly as well.
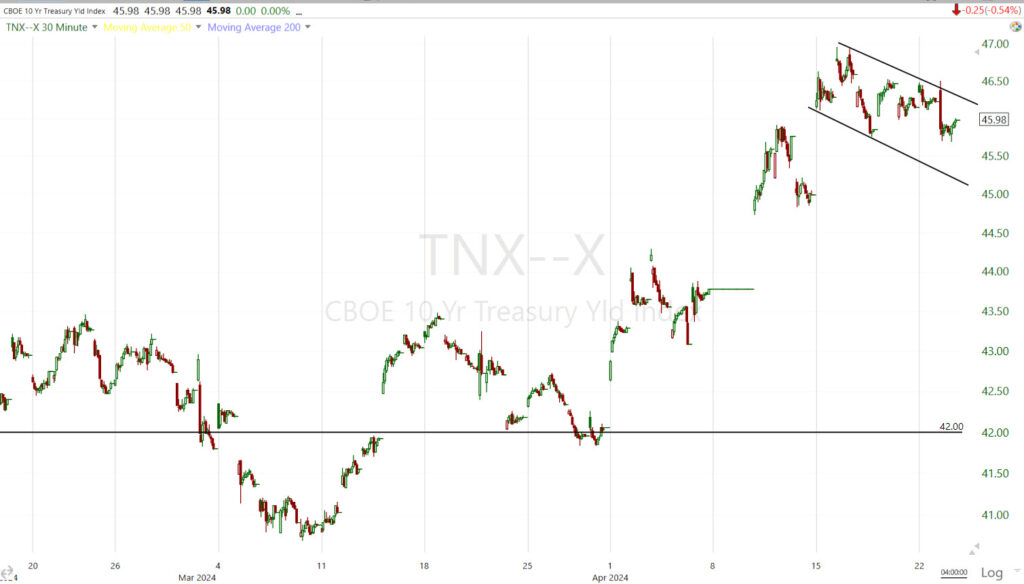
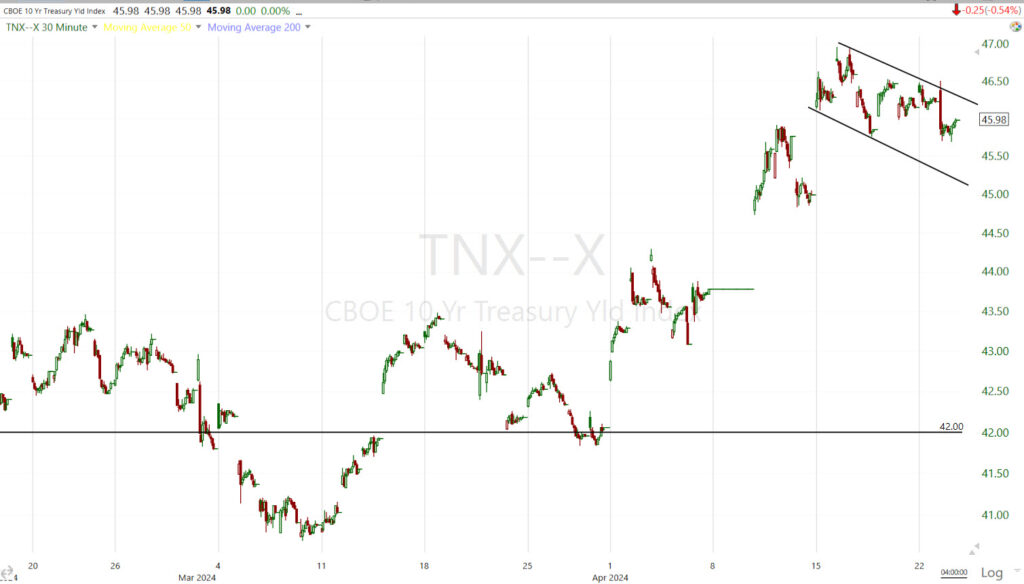
10-yr yield (30m) morphing from a symmetrical triangle to a more bullish flag consolidation as suspected yesterday. The bullish consolidations are all trend continuation patterns suggesting that they’re not done on the upside.
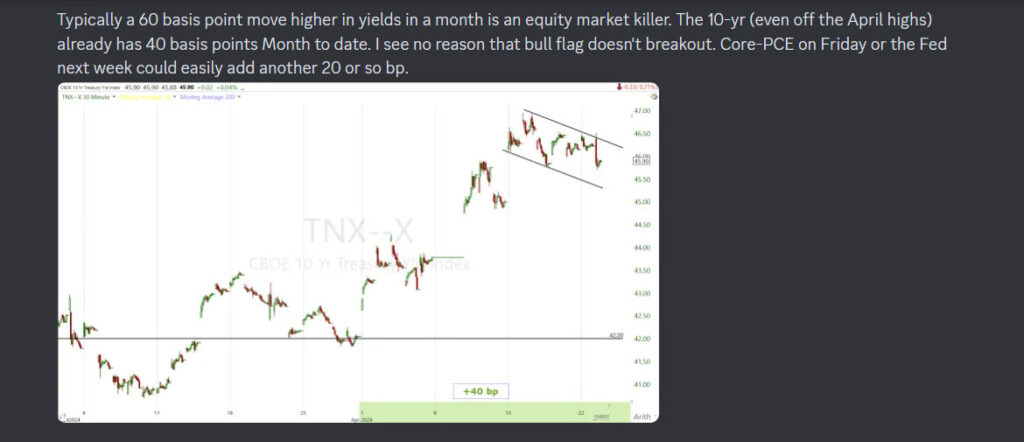
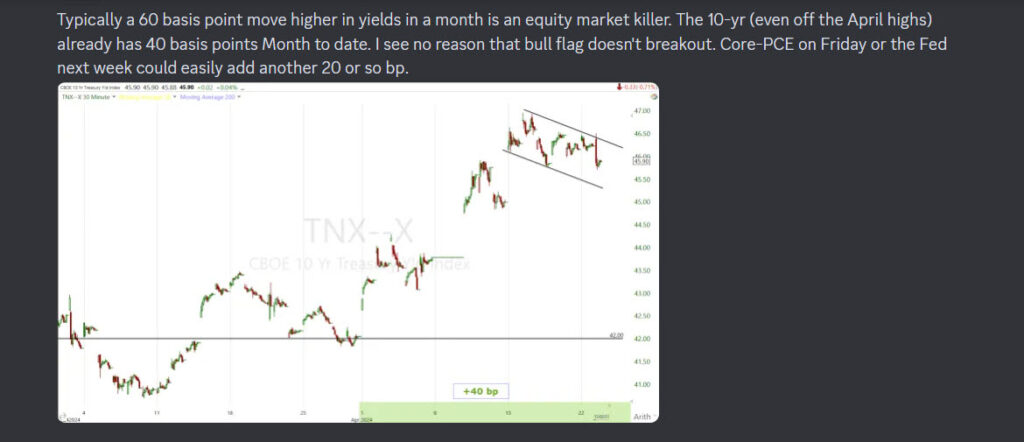
Earlier I posted this in the Discord room…
Currencies and Commodities
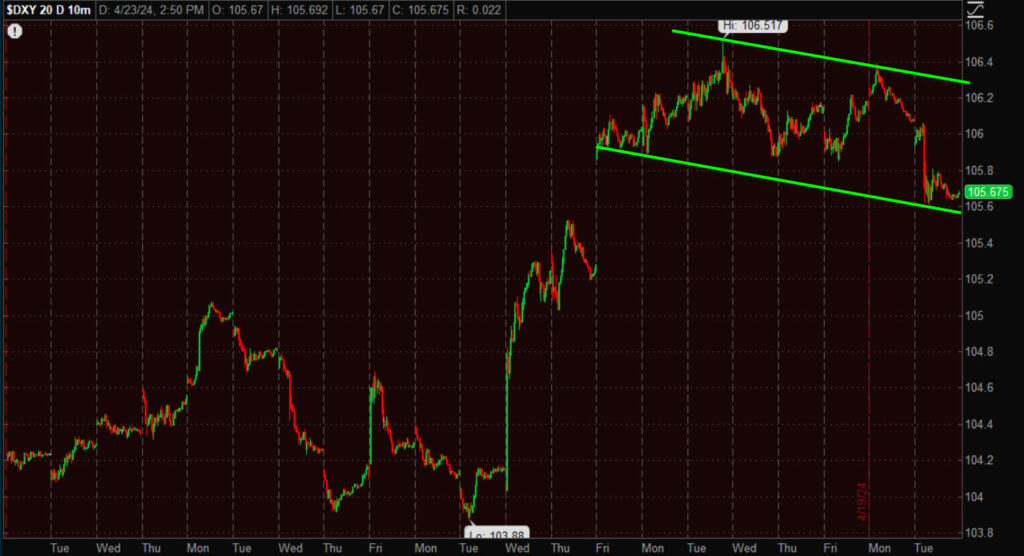
The U.S. Dollar Index finished with a decline of -0.35% and like the 10-year yield, morphed from a less bullish symmetrical triangle consolidation into a bull flag. However, as long as the Dollar isn’t rising, the equity market isn’t worried about it and it creates a window of opportunity for stocks to rally more without the pressure of a higher Dollar. However, this is a bullish trend consolidation/continuation pattern. Probabilities are very high that the Dollar eventually breaks out and heads higher. It’s the exact same situation with yields and commodities.
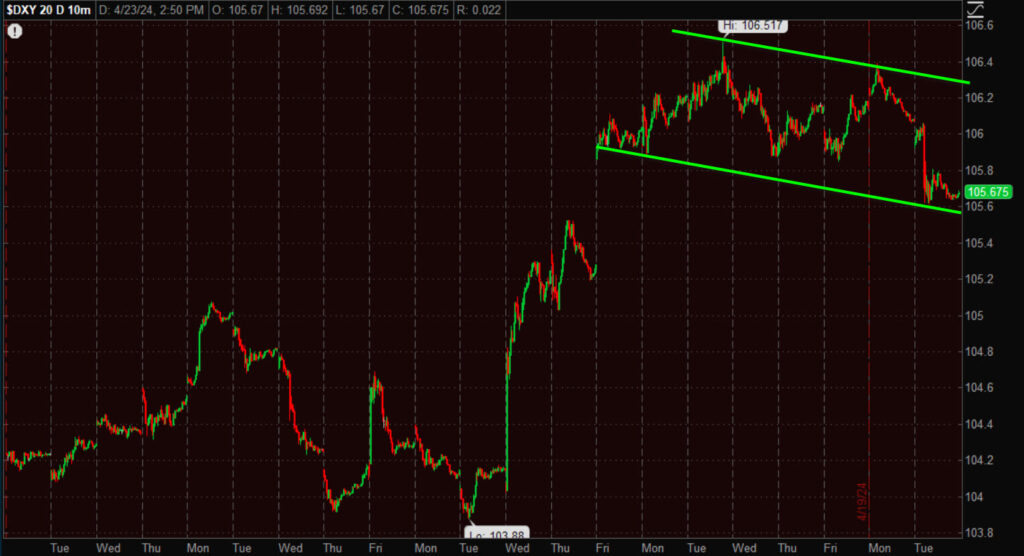 U.S. Dollar Index (10m) bull flag.
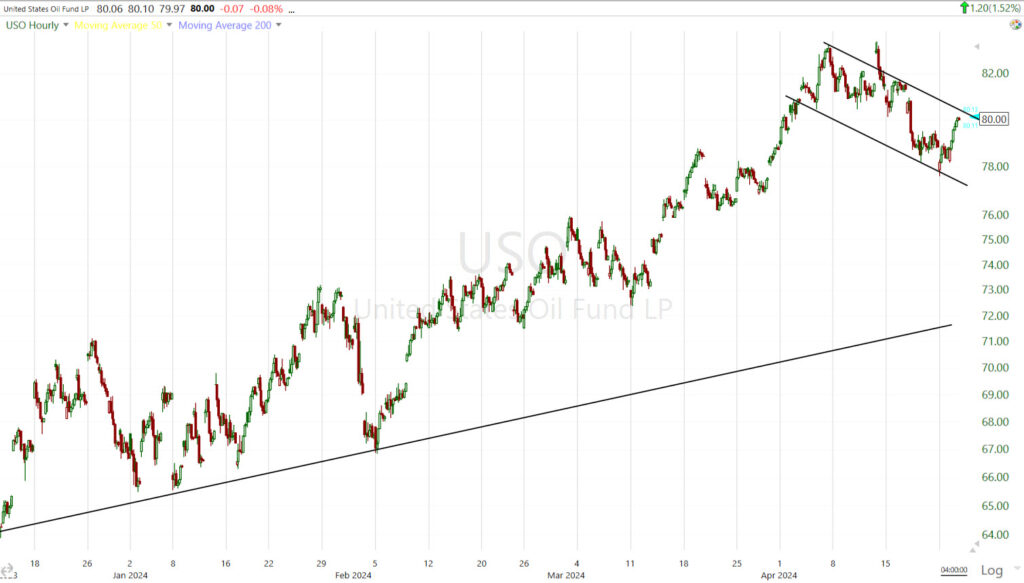
WTI Crude oil closed up +0.5% to $82.33 /bbl. Oil prices were volatile, dumping overnight and testing $80 handle before finding support and bouncing up above $83. The key takeaway is that crude kept its bullish consolidation alive.
USO (60m) bull flag.
I’m still waiting on URA (+0.85%) to breakout above $29.50, until then it’s pretty dull.
After some very ugly selling last night on heavy volume, Gold futures retraced most of that decline to finish lower by -0.2% at $2,342.10/oz. Gold had seen earlier lows of about -1.8%. There’s not much to update on gold’s price chart. I’m still looking for price volatility to calm down. If it doesn’t, I’ll be more worried about gold in the near to intermediate term, but longer term (as in later this year) I think gold will be set to rip again due to the economic/macro environment.
Bitcoin ended the day unchanged, around $67,000.
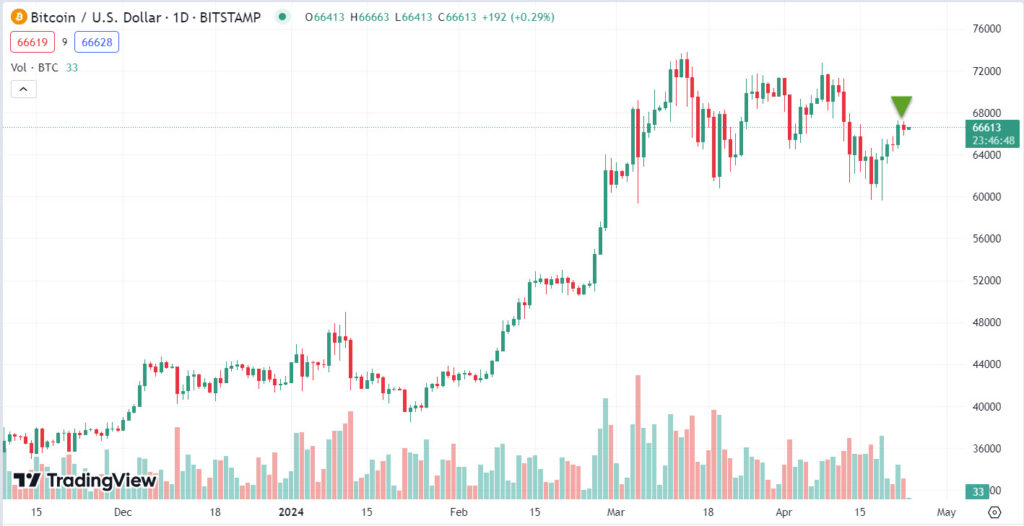 BTC/USD (daily) today’s small price candle doesn’t give us any new information other than it’s a risk asset and risk assets rallied today. BTC… not so much, but that’s not actionable.
Summary
Stocks want to go higher in the short term, but there are a lot of potential spring boards, or landmines, this week with an earnings bonanza that includes 180 companies or 40% of the S&P 500 by market value, and key inflation data ahead of the Fed next week.
On the earnings front, DataTrek’s Nick Colas wrote that without the 5 Big Tech names, S&P 500 earnings would be down 6.0% in Q1 rather than the consensus estimate of +0.5 pct growth: “AMZN, GOOG, META, MSFT and NVDA are the difference.”
That means for the indices, these earnings are crucial as the other 493 S&P components’ earnings are expected to decline further to -6% YoY vs. flat in Q4 2023. Tomorrow META reports and Thursday GOOGL and MSFT report.
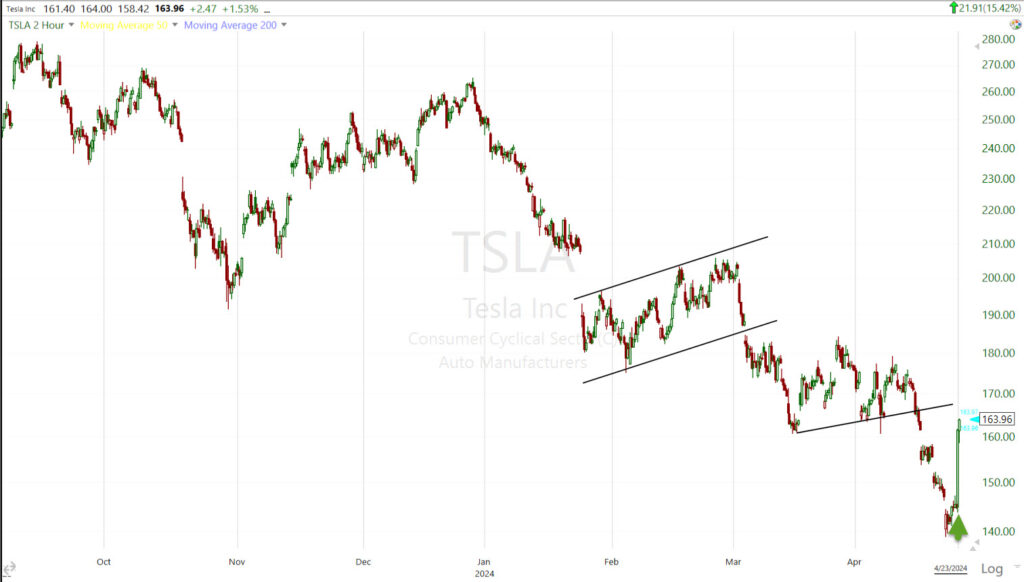
Tesla missed earnings across the board, but is up over +15% in afterhours after details that the company plans to roll out more affordable models. Can you believe TSLA is up over +15% and the price chart is still ugly, still in a clear down trend?
TSLA (2h) w/ afterhours trade (earnings response at the green arrow) with a strong bounce, but to another lower high in the down trend thus far.
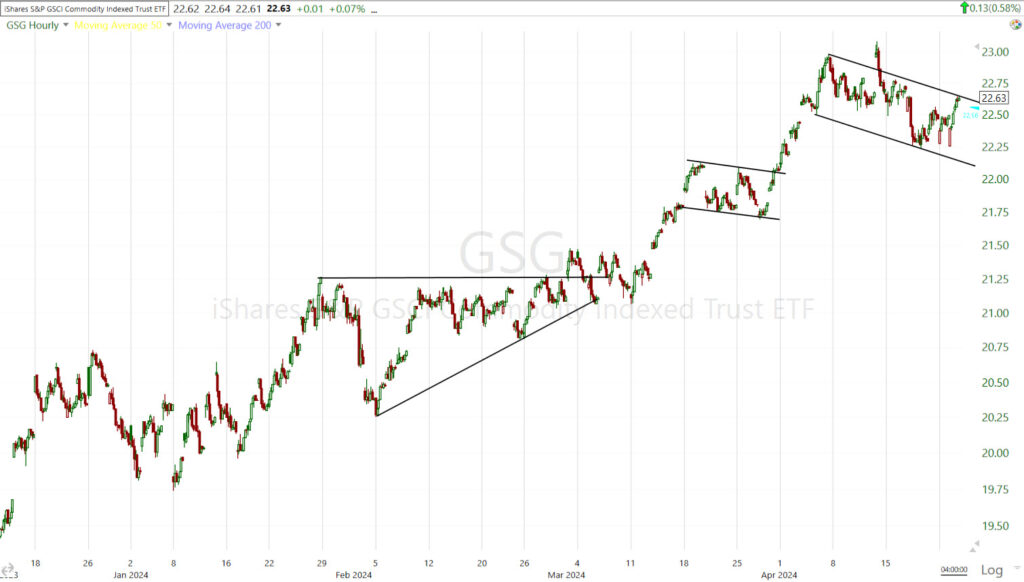
Other than earnings responses that can’t be predicted, we have key inflation data later in the week. What we can control is watching the bullish consolidations that are taking place right now in inflation-related assets. Those include Crude Oil’s bull flag…
Commodity indices trading in bull flags…
The U.S. Dollar (a reflection of inflation and likely Fed policy) also trading in a bull flag…
And Rates trading in bullish consolidations (2-year in an ascending triangle & 10-yr in a bull flag)…
Bull Flags aren’t a certainty, but they are a very high probability that prices are going higher.
What do all of these assets have in common? A breakout higher represents additional inflationary pressures.
As shown above in the Discord room today, a “rule of thumb” is a 60 basis point gain in the 10-yr in a month is big trouble for stocks.
By last Tuesday the 10-yr added 50 basis points for the month of April and you know what happened last week with the Tech stocks getting slaughtered (NASDAQ down -5.35%, Tech sector down -6.25% & SOX Index down -9.25% last week). Why do the Tech stocks get hit on higher rates? High valuations. Higher inflation/rates mean those valuations have to be marked down. That was the entire theme of 2022’s bear market.
Probabilities are these bull flags breakout higher. The stocks market has a period of calm in which these markers of inflation are consolidating. Those consolidations aligned perfectly with deeply oversold conditions, but should those bull flags breakout, whether because of higher Crude oil or commodity prices, or a hot core-PCE print, or even the Fed next week, it’s almost certainly going to be back to risk-off for stocks. The inflation boogey man hasn’t gone anywhere, he’s just having a smoke while equity investors do what they’ve done all year and buy the dip.
Another marker to watch is the 2-yr yield above the psychologically important 5.00% level. It’s been bumping up against it and consolidating just below it. If the 2-yr moves above 5.00%, we’re almost certainly going to see all of the above bull flags break out too anyway.
I do think the near-term bias is up for stocks with some real risks, which is why I prefer to have a strong set-up for any long trades. If those opportunities and set-ups don’t present themselves, I’d rather keep my powder dry and wait for the bigger opportunity, which is the short entry on not just trades, but longer term trending positions.
It’s going to be an interesting couple of weeks ahead. Sell in May and Go Away?
Overnight
S&P futures are up +0.25% tonight. NASDAQ-100 futures are up +0.6% (Tesla earnings). Dow futures are unchanged.
The U.S. Dollar Index is flat.
WTI Crude Oil futures are flat.
Gold futures are down -0.3%.
Bitcoin futures are up +0.5%
Yields are flat.
Wednesday’s economic calendar features:
- 07:00 ET: Mortgage Bankers Association weekly Mortgage Applications Index (prior 3.3%)
- 08:30 ET: March report for durable goods orders (prior 1.4%) and durable goods orders, excluding transportation (prior 0.5%)
