This is a subscriber post from Wolf on Wall Street-Trade, the “Daily Wrap” covering the day’s events in the stock market and more.
A much cooler than expected Consumer Price Index (CPI) sparked a sharp drop in bond yields and sent stocks ripping higher this morning. The May Consumer Price Index reflected some welcome disinflation on a year-over-year basis in total CPI (actual +3.3%; prior +3.4%) and core CPI (actual +3.4%; prior +3.6%). Interestingly, the Fed didn’t care much about it. They seem to be more worried about wage inflation recently.
The FOMC left the target range for the fed funds rate unchanged at 5.25-5.50%, as expected. The vote was unanimous, as expected. The directive reiterated that, “The Committee does not expect it will be appropriate to reduce the target range until it has greater confidence that inflation is moving sustainably toward 2 percent,” as expected.
There was a hawkish surprise though. The Summary of Economic Projections (SEP) showed a median estimate of only one rate cut this year versus three at the time of the March SEP projections.
Things were great for stocks until the FOMC’s much more hawkish than expected Dot-Plot caused some turbulence. Remember that this is coming from a stock market that priced in 7 rate cuts for 2024 and rallied hard on the notion of a sot landing or no landing scenario, and never priced those 7 cuts back out. The market vacillated in the wake of the policy directive and SEP. Fed Chair Powell’s press conference was less dovish than typical, and non-committal about the policy path.
- THERE IS AN ARGUMENT THAT PAYROLLS MAY BE A BIT OVERSTATED
- WAGE INCREASES STILL RUNNING ABOVE A SUSTAINABLE PATH
- 2% INFLATION LIKELY TO REQUIRE LOWER WAGE GROWTH
- NO ONE ON FOMC HAS ANOTHER HIKE AS BASE CASE
Did he really say that Payrolls may be overstated? Oh my!
Averages
Small Cap Russell 2000 was best on the day with some early short squeeze action. NASDAQ-100 was second best. The Dow was the laggard. S&P and NDX both made new highs, but the S&P ended with a bearish shooting star candle.
S&P-500 ⇧ 0.85 %
NASDAQ ⇧ 1.33 %
DOW JONES ⇩ -0.09 %
RUSSELL 2000 ⇧ 1.62 %
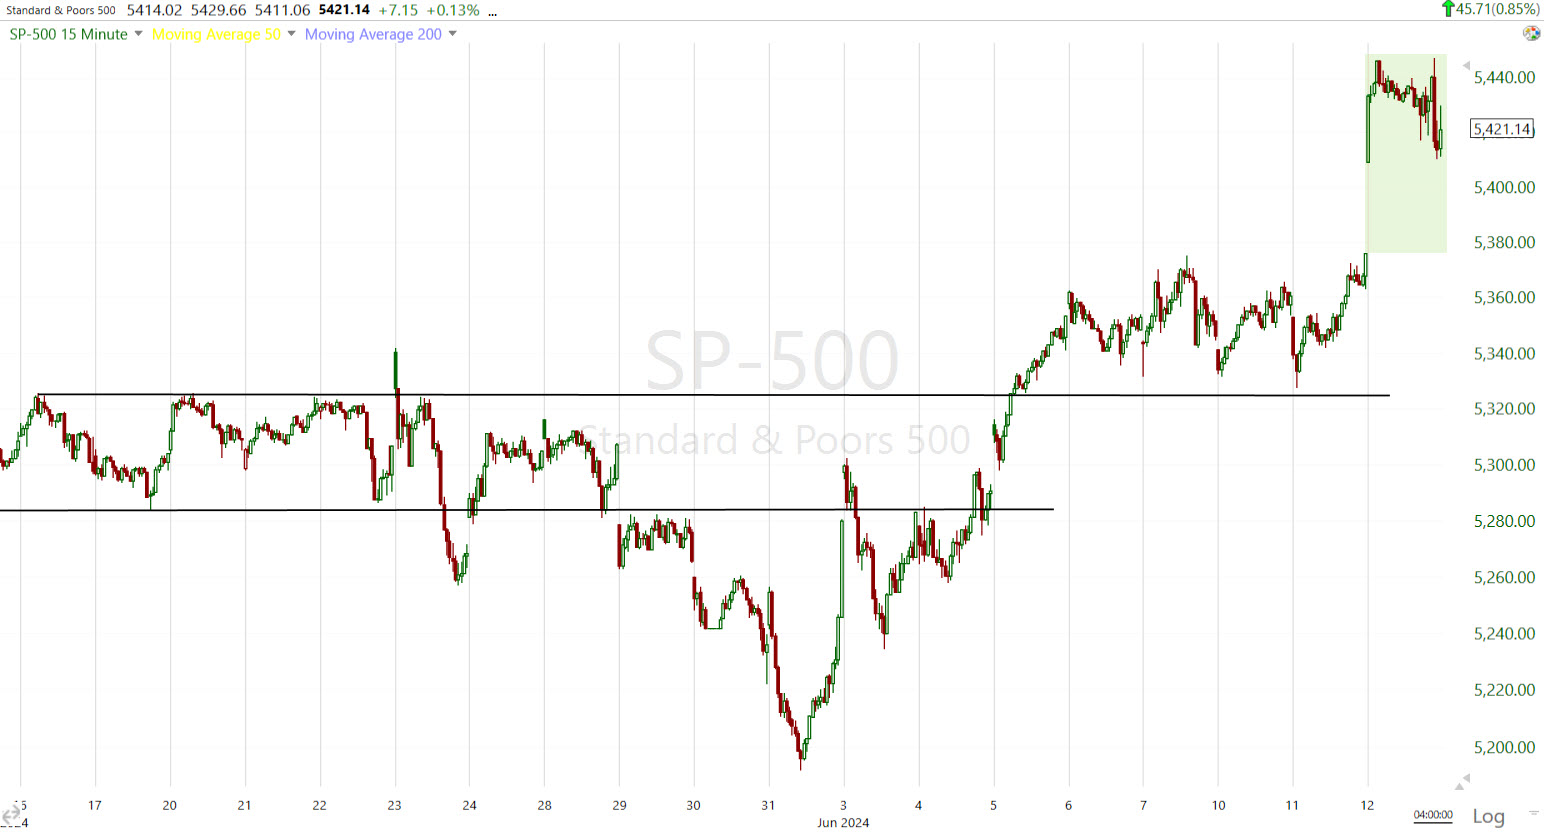 SPX (15m) with a strong open after the cool CPI, but the index gave up some gains after the Fed/Powell.
The FOMC pullback this afternoon left a bearish Shooting Star on the S&P’s daily chart…
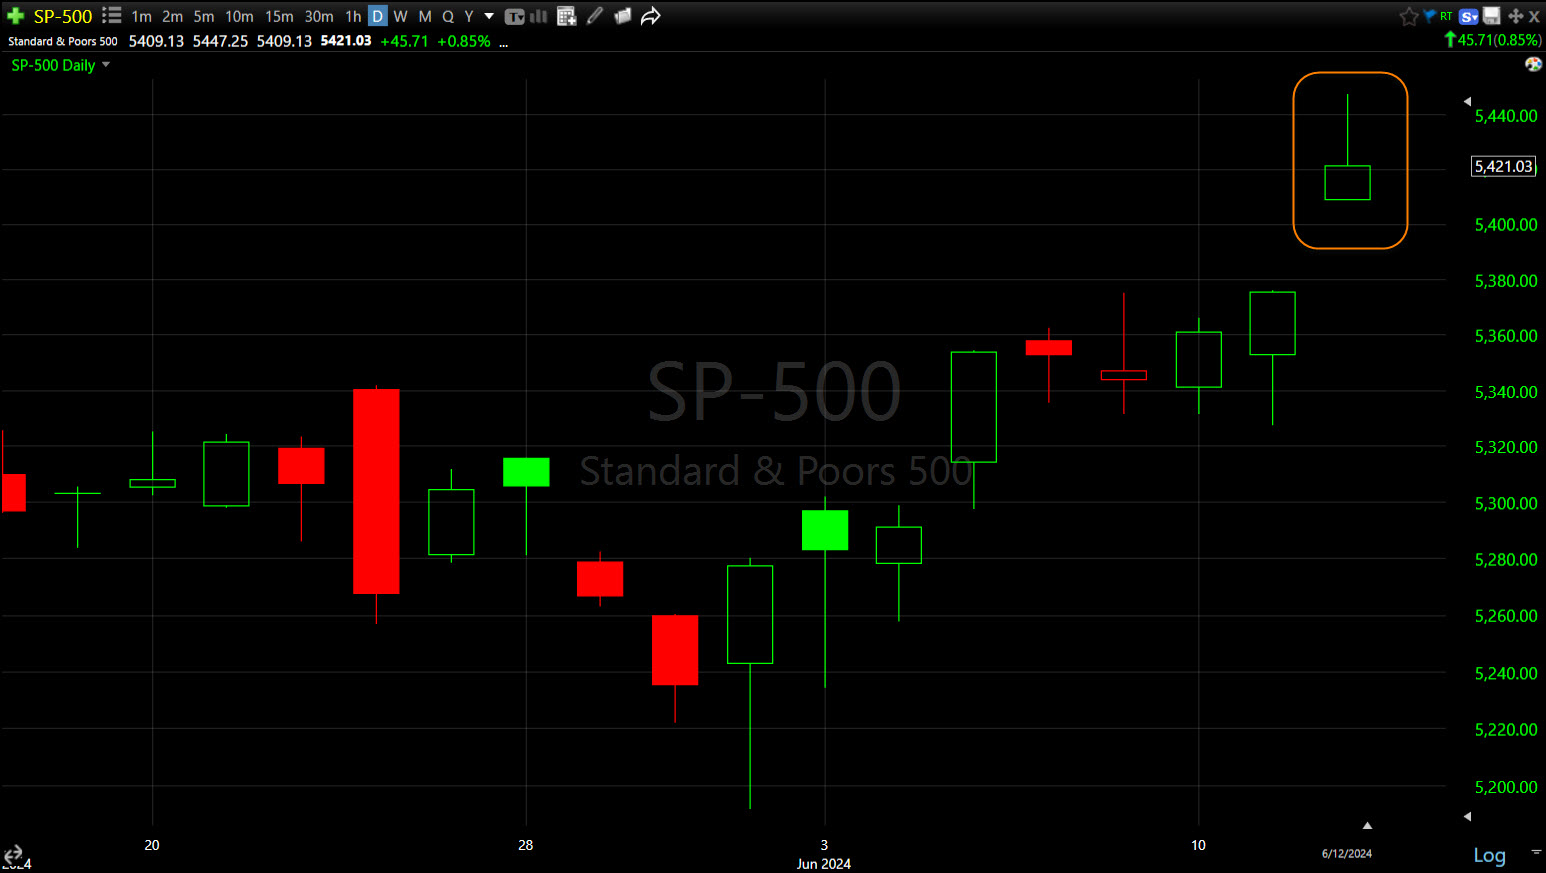 SPX (daily) Shooting Star
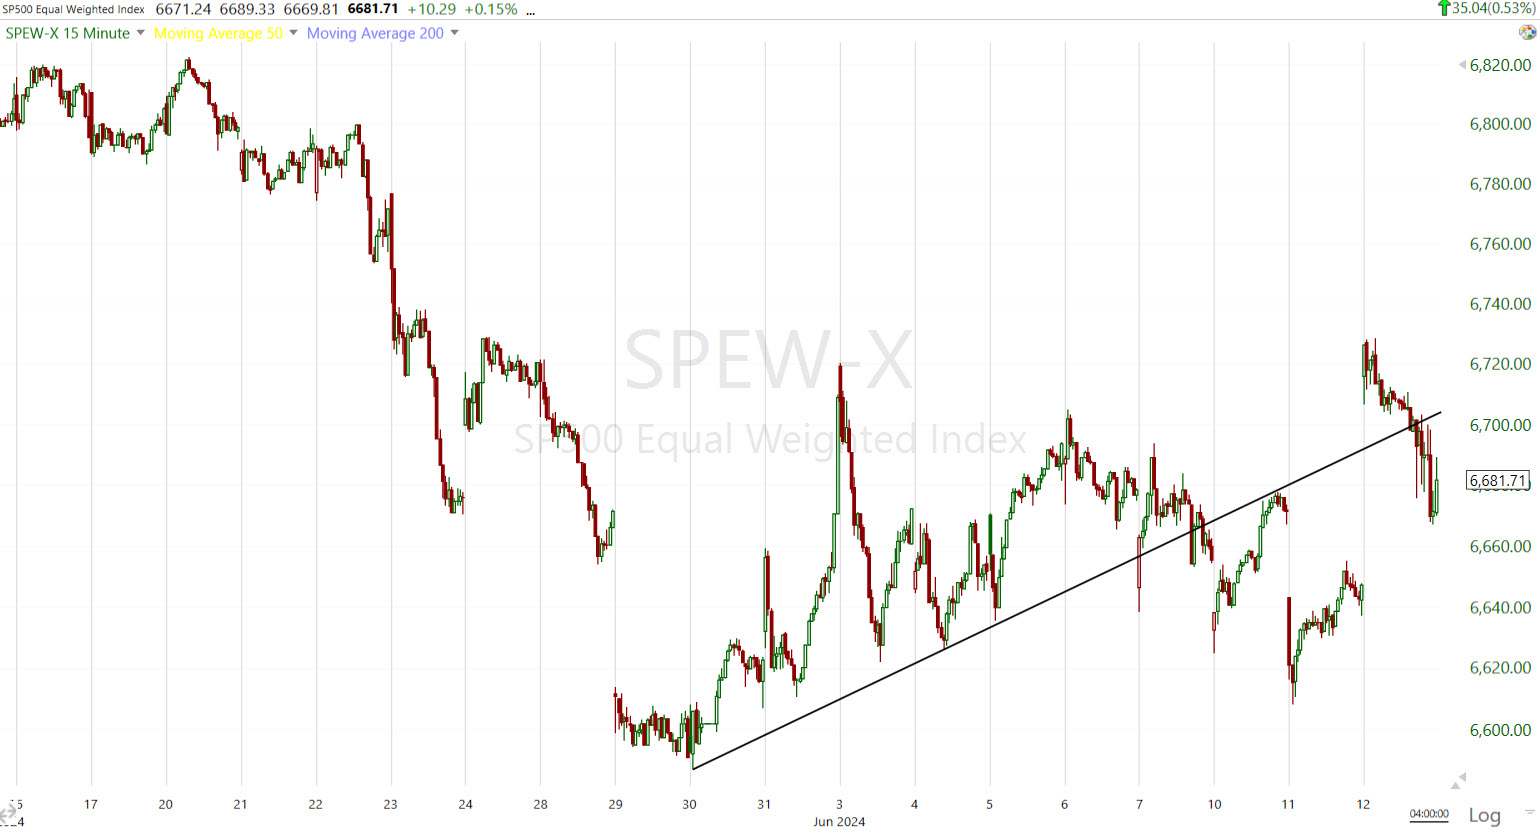 The Equal Weight S&P-500 (15m) looks much different than the benchmark index, in something akin to a large bear flag.
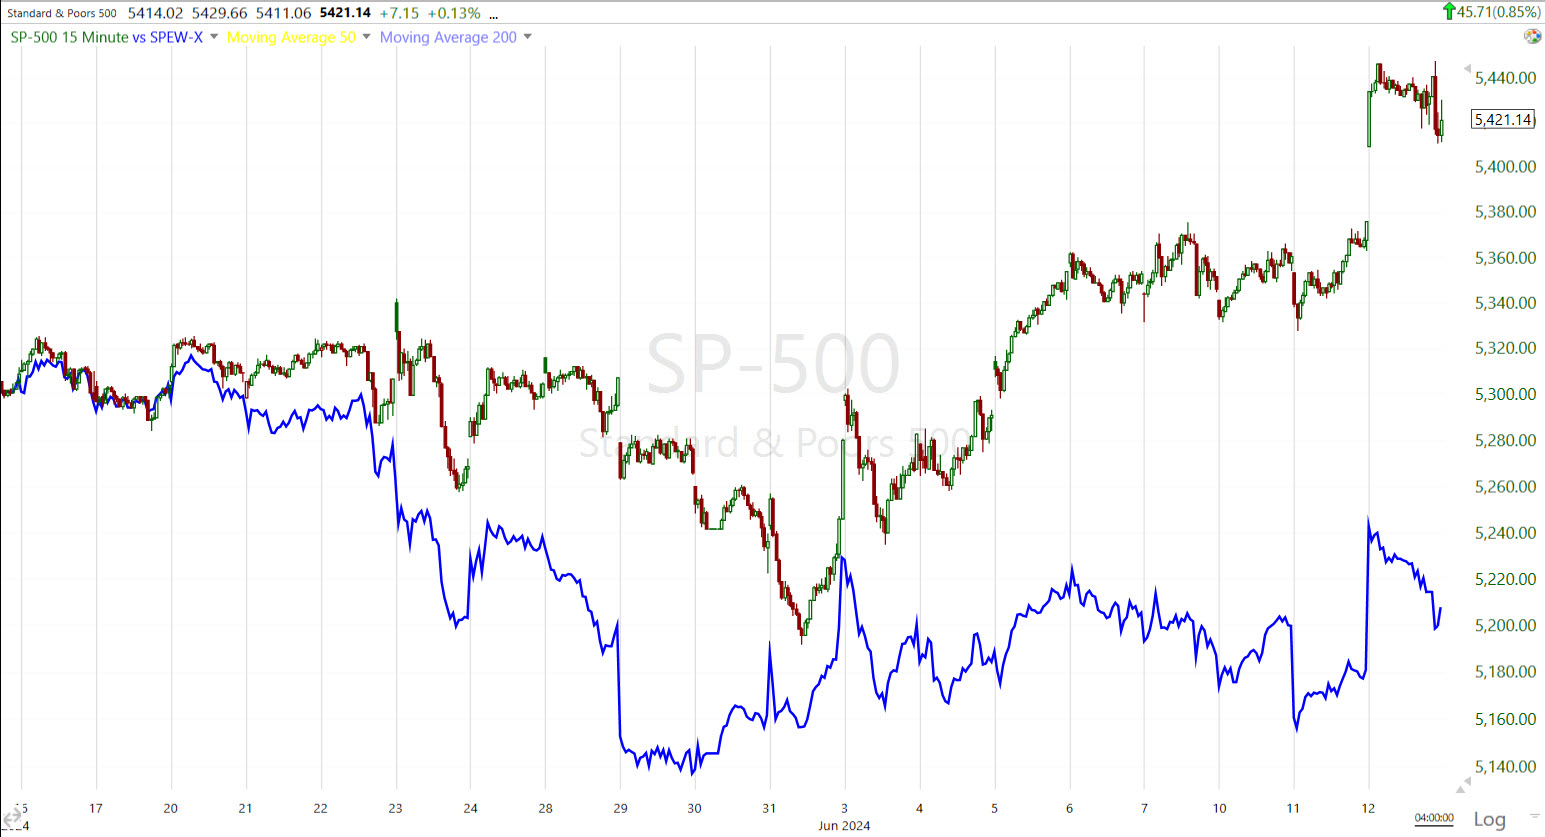 SPX (15m) and the Equal Weight S&P (blue). While the mega-caps lift the benchmark S&P more than the equal weight S&P, we don’t often get this type of relative negative divergence between the two indices…
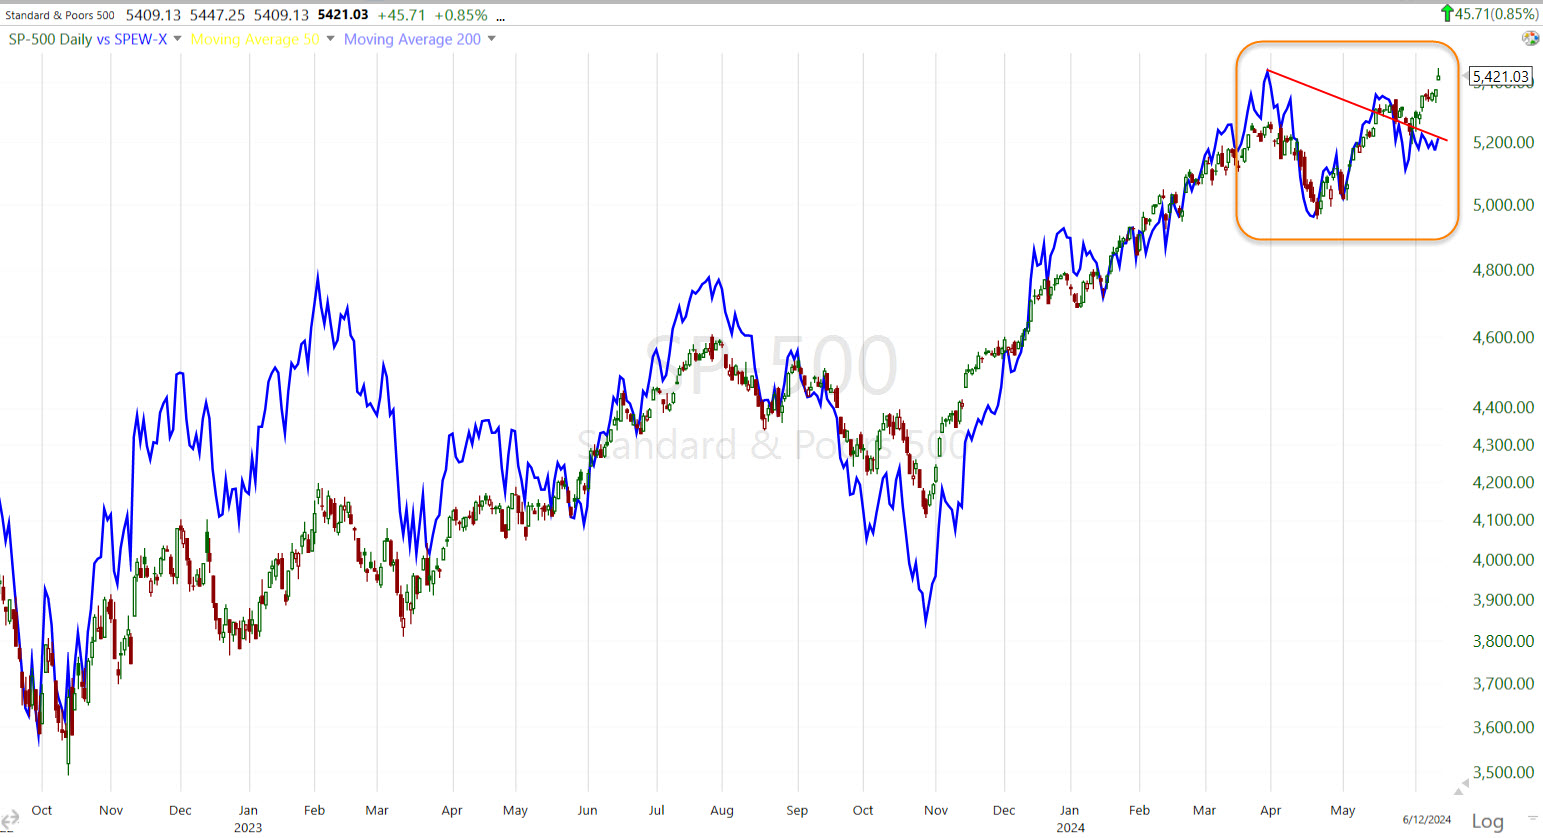 SPX (daily) and Equal Weight S&P (blue) – the divergence is a reflection of the weakening market breadth I’ve highlighted nearly every day.
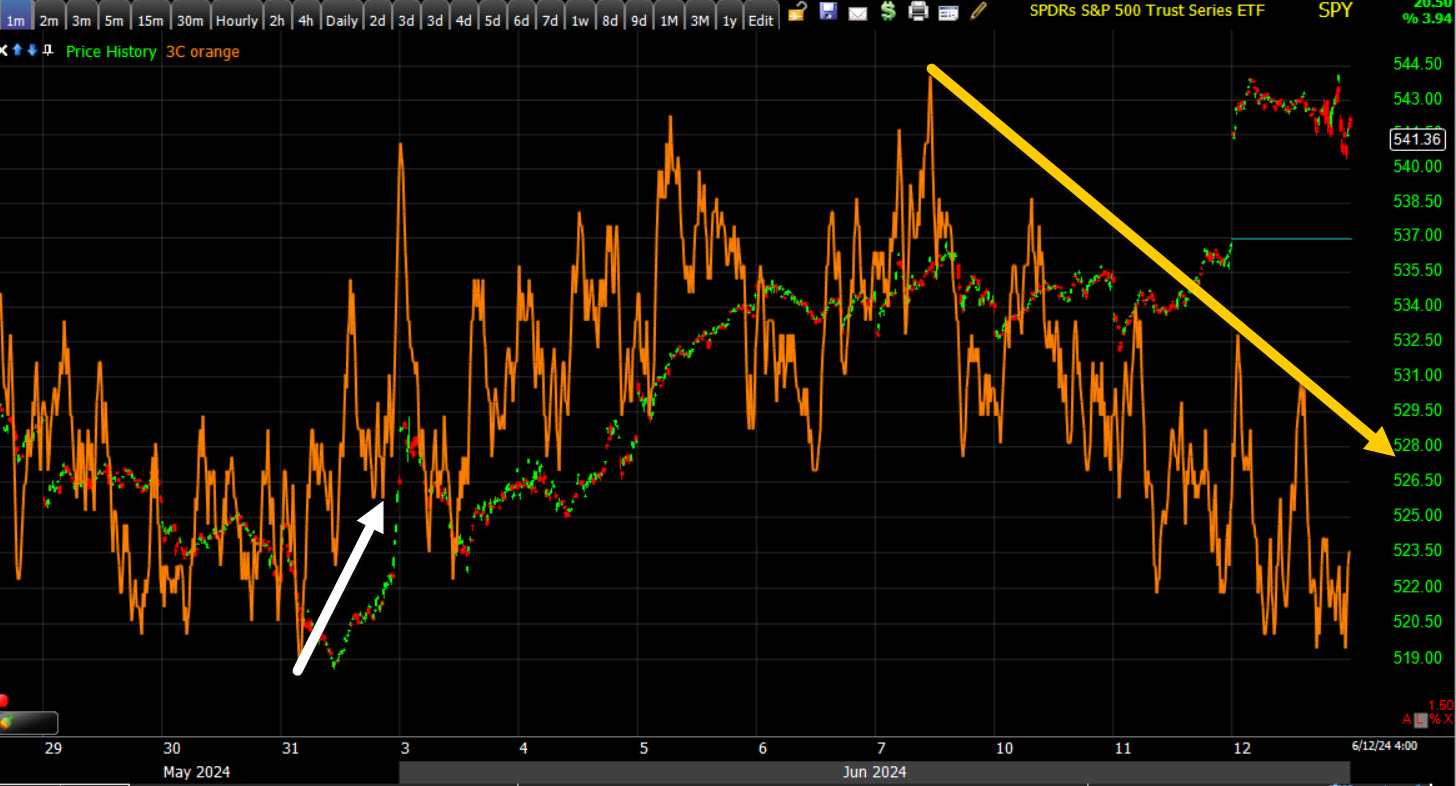 SPY’s (1m) 3C chart
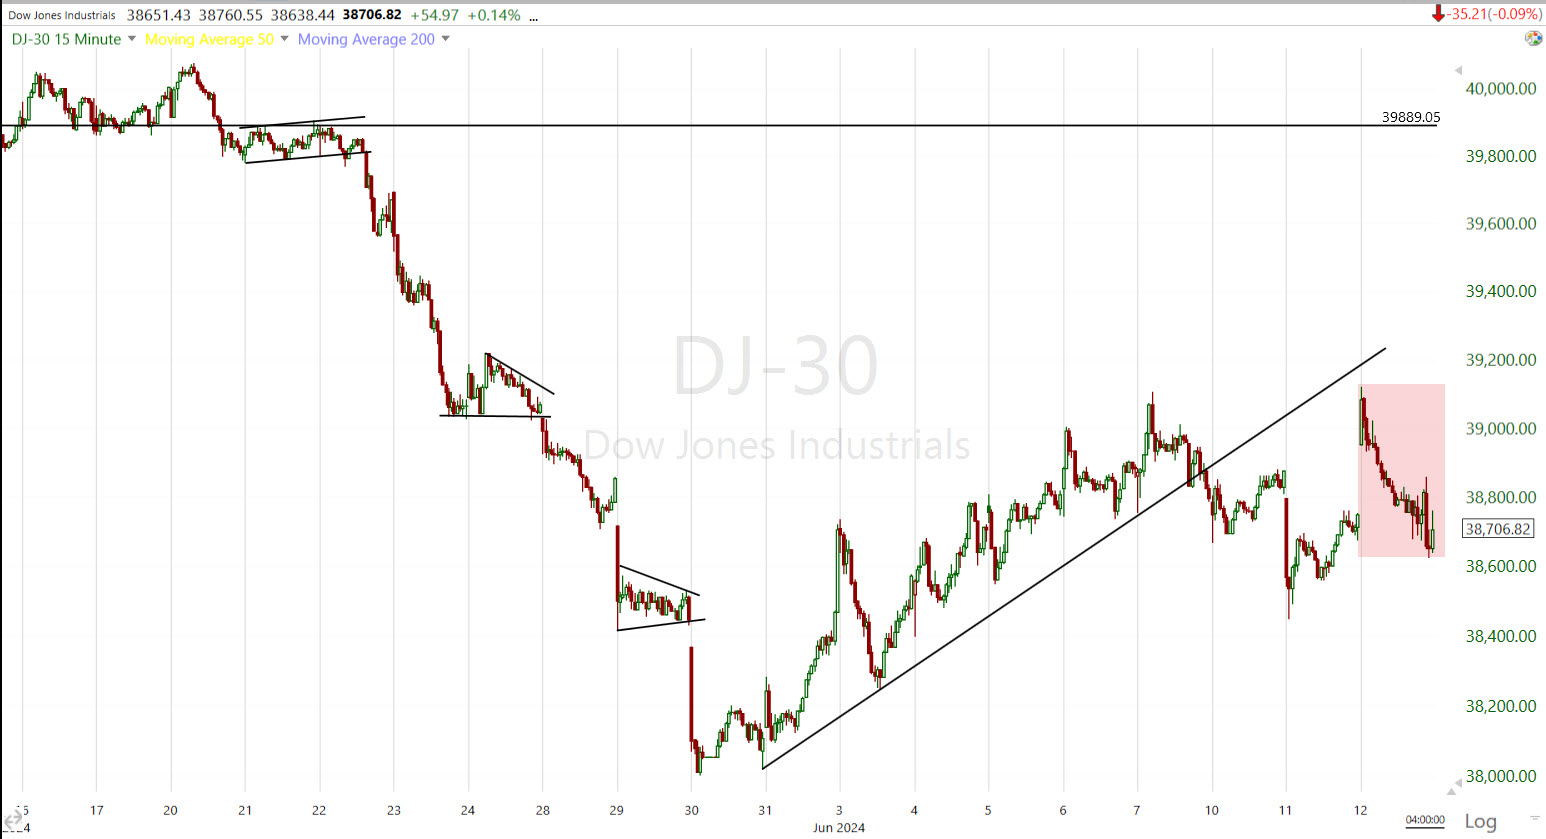 DJIA (15m) also trading in something akin to a bear flag since a failure to follow through on a new high. The Dow gave all of its early gains back and that left a bearish engulfing candle on the daily chart.
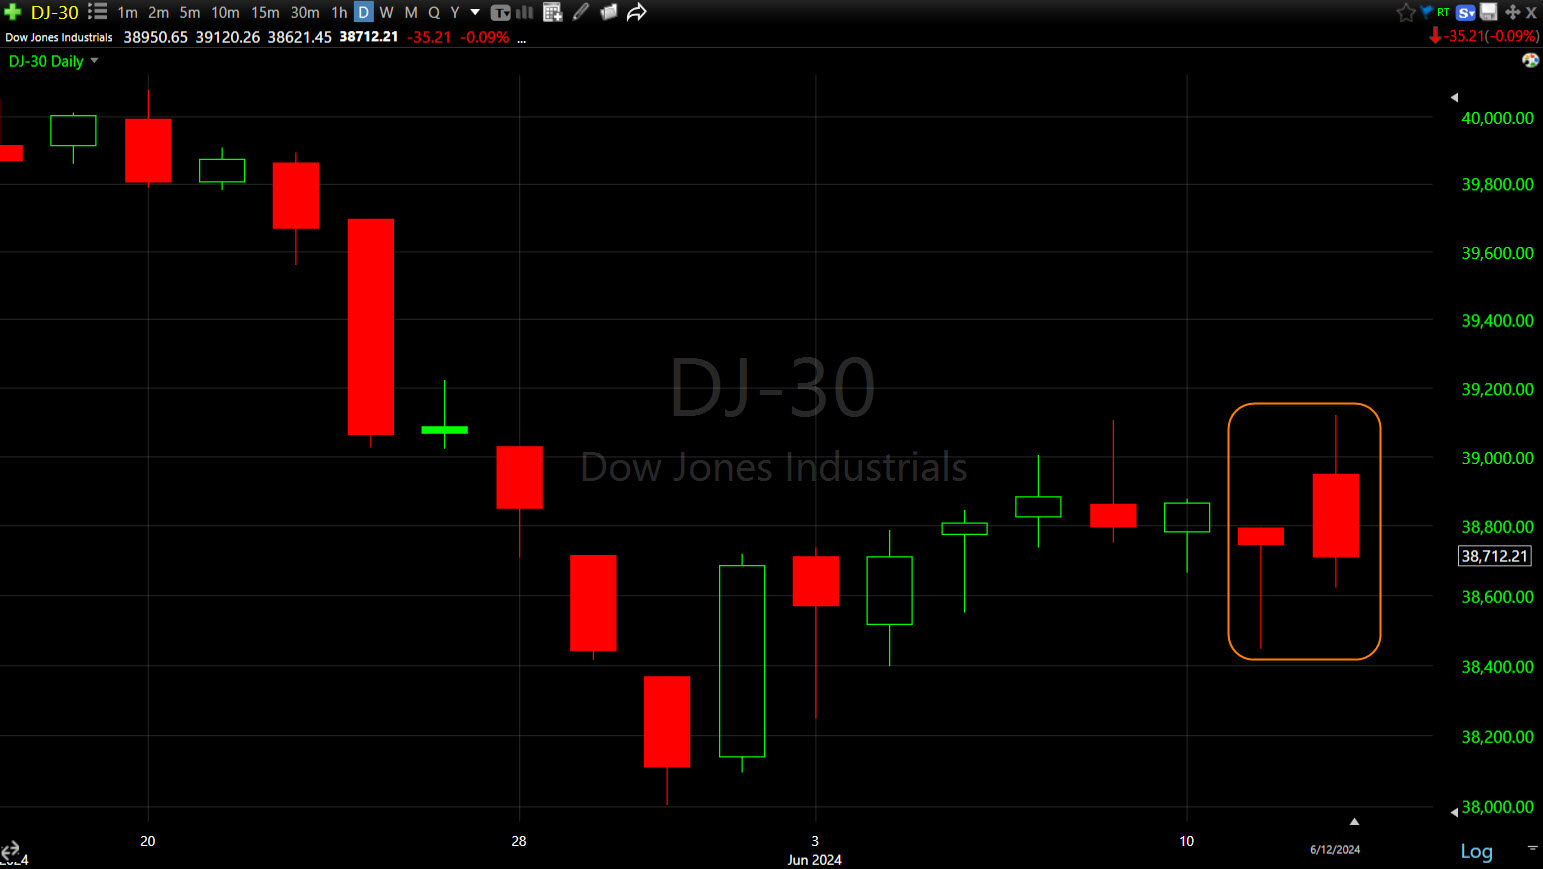 DJIA (daily) Bearish Engulfing candle, swallowing yesterday’s bullish hammer.
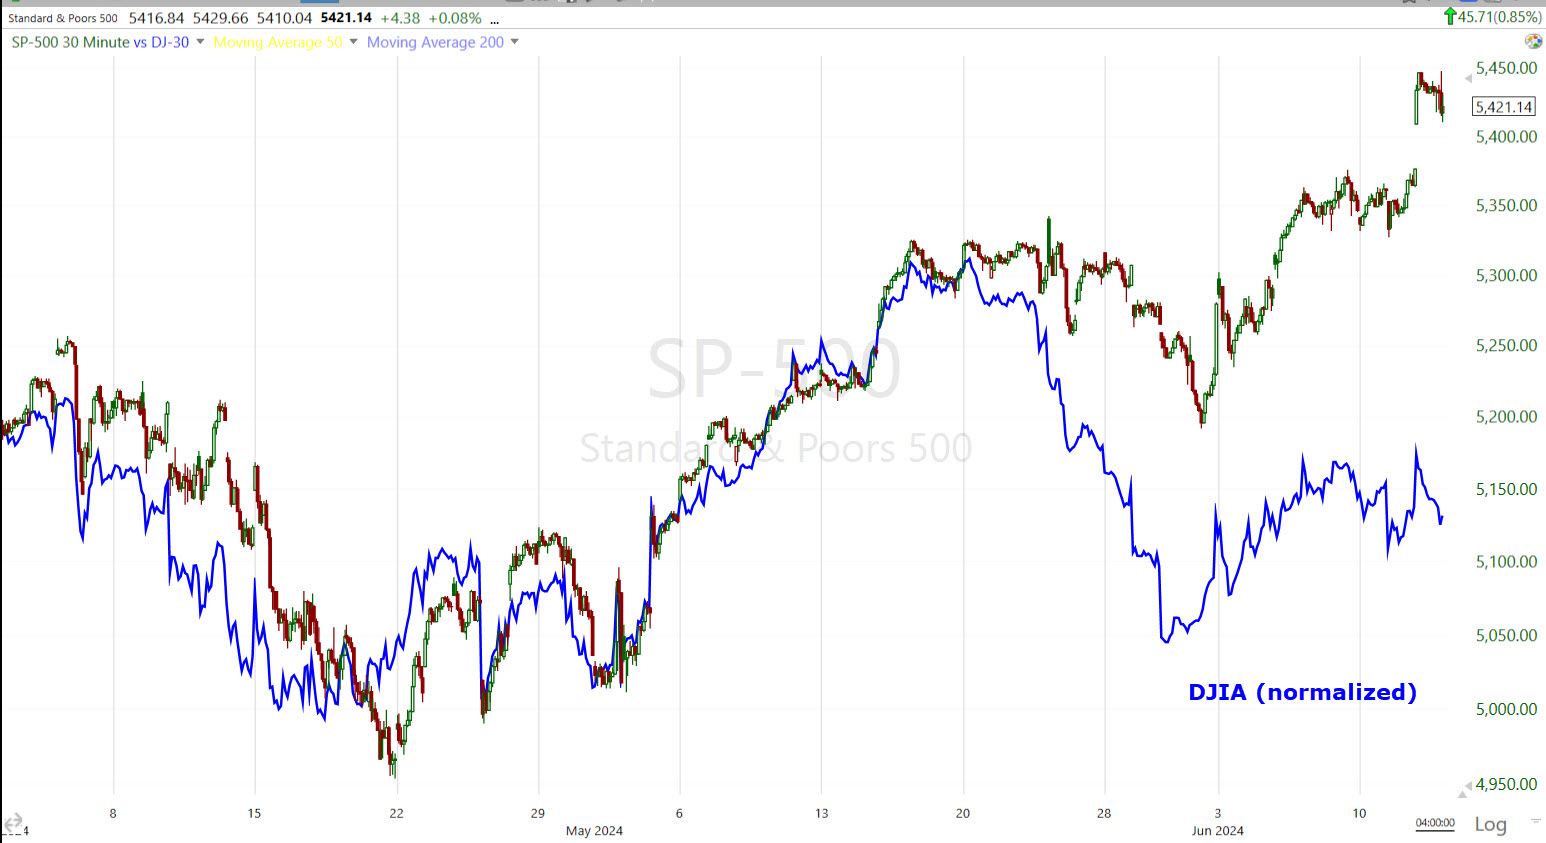 SPX (30m) and DJIA (blue)
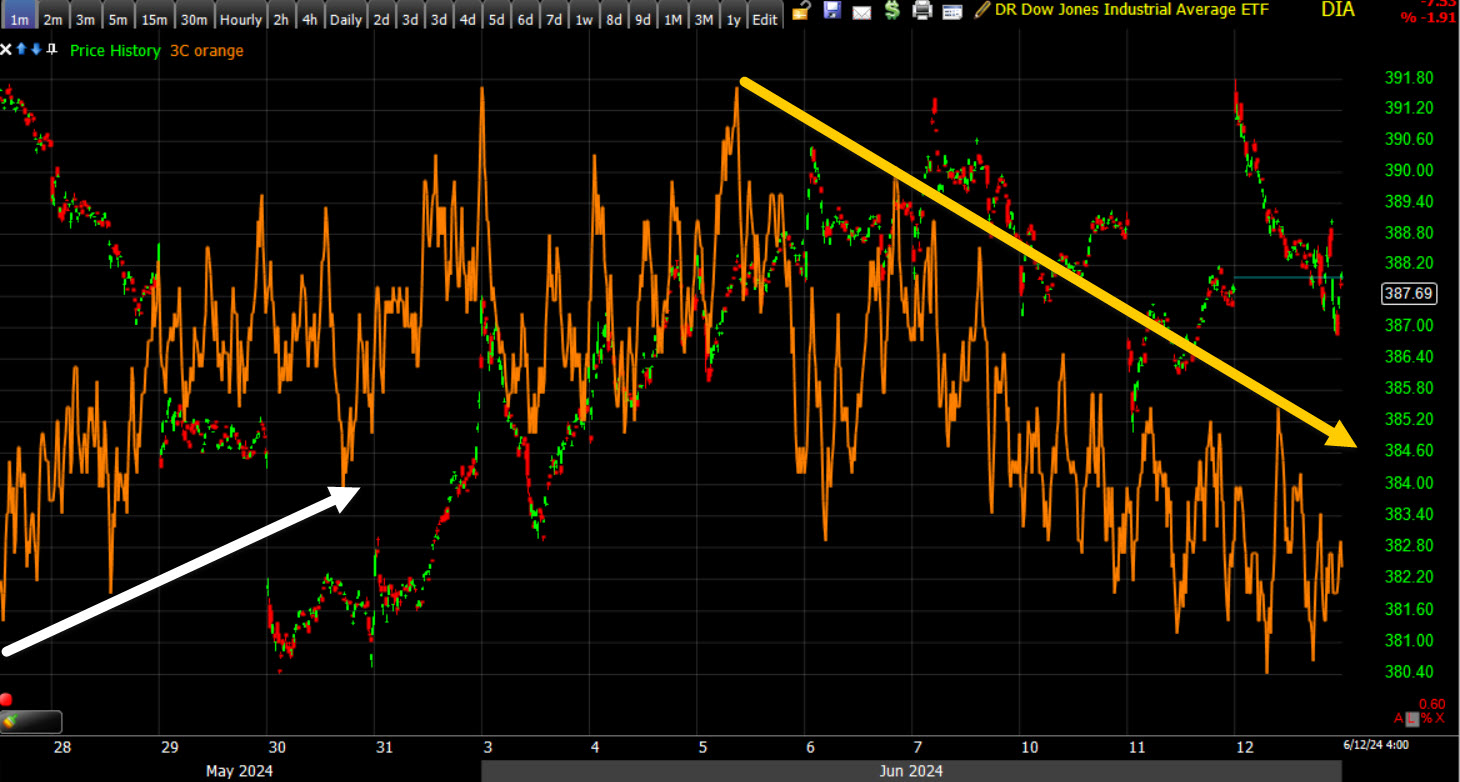 DIA (1m) 3C – with a 3C chart like this, it’s no wonder the Dow gave back all of its early gains.
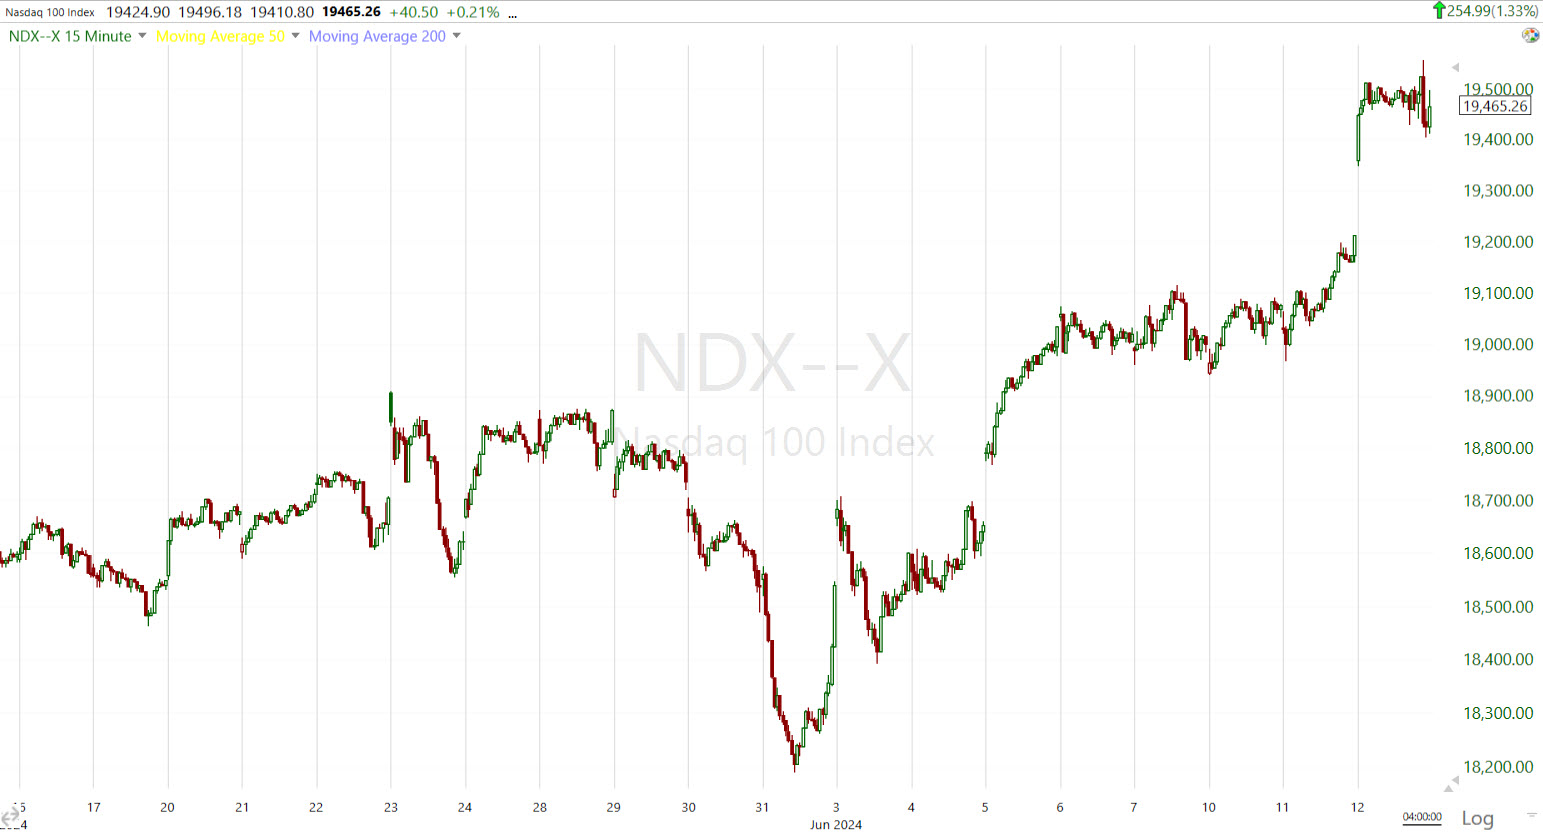 NASDAQ-100 (15m) with a new high.
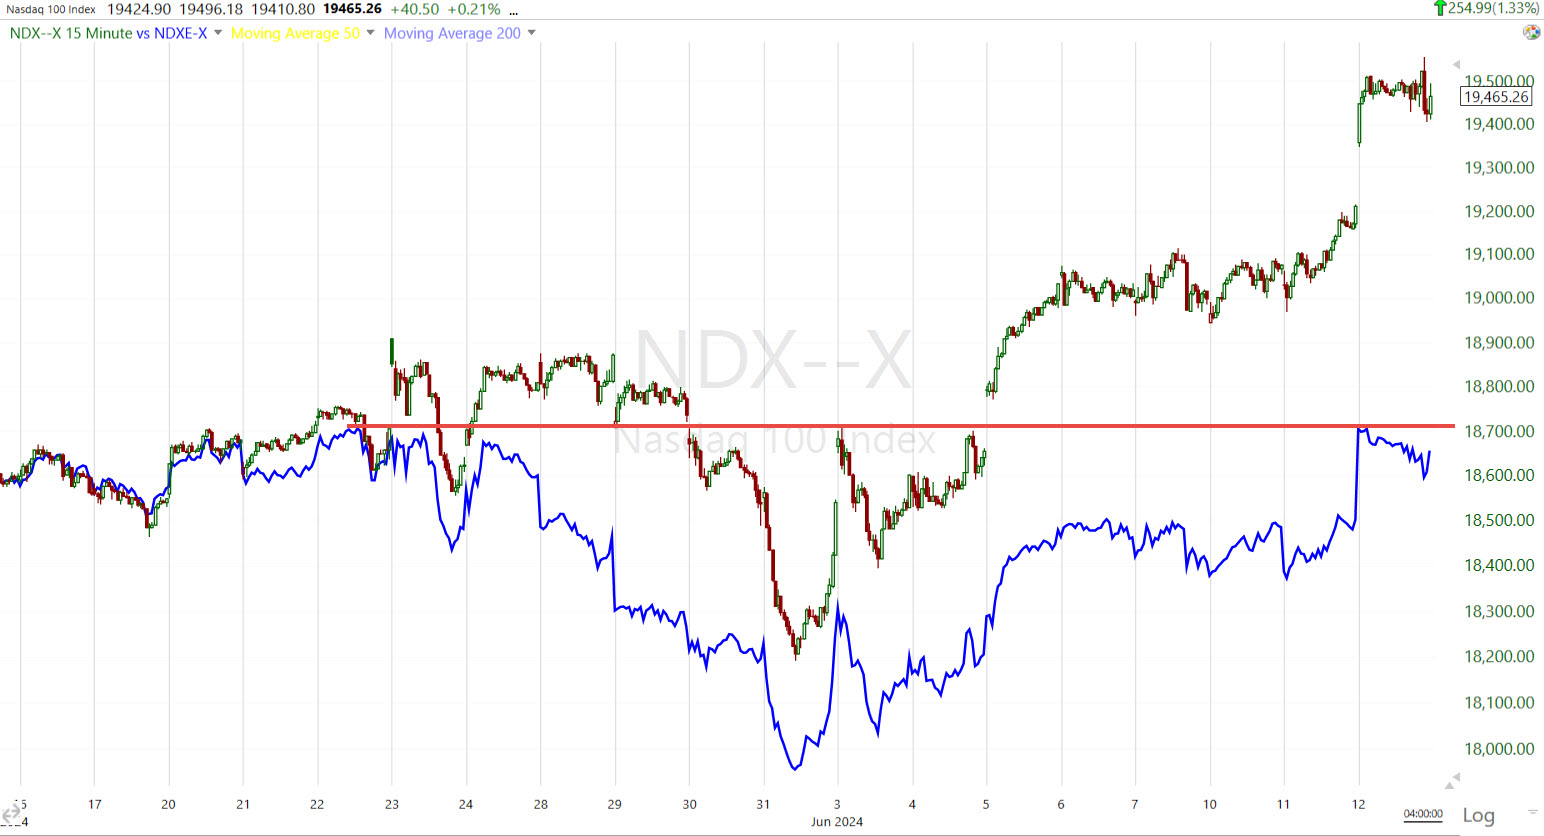 NASDAQ-100 (15m) and the NASDAQ-100 Equal Weight Index (blue) which has not made a higher high since late May. This tells us that fewer and fewer NASDAQ-100 stocks are participating in the upside gains.
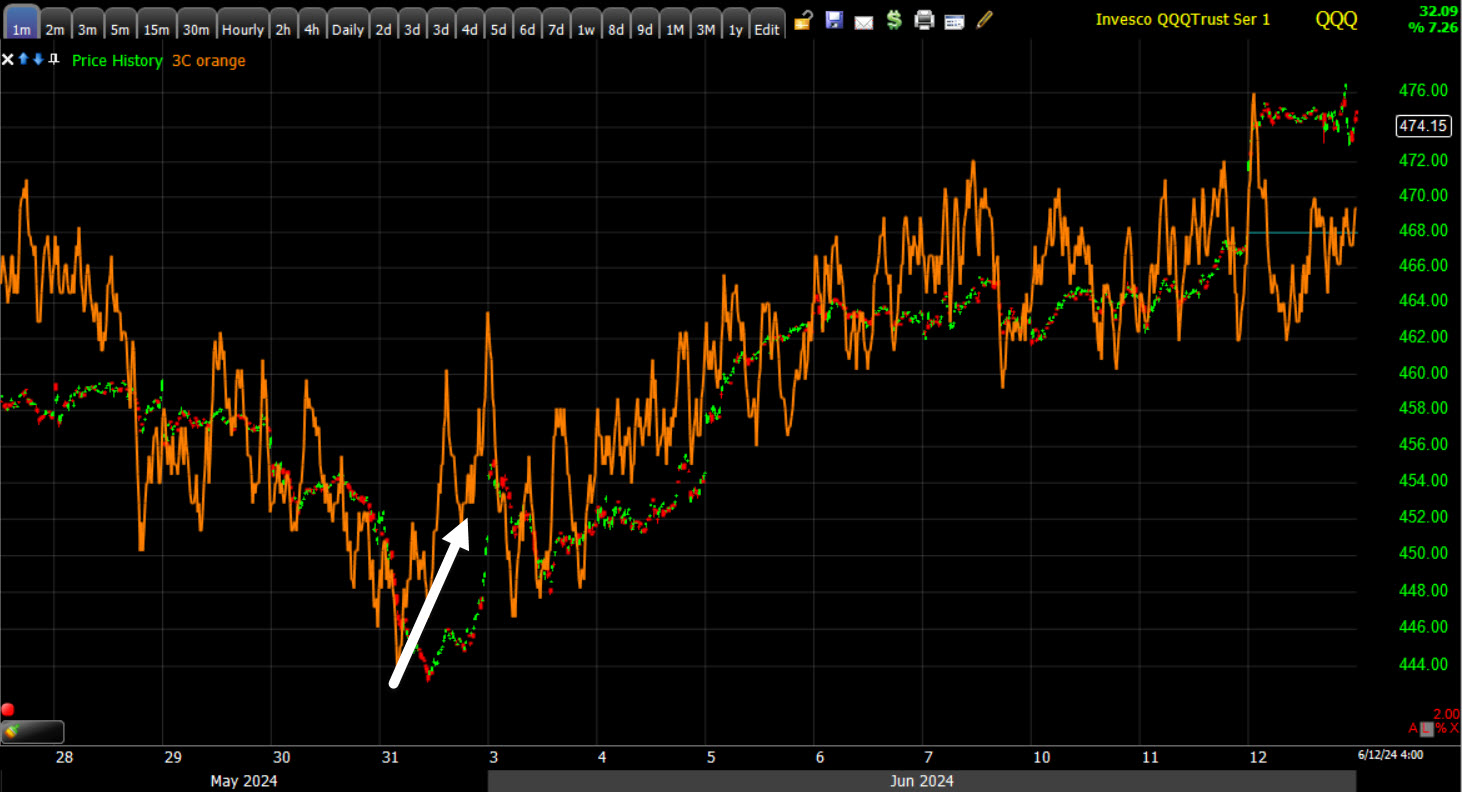 QQQ (1m) 3C has the best confirmation on short-term timeframes for June.
![]() Dow Transports (15m) Also trading in something akin to a large bear flag. The afternoon decline left a bearish Shooting Star on the daily chart.
Dow Transports (15m) Also trading in something akin to a large bear flag. The afternoon decline left a bearish Shooting Star on the daily chart.
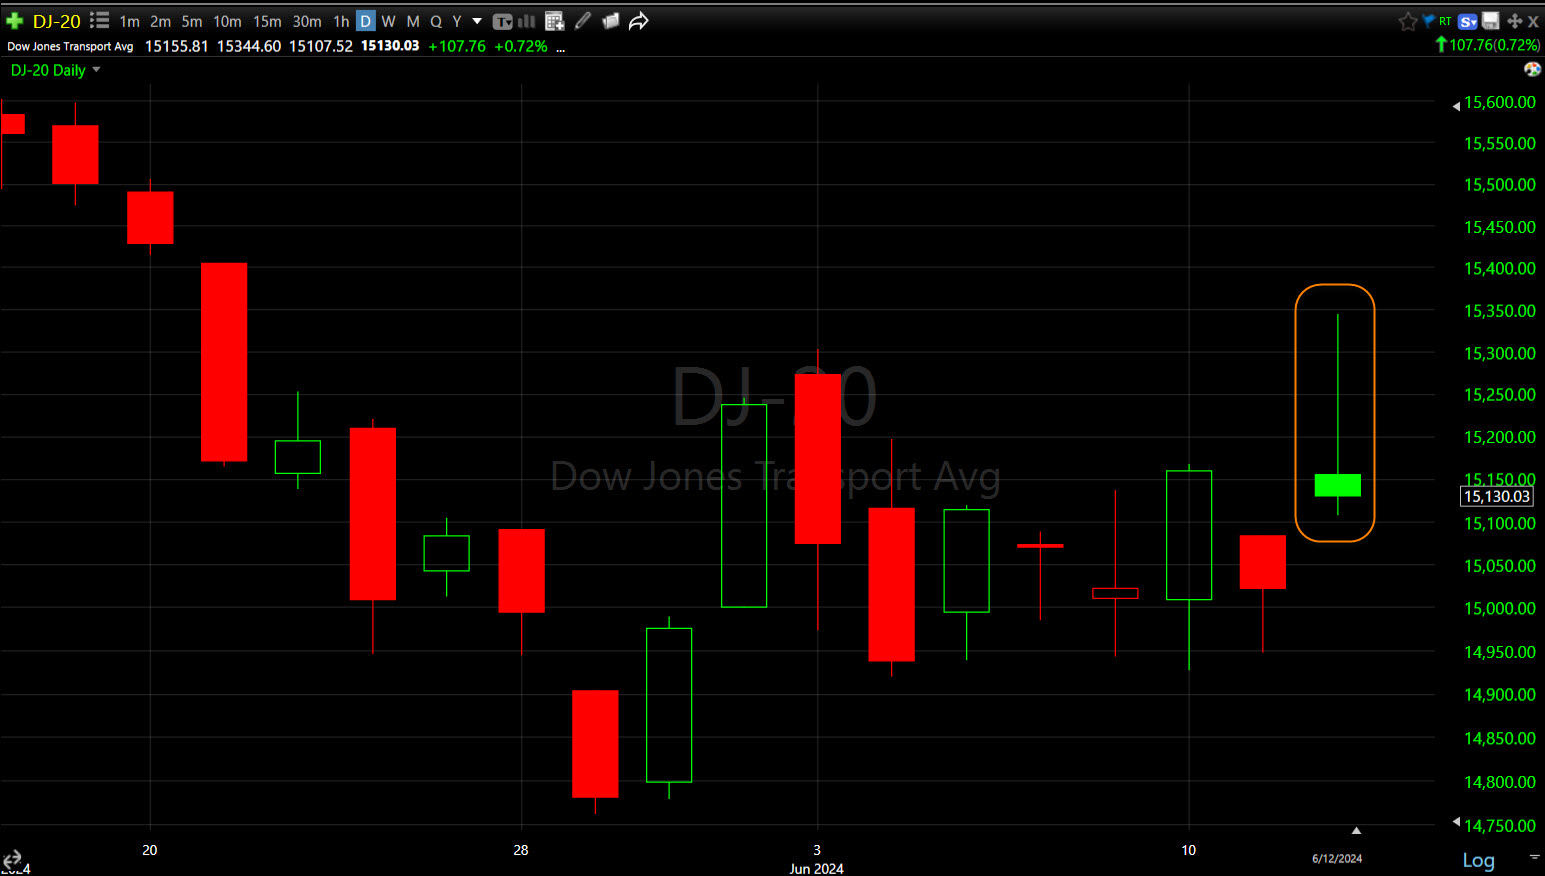 Dow Transports (daily) bearish Shooting Star
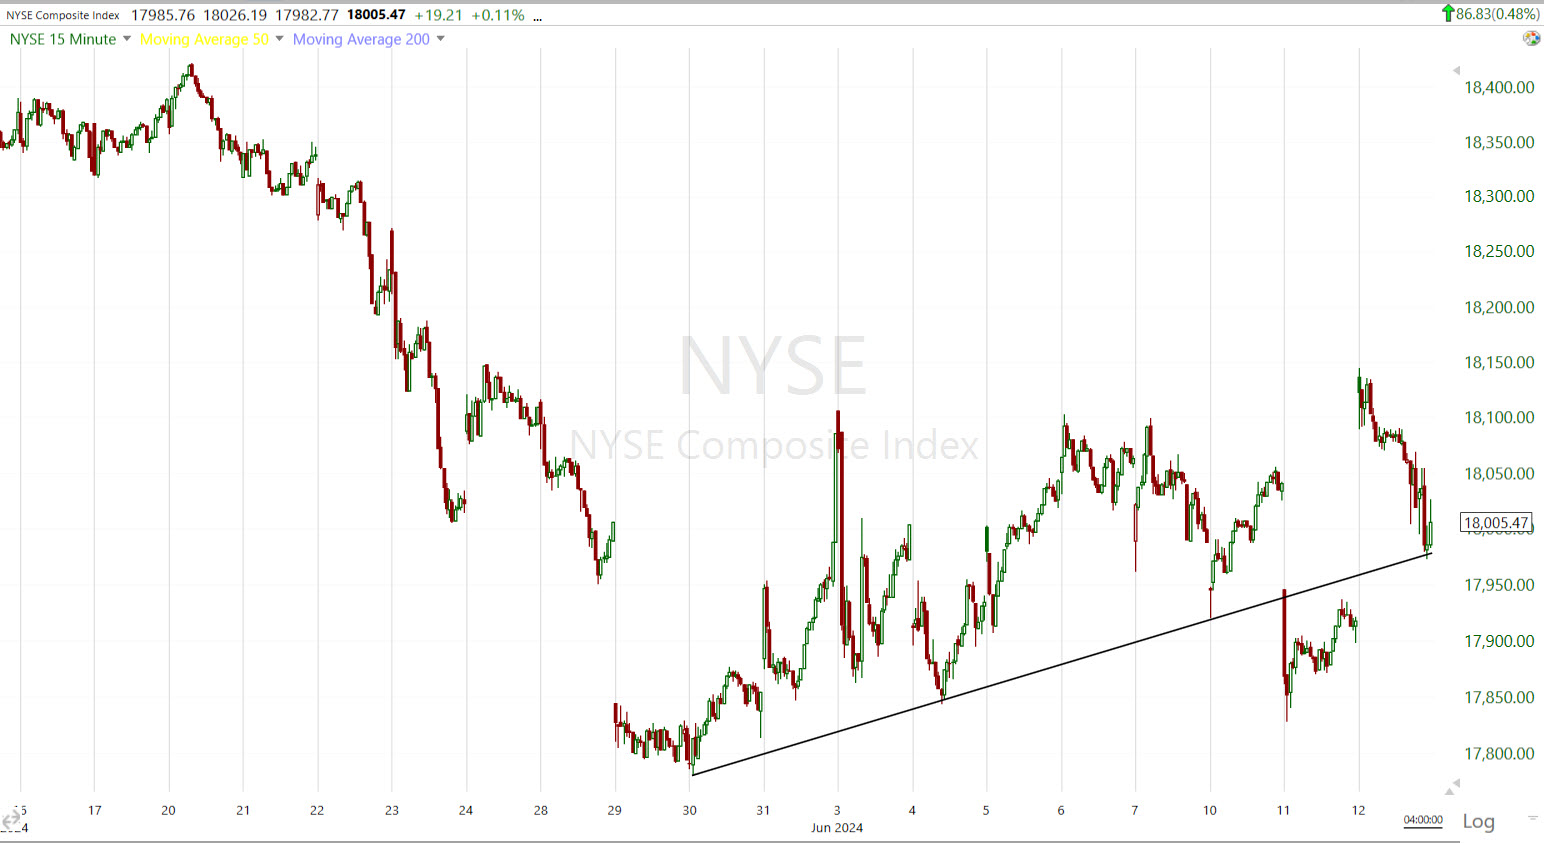 NYSE Index (15) – Another index trading in something akin to a large bear flag and price action looking very different than that of the SPX & NDX.
By this point, you can probably understand why market breadth is so bad relative to the SPX and NDX’s new highs. The rest of the market looks very, very different in tone – much more bearish.
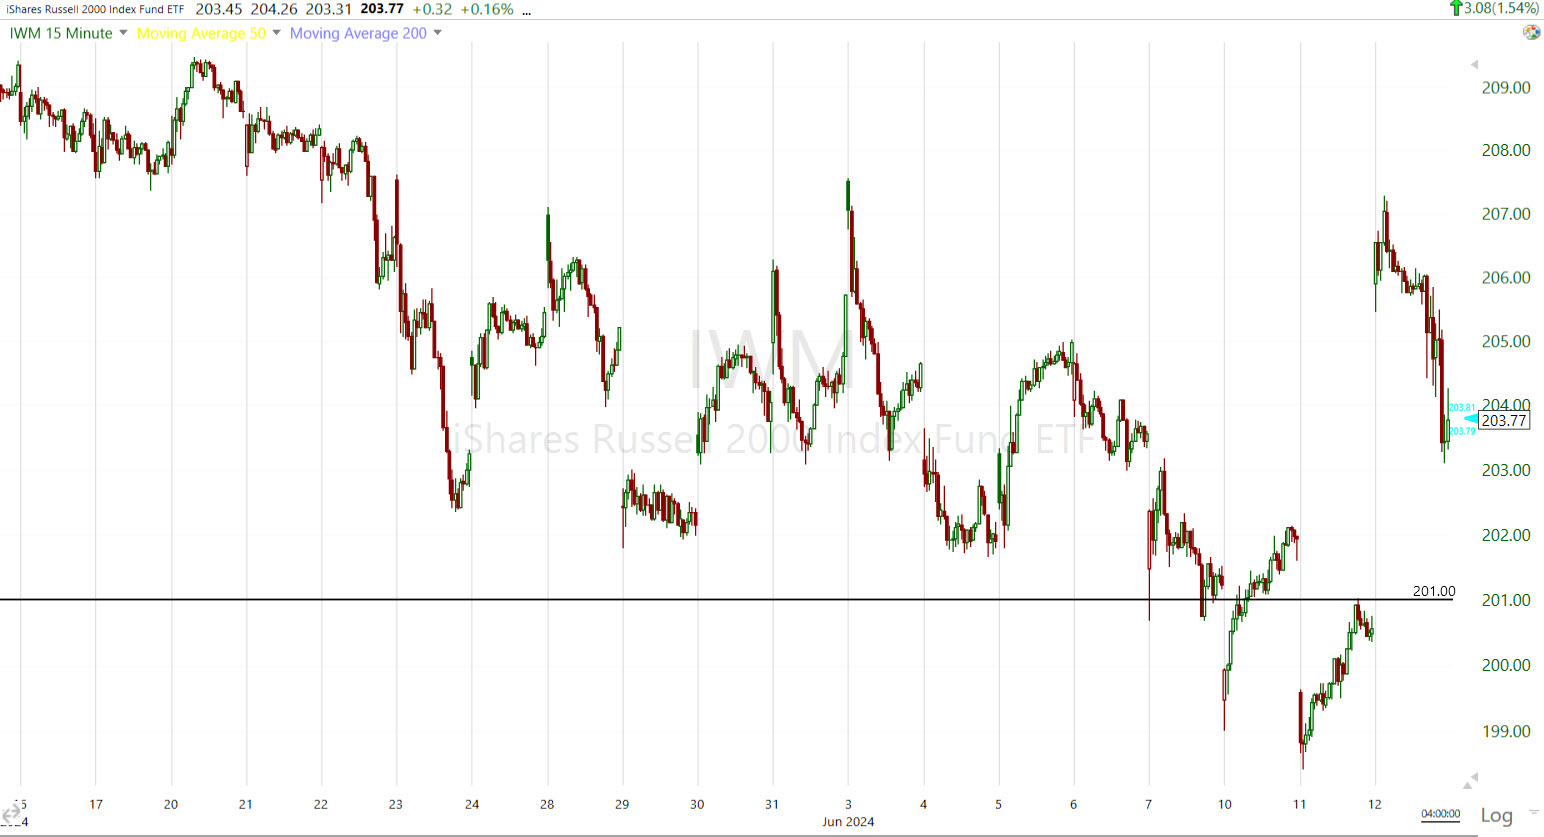 Small Cap IWM (15m) in something of a small downtrend.
Small Caps benefitted from a decent short squeeze this morning in my Most Shorted Index.
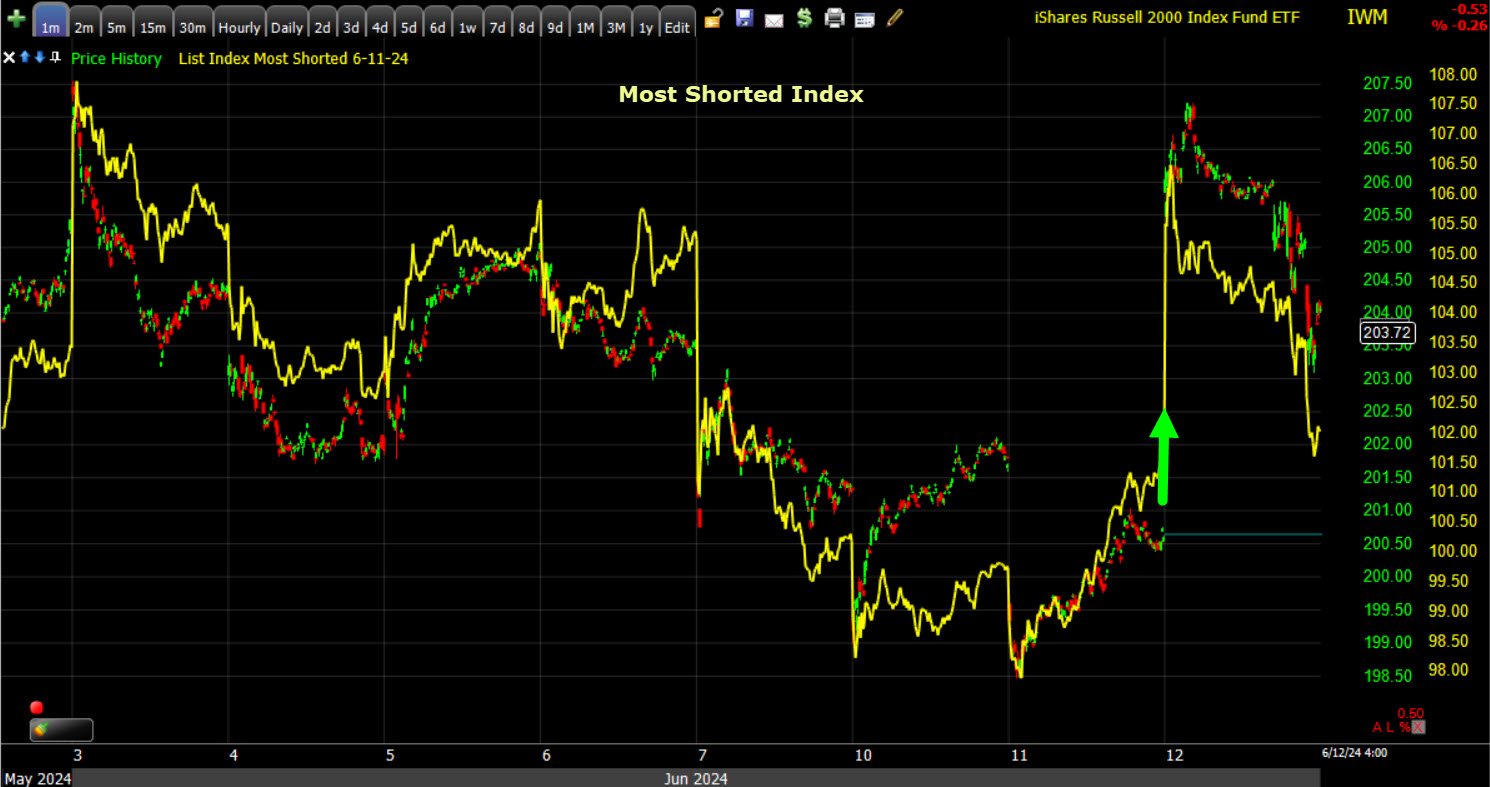
Small Caps and my Most Shorted Index. That’s a decent squeeze for the day, but it’s nothing compared to the short squeezes of November/December.
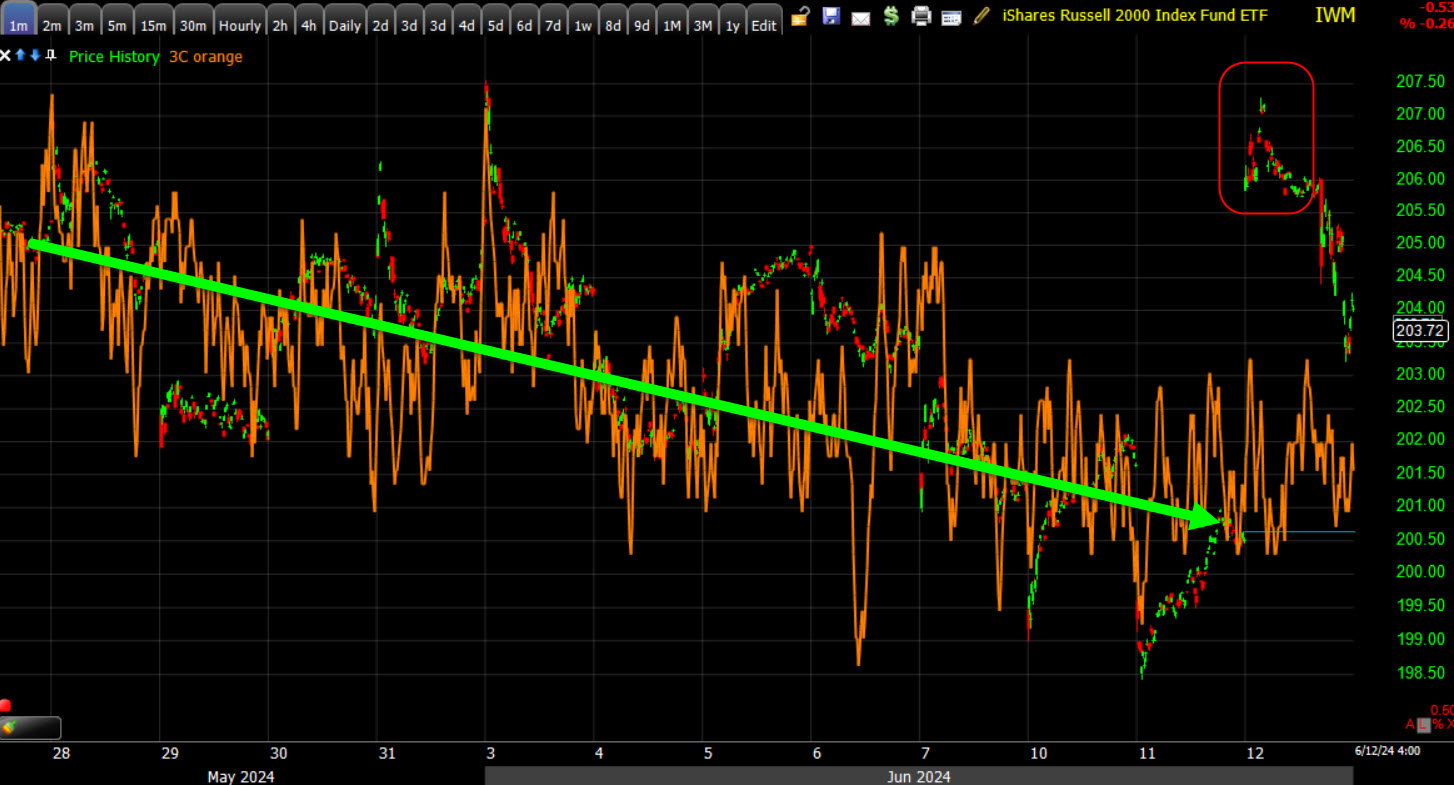
‘IWM’s (1m) 3C chart that’s confirming the general price trend, but did not confirm the early gains this morning, most of which we faded in the afternoon.
For well over a decade, I’ve used Small Caps as a leading indicator for the broader market. they tend to be a better reflection of the economy.
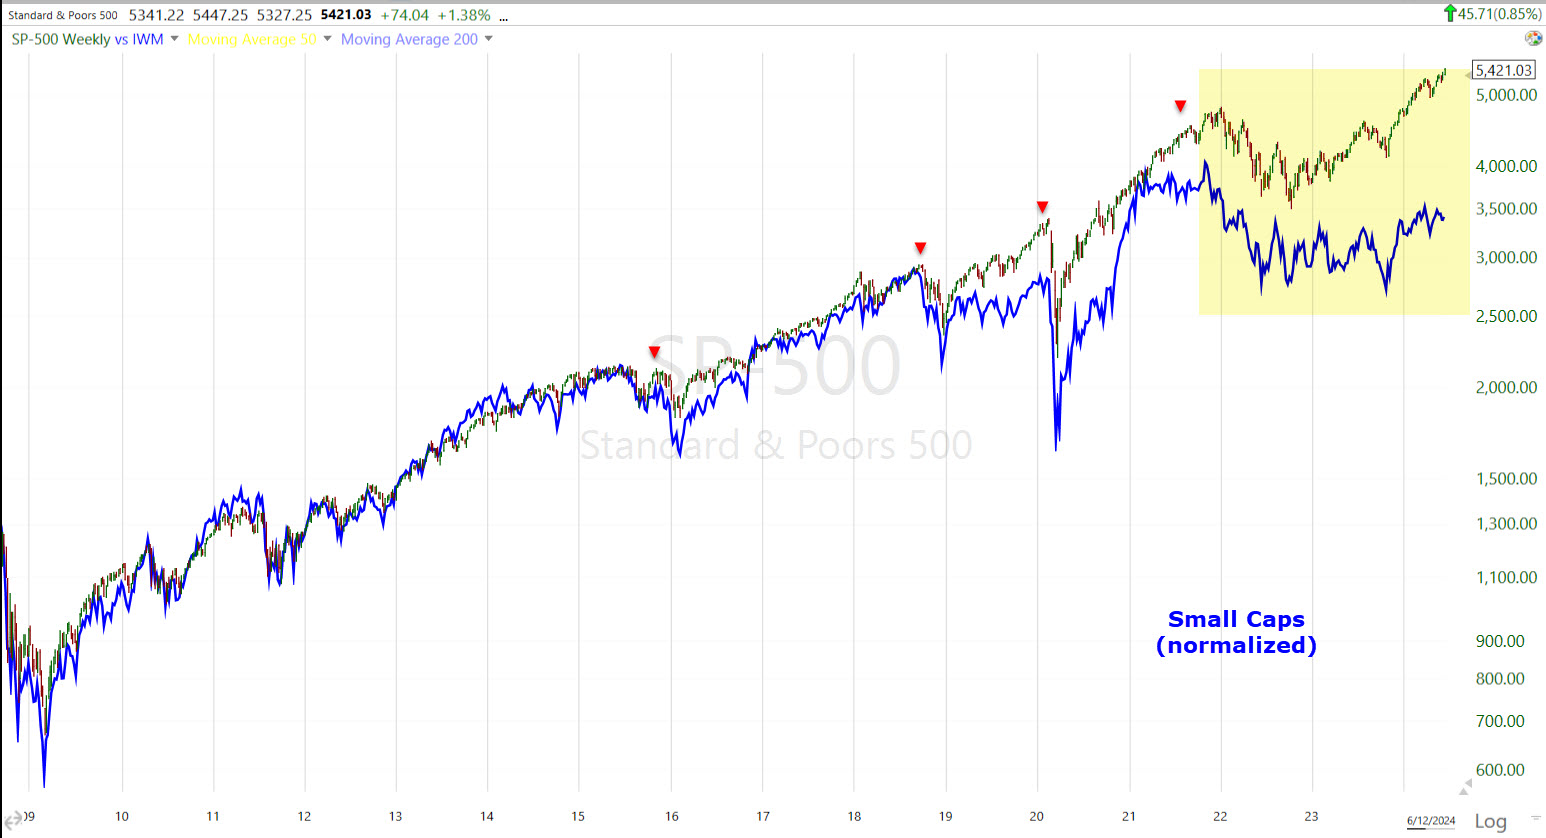 SPX (weekly and normalized from the Financial Crisis low in 2009 to present). When Small Caps diverge from the S&P, they often lead the S&P. What has been happening over the last 2-3 years is not normal.
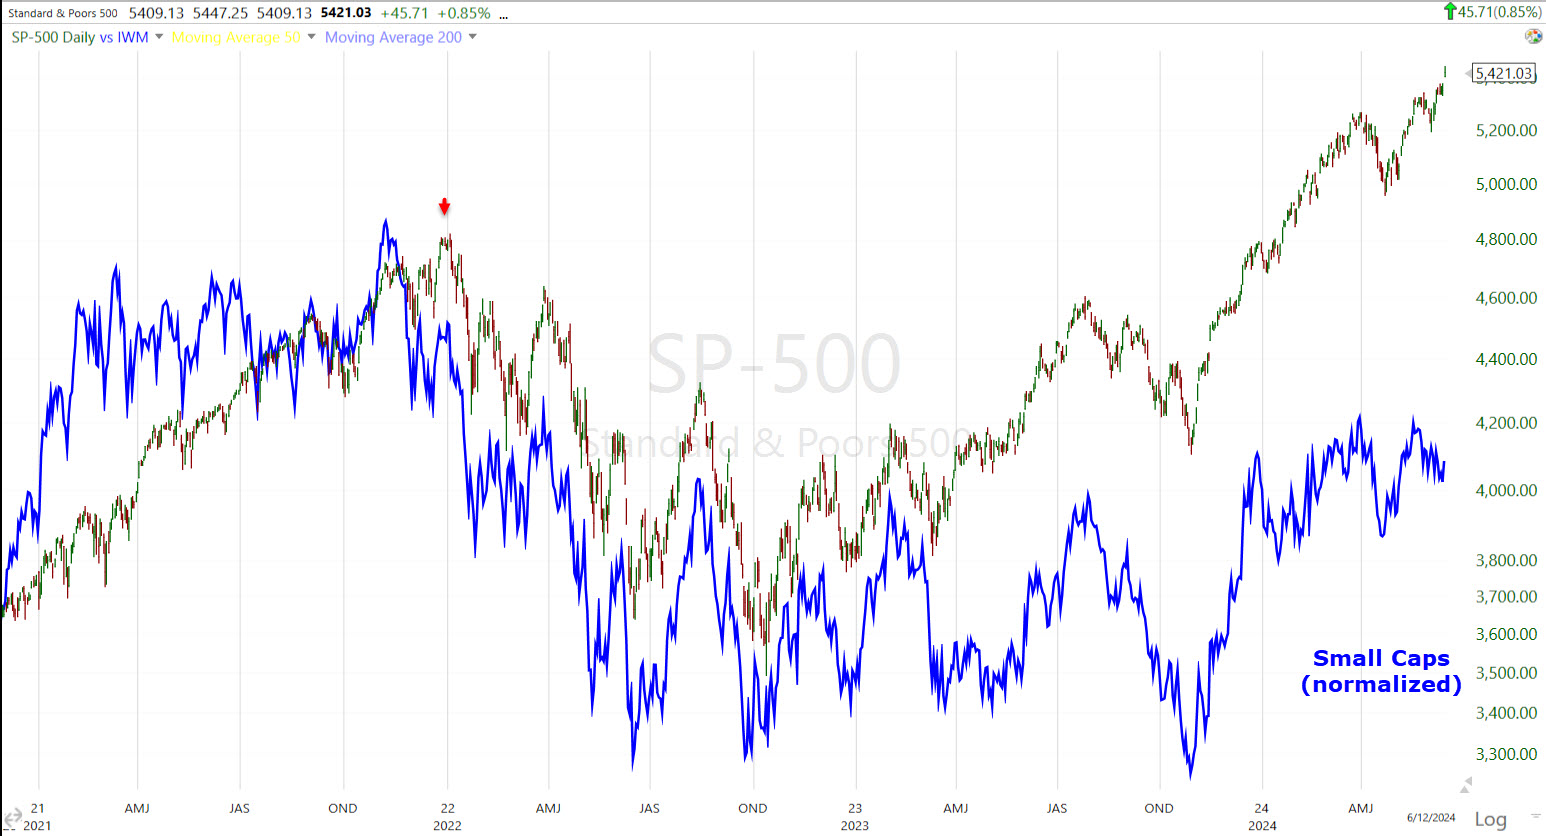 SPX (daily) and Small Caps (blue and normalized) – Again, this is not normal.
VIX (-6.3%) displayed relative weakness, especially after the FOMC as it appears hedges put on ahead of the FOMC, were unwound after the FOMC. VVIX (-2.95%) displayed relative strength on the day, suggesting that tomorrow is a bit more volatile.
The ABI ended lower at 24.
The CBOE SKEW Index (Black Swan Index) is back in the 150’s, indicating institutional hedging of downside risk, or a black swan event.
S&P sectors
Only 5 of 11 sectors closed higher, but the weighty Tech sector was the best performing after stocks like Apple soared on a second day of buybacks. Energy and Consumer Staples were the worst performing.
Mega-caps (MGK +1.35%) soared on the sharp drop in rates after CPI, outperforming the Equal Weight S&P (+0.55%) by 80 basis points. Apple (AAPL +2.9%), NVIDIA (NVDA +3.6%), and Microsoft (MSFT +1.9%) were standouts in the mega-caps, but the top performing Tech sector component was Oracle (ORCL +13.3%), which jumped +13% on quarterly results and guidance.
Semiconductors (SOX +2.9%) also outperformed with 25 of 27 component stocks ending higher.
Materials ⇧ 0.17 %
Energy ⇩ -1.07 %
Financials ⇩ -0.10 %
Industrial ⇧ 0.95 %
Technology ⇧ 2.21 %
Consumer Staples ⇩ -1.10 %
Utilities ⇩ -0.65 %
Health Care ⇩ -0.21 %
Consumer Discretionary ⇧ 1.04 %
Real Estate ⇧ 0.71 %
Communications ⇩ -0.21 %
Apple (AAPL +2.85%) saw a second day of buybacks at the open. Apple authorized $110 bln in buybacks in May and has added about $430 bln in market cap over the last 2 days in what appears to me to be an effort to make the WWDC, which wasn’t well received, look better than it actually was.
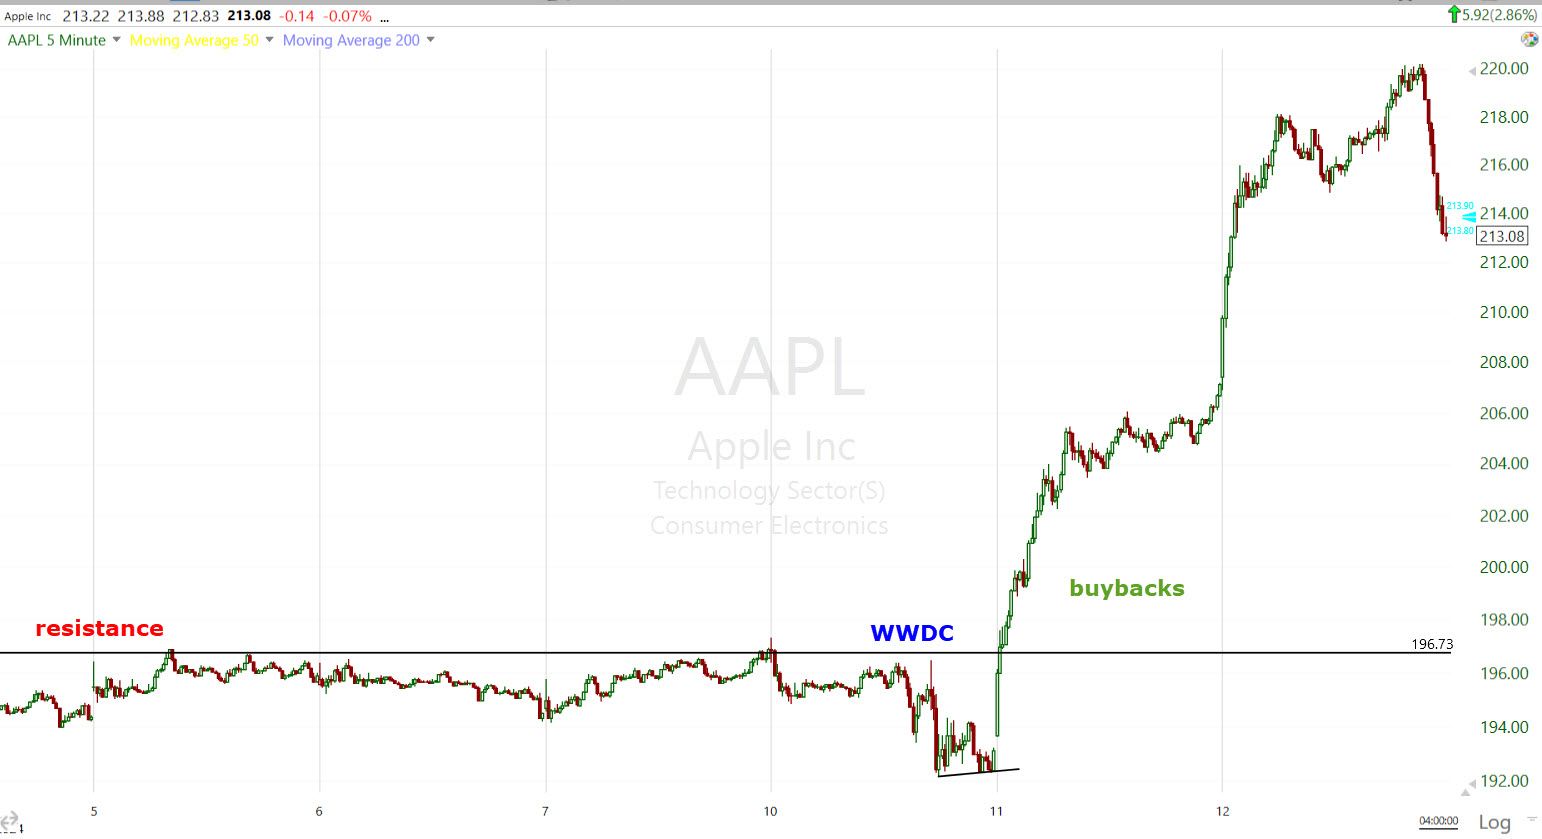 AAPL (5m)
From Goldman’s trading desk:
Our buyback desk is currently running at 1.6x ytd daily avg notional executed. Extrapolate this to the entire street pacing at over $7b of vwap type of demand today. The biggest are getting bigger.
Internals
Advancers (1934) have a 2-to-1 edge over Decliners (930). Volume picked up to 922 mln shares.
However, there was no Dominant price/volume relationship except the Dow at Close Down/Volume Up. Being there was no dominant relationship and S&P sectors did not have a strong majority of sectors closing higher or lower, there are no 1-day overbought internals.
Treasuries
Yields were down sharply at the open after a much cooler than expected Consumer Price Index (CPI), but yields retraced some of the CPI losses after a more hawkish Fed than expected.
The 10-yr yield fell 11 basis points to 4.30%, but finished off the lows of the day after the hawkish Fed. The 10-yr was as low as 4.25%.
The 2-yr yield, which is most sensitive to changes in the fed funds rate, fell eight basis points to 4.75%, but the 2-yr was as low as 4.67% earlier.
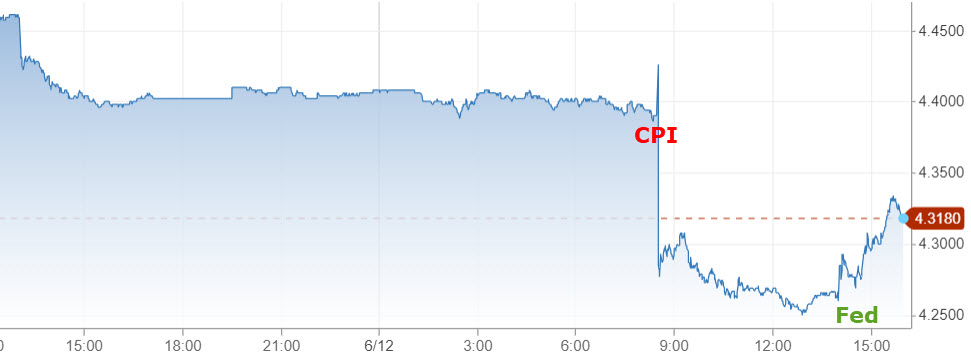
10-yr yield
The fed funds futures market is now pricing in a 63.3% probability of a 25 basis points rate cut at the September FOMC meeting versus a 52.8% probability yesterday.
Currencies and Commodities
The U.S. Dollar Index ended the day lower, but reversed much of the early CPI losses after the hawkish dots in the SEP.
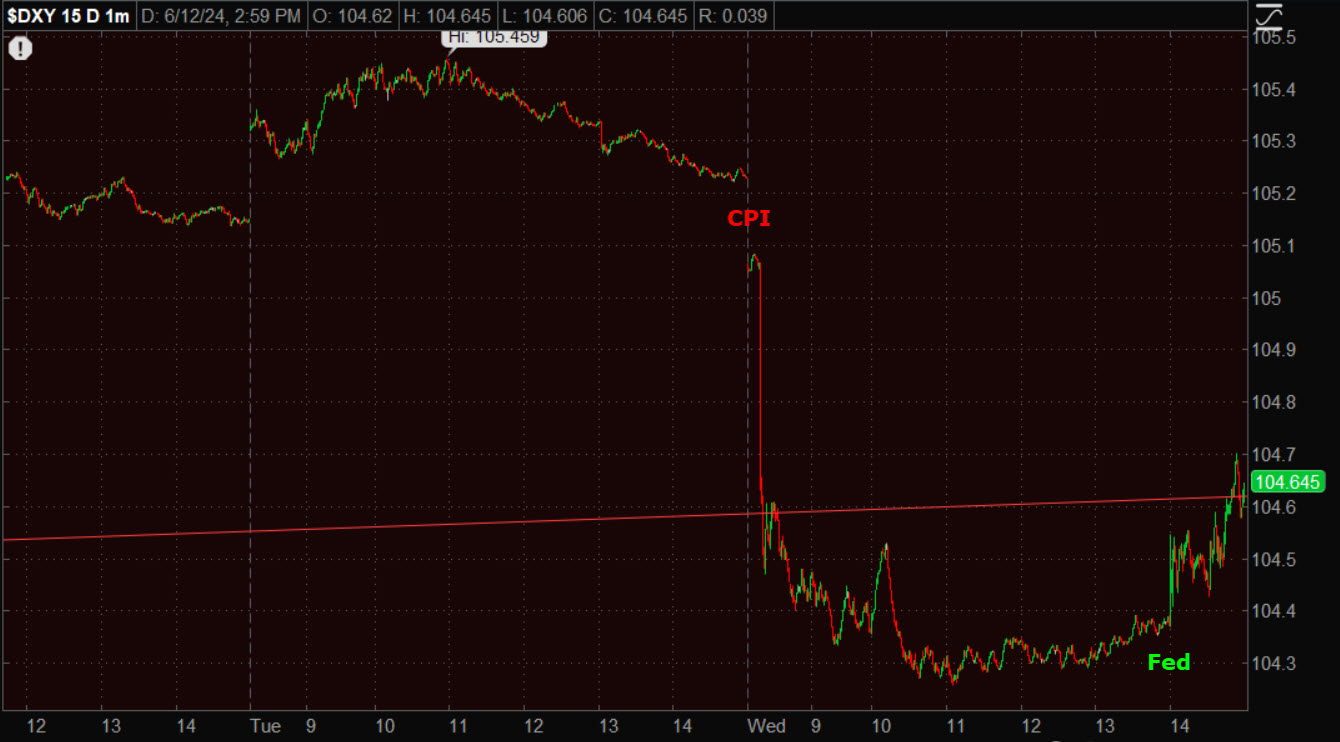 U.S. Dollar Index (1m) – the Dollar managed to hold the YTD up-trend.
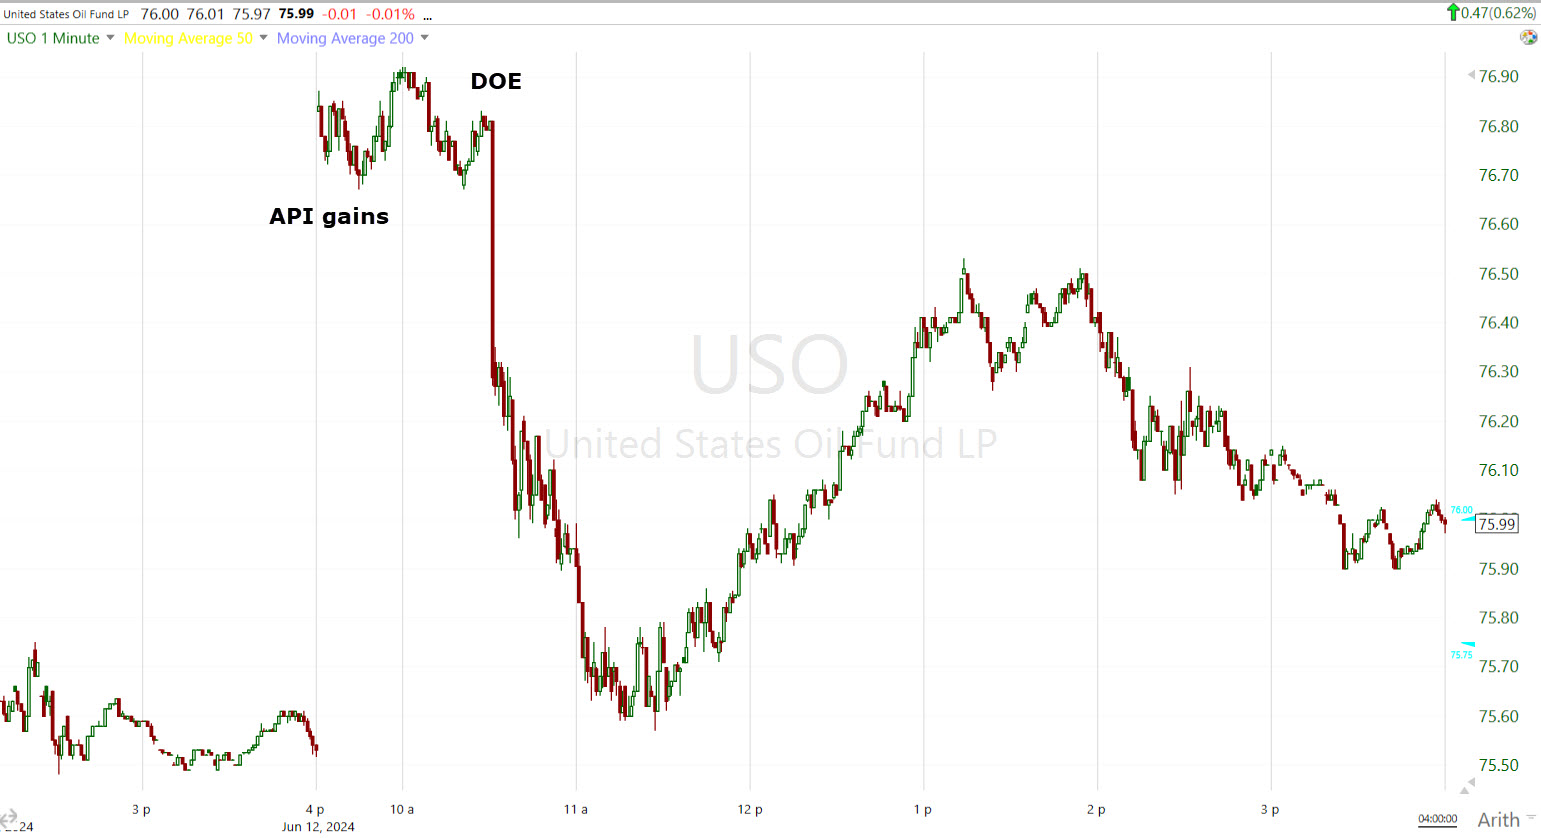
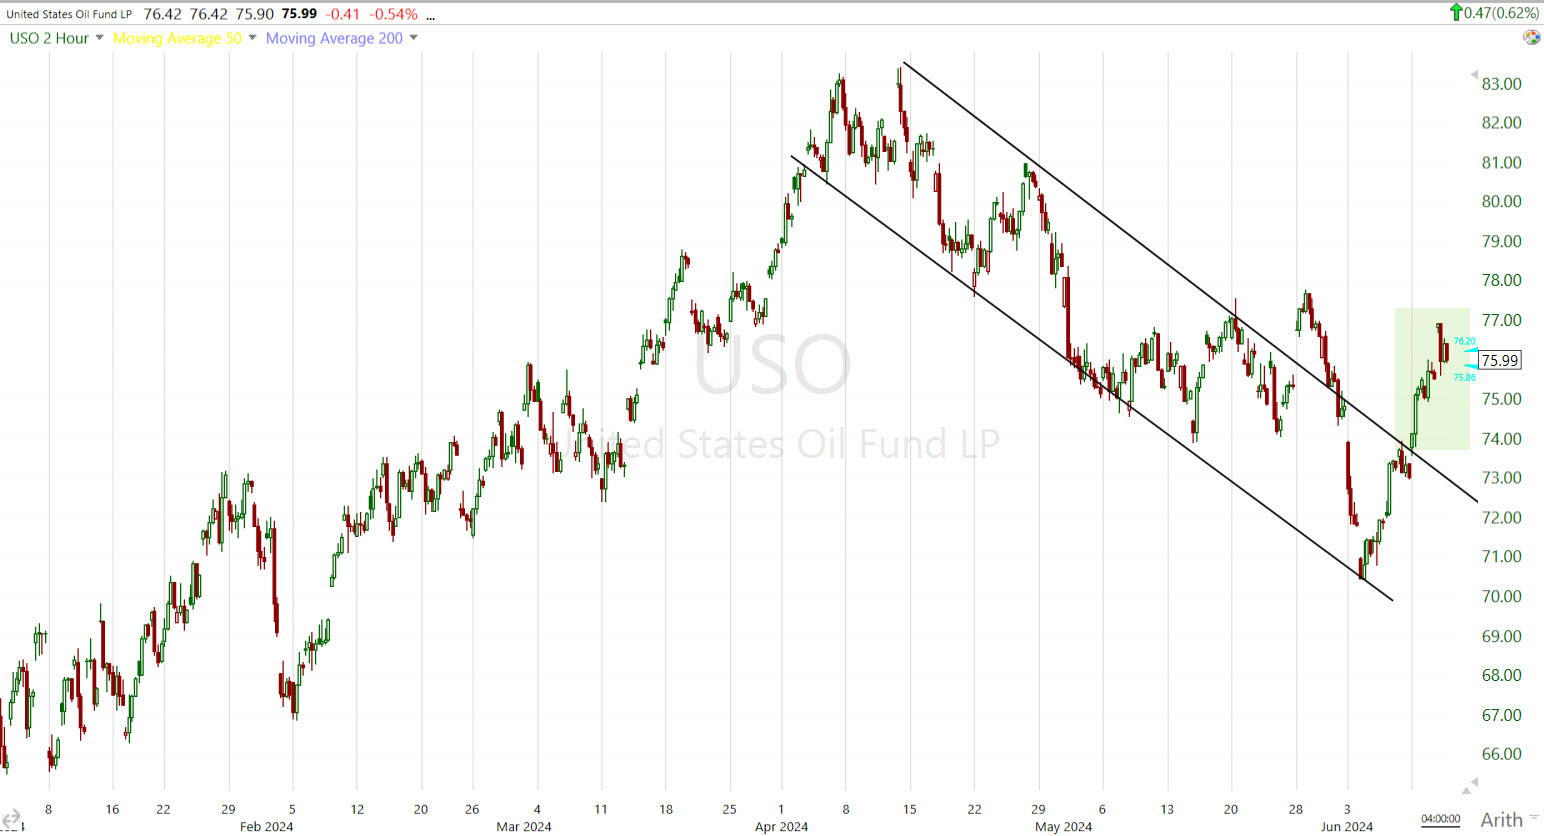
WTI Crude oil ended higher on the day, but off the highs above $79 after falling on the DOE inventory builds, and retracing last night’s API crude draw gains.
Gold was unchanged on the day, having jumped on the cooler than expected CPI, and fading gains on the hawkish Fed Dots.
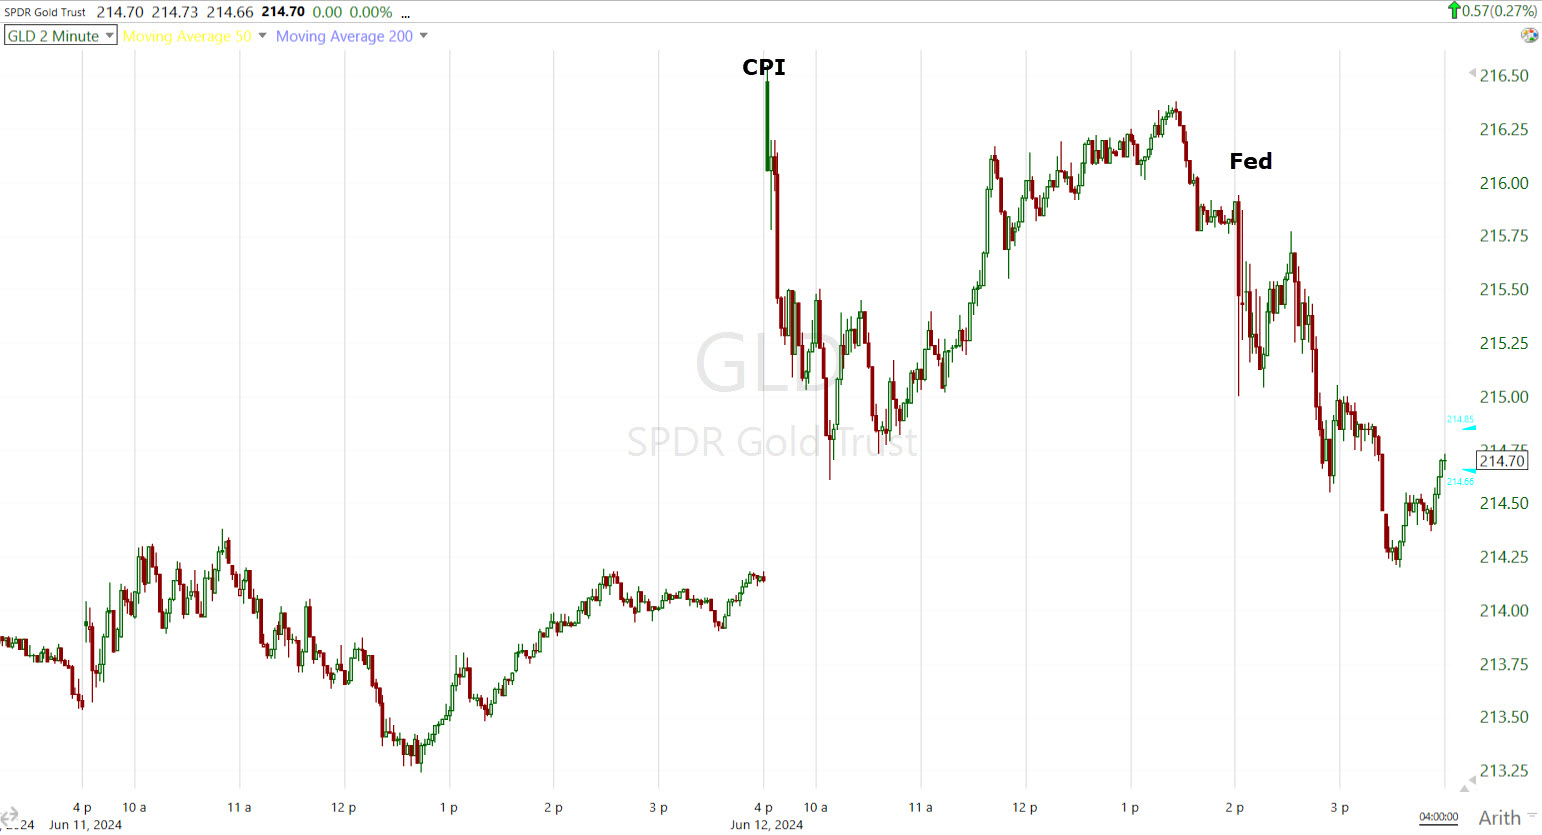
Gold/GLD (2m)
Bitcoin jumped on the cool CPI, but reversed all gains after the hawkish Dot-Plot from the Fed.
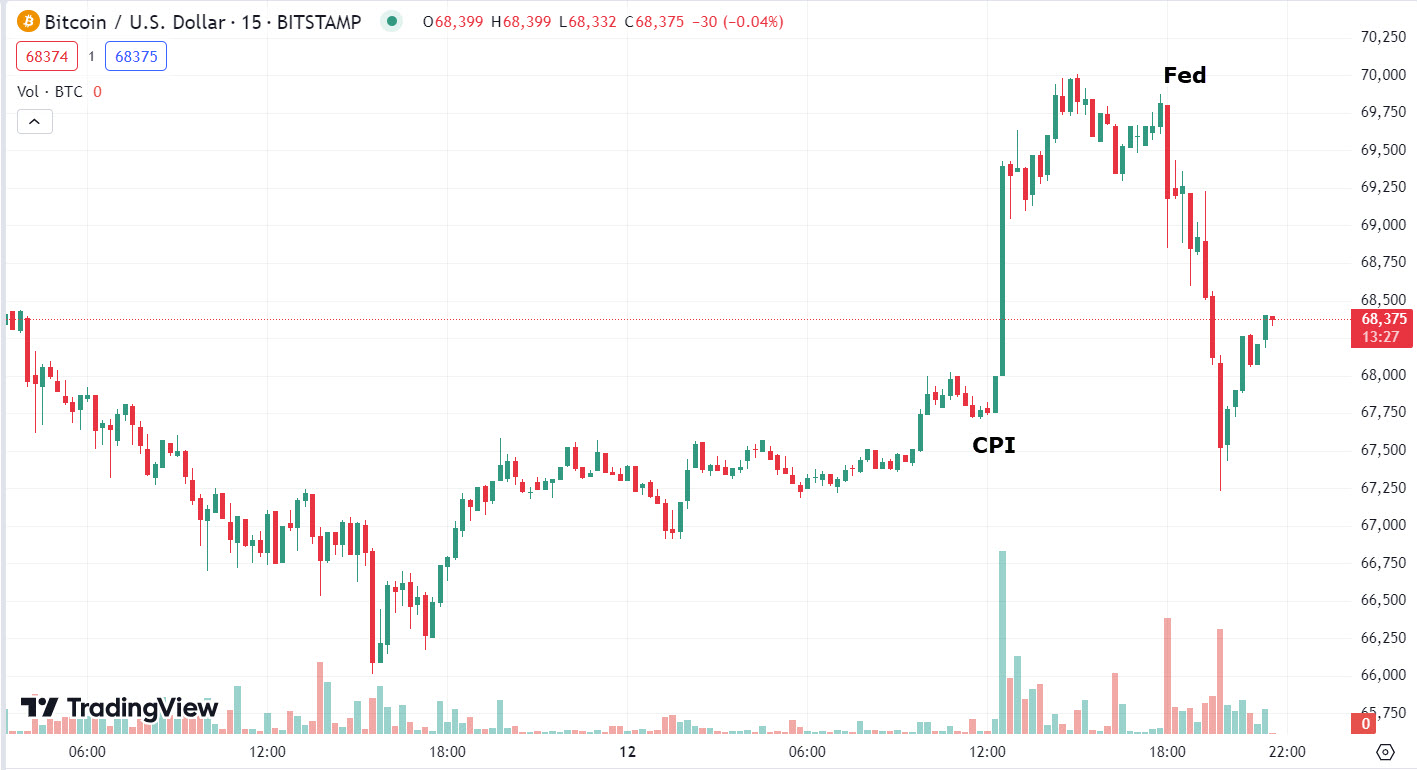
BTC/USD (15m)
As one of the most speculative risk assets, I imagine stocks will retrace much of today’s gains too as the reality of the hawkish Fed dot-plot sets in.
Summary
The market started the year with 7 rate cuts priced in. The March FOMC SEP said 3 rate cuts and today’s SEP lowered it to 1 rate cut. Inflation is obviously running hotter and stickier than hoped, and the Fed seems to be particularly concerned about wage gains, which came in double consensus with last week’s Payrolls report. This is one reason I’m so focused on what oil prices do. Jeff Gundlach was speaking on CNBC after the Fed and believes the Biden administration is going to make a big effort to get oil prices down before the elections. I think they remain key in what rates do next.
Hard economic data (red) is breaking down and diverging with the stock market (green), which suggests that the long and variable lag of rate hikes is finally hitting the economy.

Source: Bloomberg
There’s a long, or what the Fed describes as a “long and variable lag” to monetary policy. I’ve read Fed studies that rate hikes (or cuts) take 16 to 24 months to filter through the economy. The rate hike cycle began in March of 2022 and ended August of 2023. A surprise was just how much fiscal spending from the government offset the Fed’s tightening. Still, it’s not too surprising that hard economic data is starting to roll over now.
Meanwhile, we have a market that’s still acting like a soft-landing or no landing (no recession) is the base case. This base case counted on inflation coming down sharply enough that the Fed could cut rates aggressively BEFORE the rate hikes started hitting the economy as we are starting to see now with hard data starting to plunge.
There are very few rate hike cycles, especially as aggressive as this one, that haven’t led to recessions.
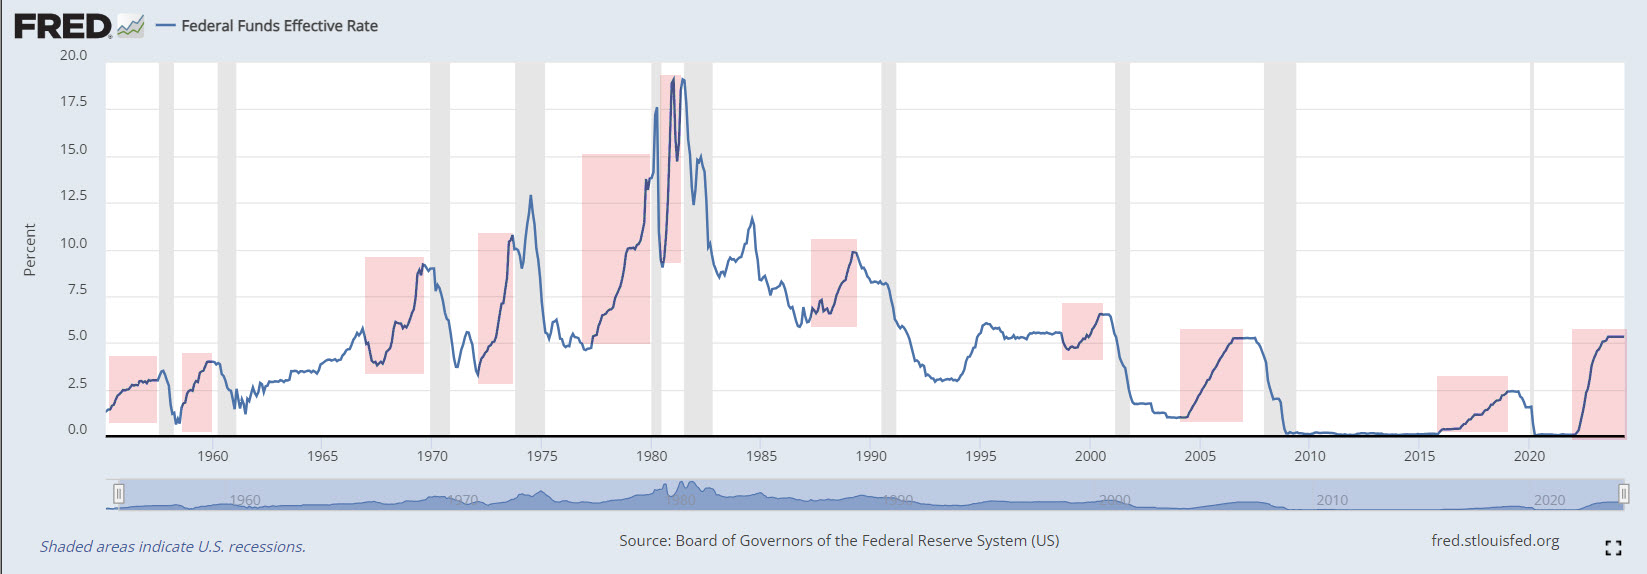 Fed Funds Rate and rate hike cycles (red) leading to recessions (gray). There always seems to be a hope or narrative from the market that, “This time is different”, but probabilities show that that’s rarely the case.
In the meantime, when I look under the hood of the market, it’s bad and getting worse. I’m sure AI is going to be a gamechanger, but it’s very early days and I doubt very much that AI is going to increase productivity before the next recession. I’ve seen very similar situations in which a handful of mega-caps support rallies a number of times, while most stocks in the market turn south and underperform. In every instance I recall, the mega-caps eventually gave way too. When market breadth gets bad, it’s just a matter of time, and market breadth is getting real bad.
As for the near term, tomorrow we get the Producer Price Index. It’s not as influential as the Consumer Price Index this morning, but my guess is that within a few days the market takes in the fact that the Fed just went from 3 rate cuts to 1 and the soft landing or no landing idea starts to wither on the vine. Everything about today’s FOMC was hawkish. Even Powell’s press conference wasn’t his usual dovish walk back of the hawkish FOMC. My guess is that the market starts to get realistic about what happened today, and starts to price it in soon.
Overnight
S&P futures are up +0.15%. 3C charts are negatively divergent on a number of timeframes. I’m a little surprised the S&P and NDX held p as well as they did this afternoon post FOMC. Here are a few examples…
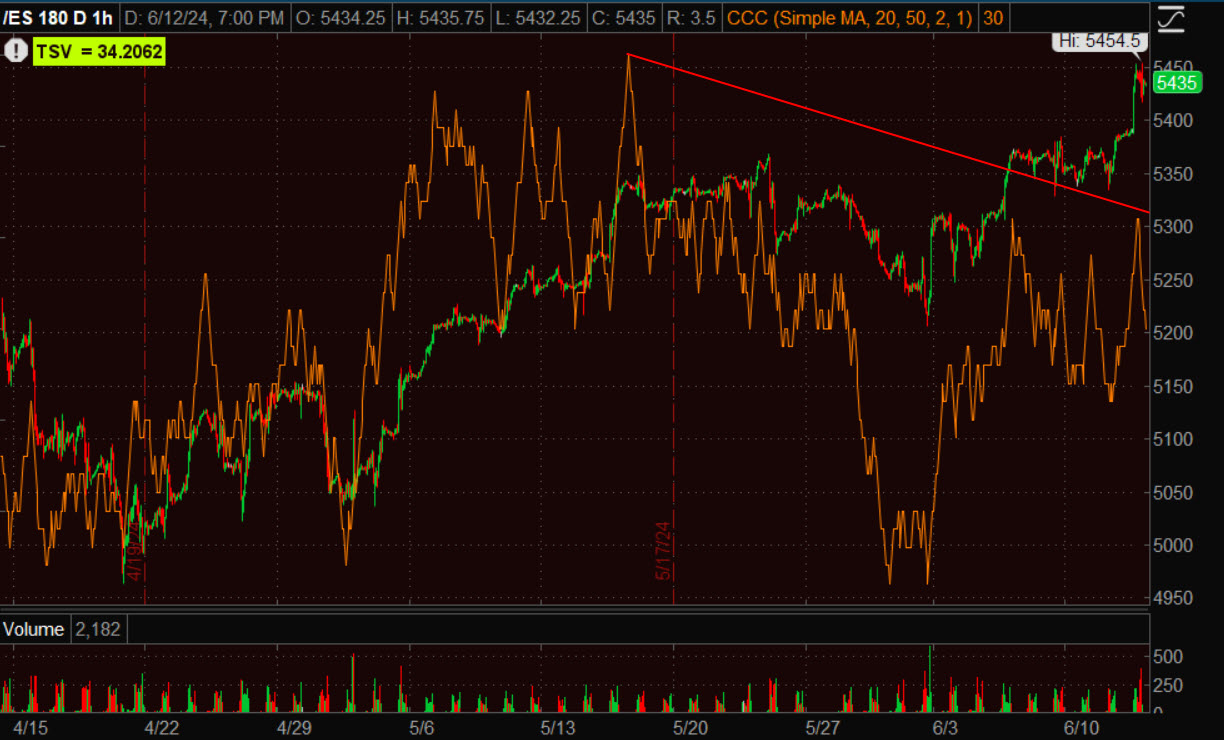 ES (60m) relative negative divergence.
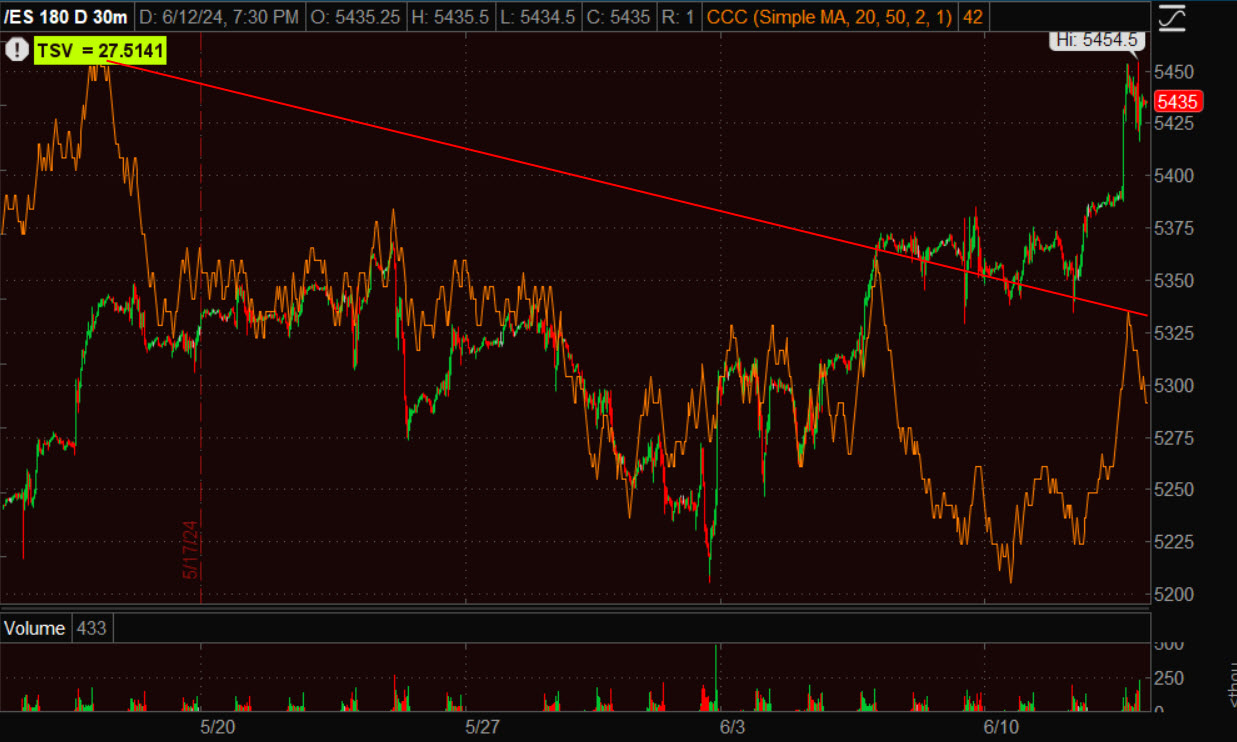 ES (30m) relative negative divergence.
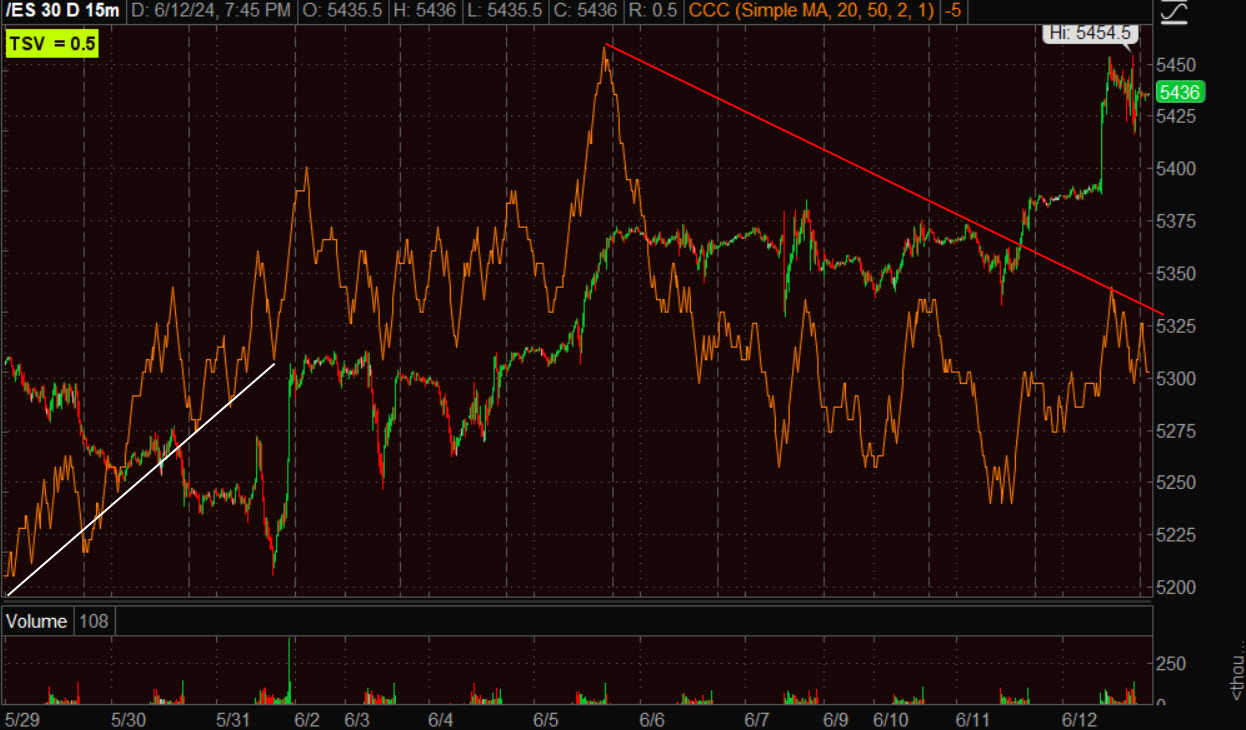 ES (15m) with a positive divergence at the May 31st pivot low and a relative negative divergence after.
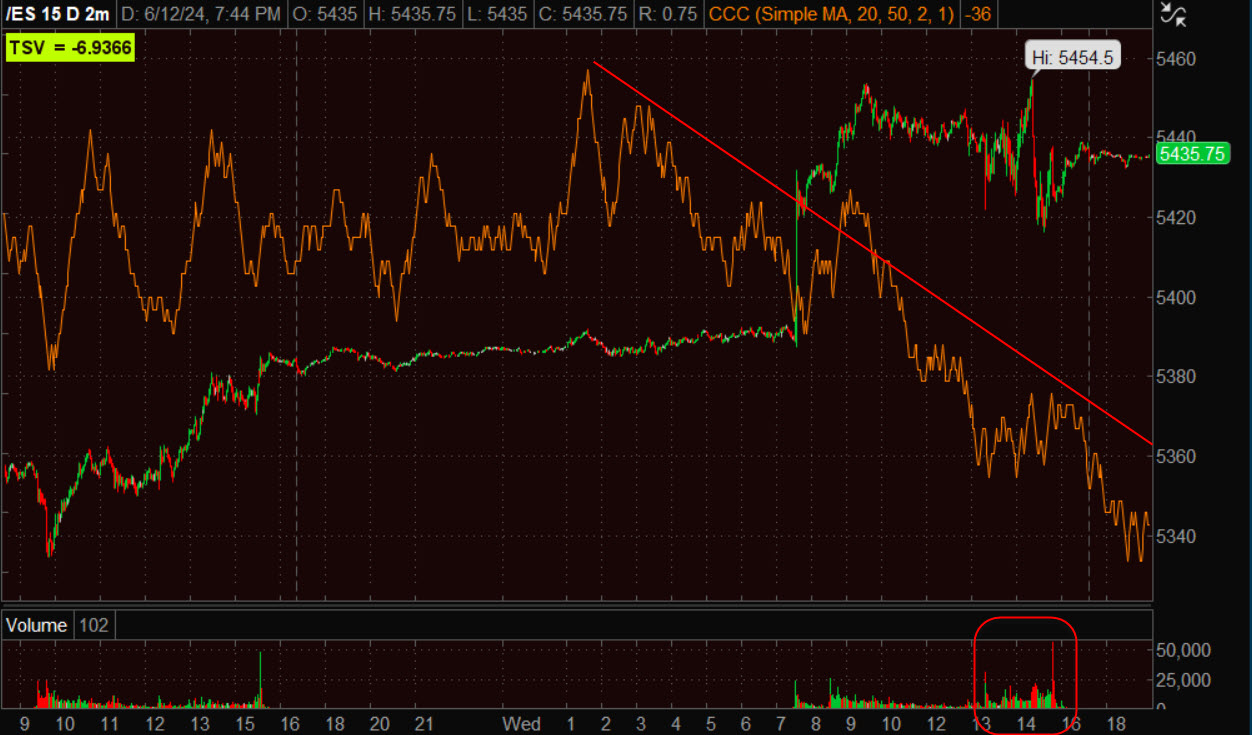 ES (3m) relative negative divergence. Also notice the heavy sell-side volume after the FOMC.
NASDAQ-100 futures are up +0.5%. Like the cash market, NQ’s 3C chart has better confirmation than ES/SPX, but not perfect, especially into today’s gain.
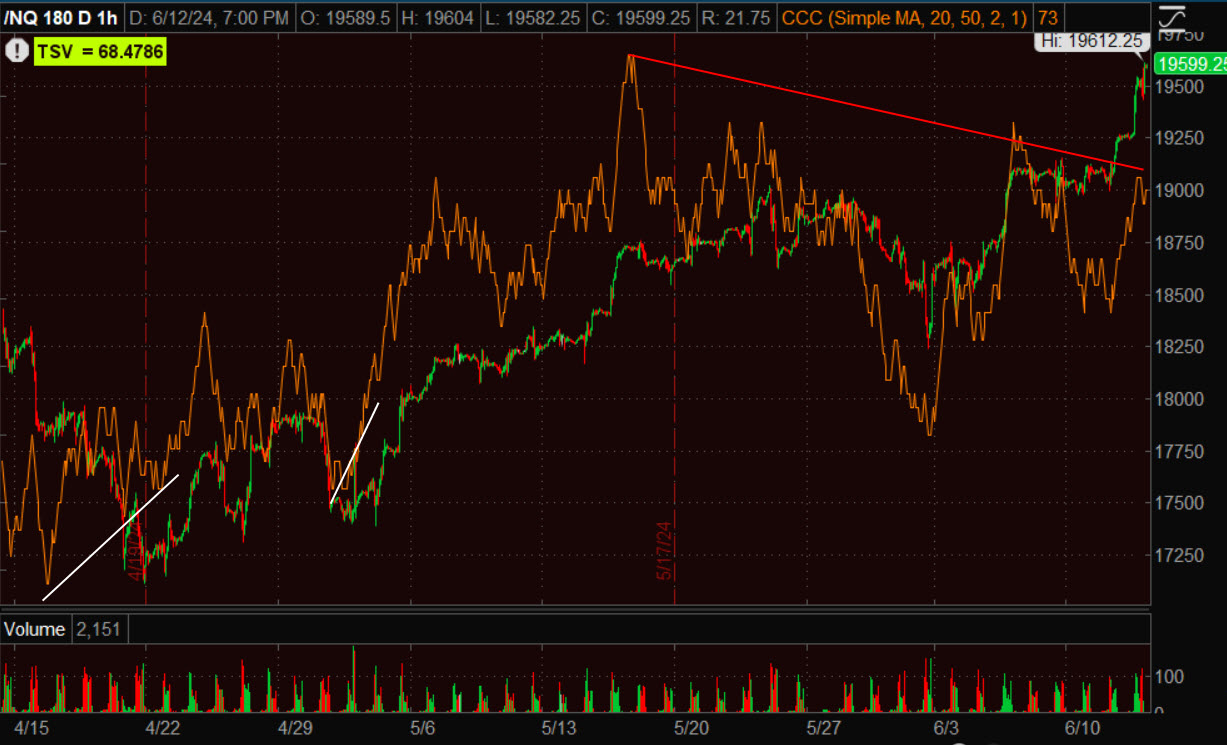 NQ (60m) relative negative divergence.
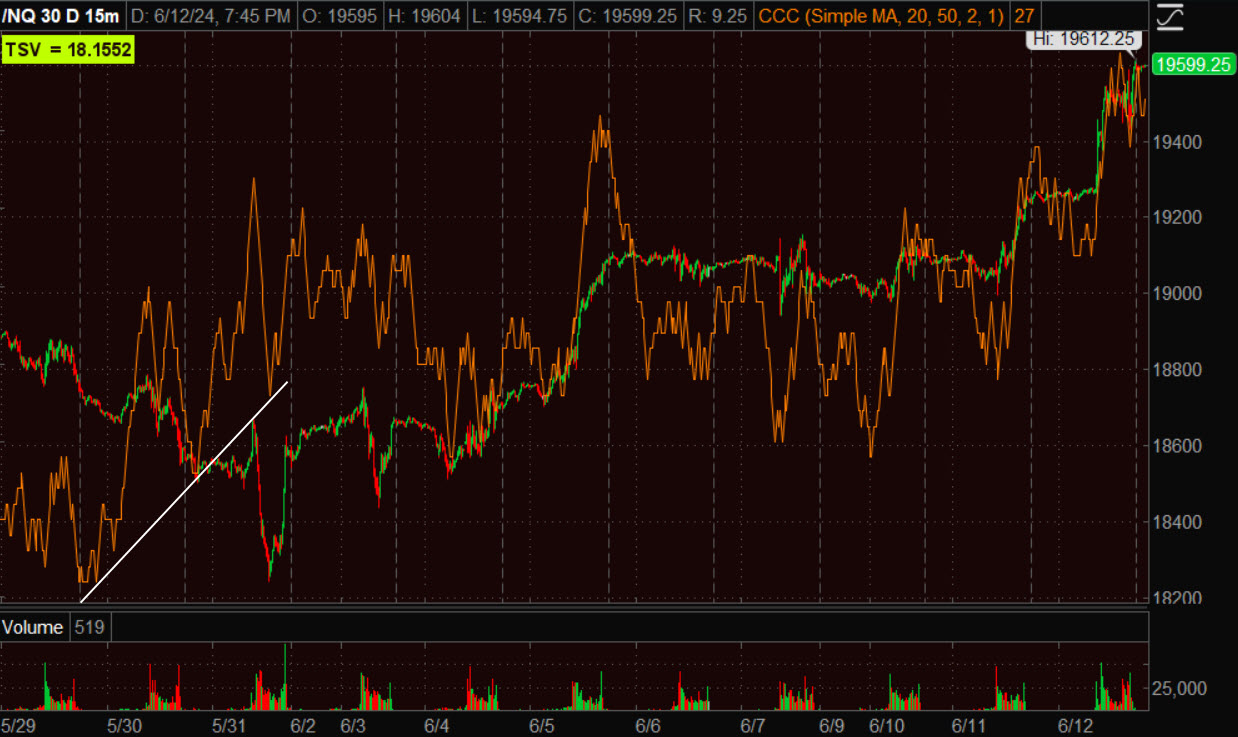 NQ (30m) positive divgernece into the May 31st pivot low and good confirmation after.
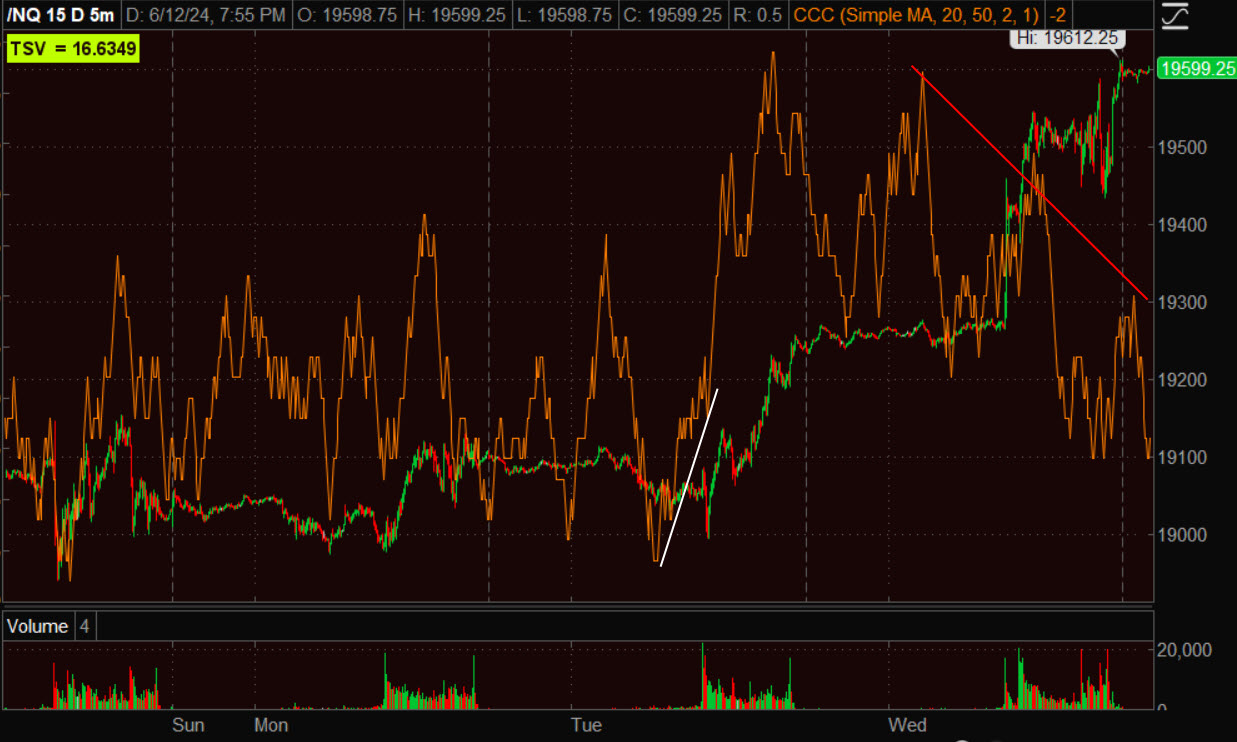 NQ (5m) with a recent relative negative divergence into today’s gain.
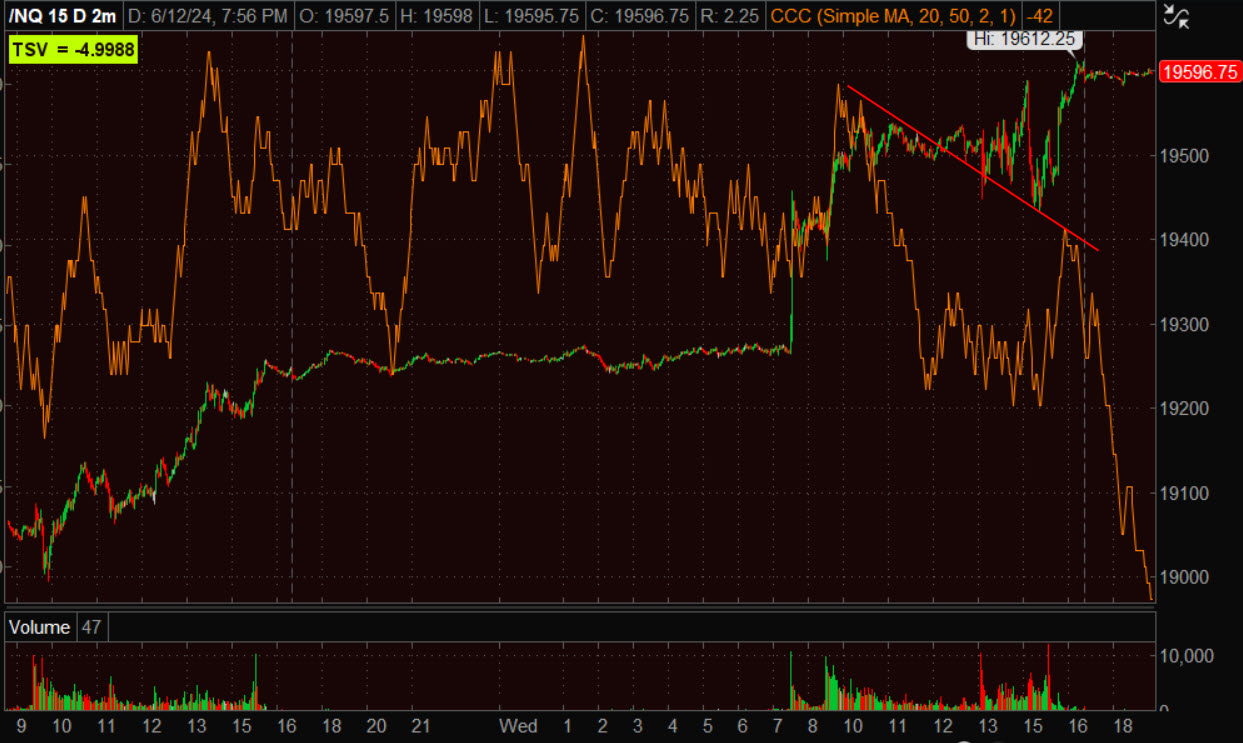 NQ (2m) good 3C confirmation until today’s gains with a relative negative divergence in the cash session this afternoon, and a leading neg. divergence in the overnight session.
Dow and Russell 2000 futures are down between -0.05% and -0.1%.
The Dollar Index is up +0.05%
WTI Crude Oil is down -0.3%.
Gold futures are down -0.8%.
Bitcoin is up +0.1%
The 2-yr yield is down 1 basis point and 10-yr is up 1 basis point.
Thursday’s economic calendar features:
- 8:30 ET: May PPI (prior 0.5%), Core PPI (prior 0.5%), Weekly Initial Claims (prior 229,000), and Continuing Claims (prior 1.792 mln)
- 10:30 ET: Weekly natural gas inventories (prior 98 bcf)