The primary theme today was one first picked up on 3C charts yesterday afternoon and posted in yesterday’s Afternoon Update. The 3C signals suggested a high probability that Small Caps correct/consolidate, and that the mega-caps that have been underperforming all of June and massively yesterday, see a short term rotation or reversal of the June dynamics. This also prevented a key stock, Apple, from breaking a very important trend line that would have changed traders’ views to a much more bearish outlook. I didn’t and don’t think institutional money is nearly done selling into higher prices that I suspect continues throughout June, so that would not have been a development that would be favorable to their goals.
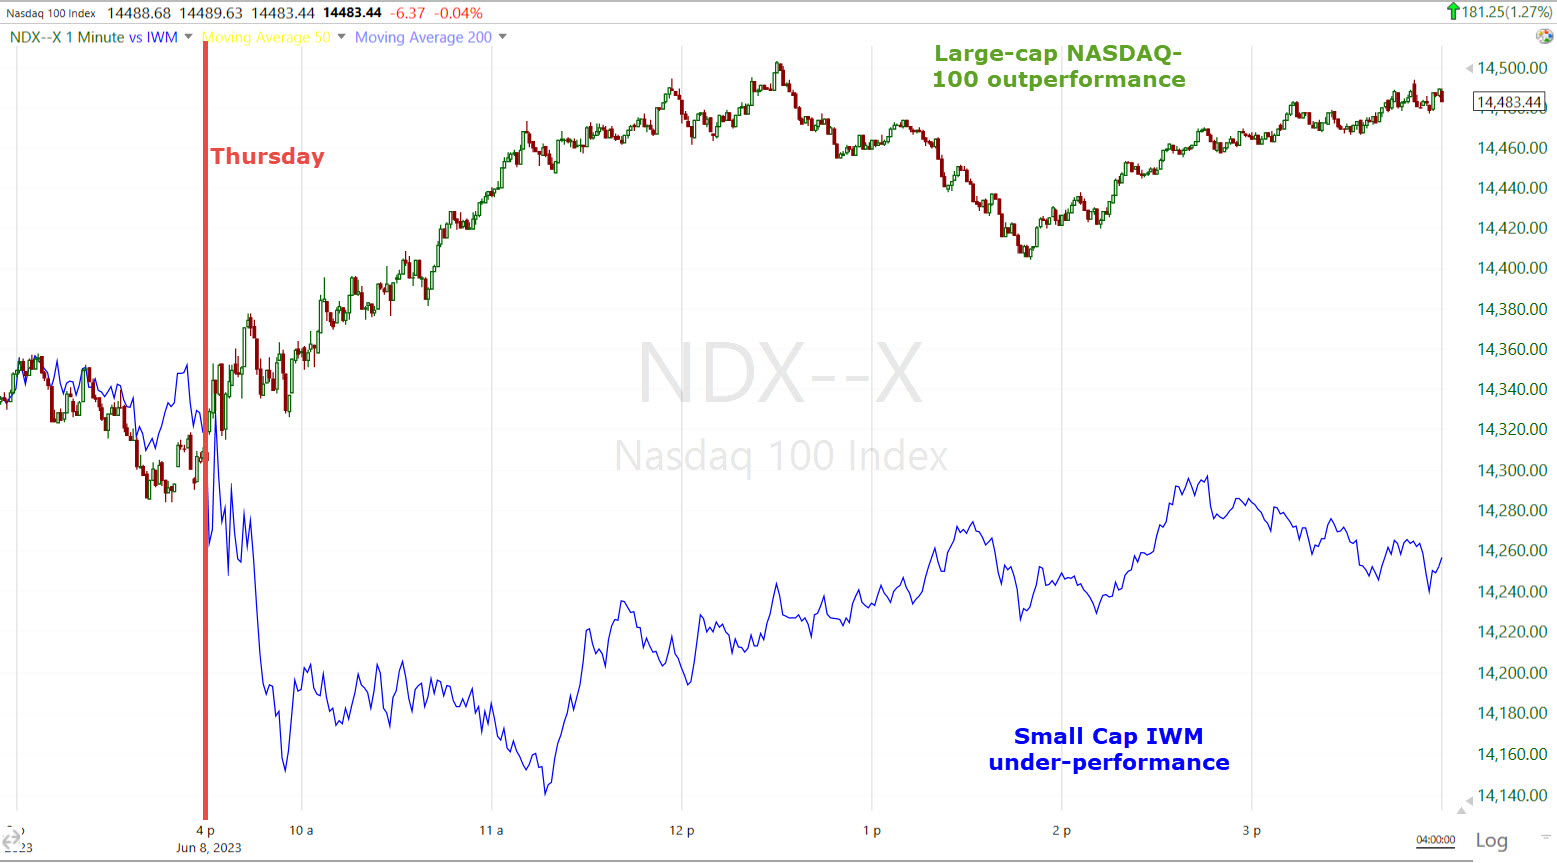 NASDAQ-100 (1m today) relative performance vs. Small Cap IWM (chart normalized) with today’s reversal. This is of course is the exact opposite of what we’ve been seeing all of June and a major topic of this past weekend’s video update.
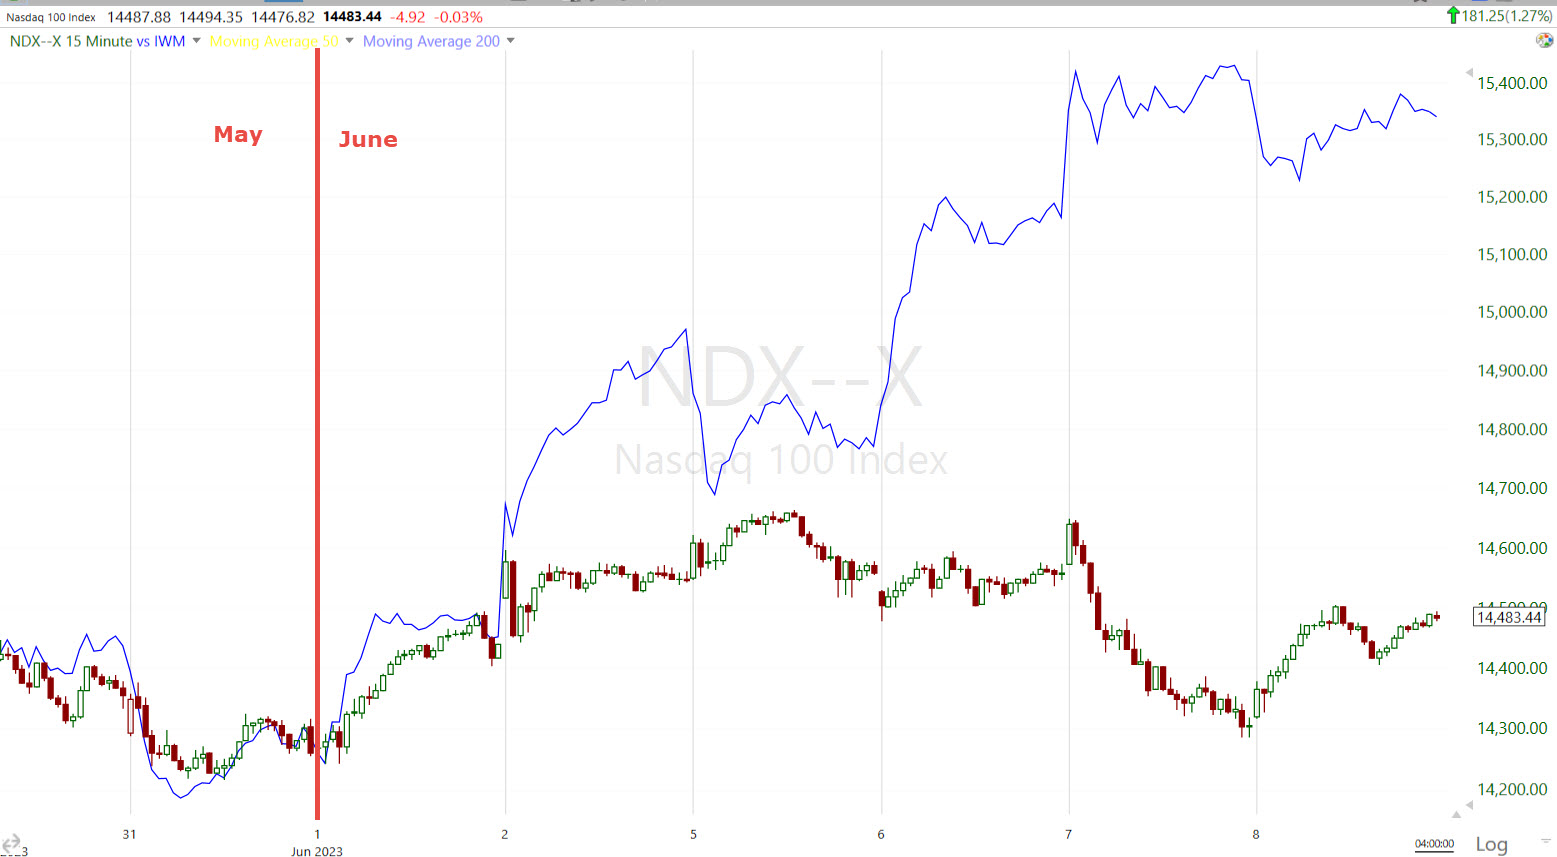 NASDAQ-100 (15m transition from May to June) relative performance vs. Small Cap IWM (chart normalized).
The market’s psychological environment is getting frenzied, between Goldman Sachs (and others) peddling the narrative that Small Caps’ recent outperformance is proof the economy will experience a soft landing from the Fed’s rate hike cycle. And while the S&P closed 0.15% from $4300, it did gain +20% off the October market low, +20.04% to be exact. I do not agree with the notion that a bull market is defined by a move of 20% off the low and I’ve laid out why numerous times, for example a stock or an averages’ beta. A -20% decline off all time highs in a stock like Tesla is little more than a pull back, it certainly wouldn’t be a new bear market. Obviously averages don’t have that high of BETA, but they do vary. I define bull markets by a primary up trend (higher highs/higher lows).
You might recall the exact same argument came up in November of last year as the Dow led the first leg of the rally that’s still under way. From October lows to November highs the Dow gained +20% and the usual media suspects called it a new bull market. I disagreed then, as you can see it was a topic of one of my videos at the time…
My answer to the question was no. The Dow, by the way, went on to do absolutely nothing after that. It’s still -2% lower now than it was at the November high. I feel the same way about the S&P, but I do think this plays right into the hands of institutional money that wants to sell into price demand as the average mom/pop investor, who missed most of the rally, now don’t want to miss the “new bull market”. FOMO! And look who’s spreading the narrative …

The VAMPIRE SQUID, Goldman Sachs!
An S&P futures’ short squeeze with a strong close above $4300 would just further drive home the investing public’s view that we’re in a new bull market. Whether purposeful or not, this is sure looks like a well planned PSYOP (Psychological Operation). The one question I’d pose is, if everything is hunky-dory and we’re in a new bull market, why is the SKEW Index rising again and sitting at an extremely elevated 155.53 today? That’s telling us that sophisticated investors (like Goldman Sachs) are hedging tail risk. Buying deep out of the money puts, especially at a higher than normal premium, isn’t a high probability payout to express a bearish position, it’s an insurance policy hedging long positions. And why now? Even if the Fed did hike 25 basis points next week, would that be such a big deal in the context of 525 basis points in 14 months? would it be this kind of tail risk someone’s obviously worried about? I don’t think so.
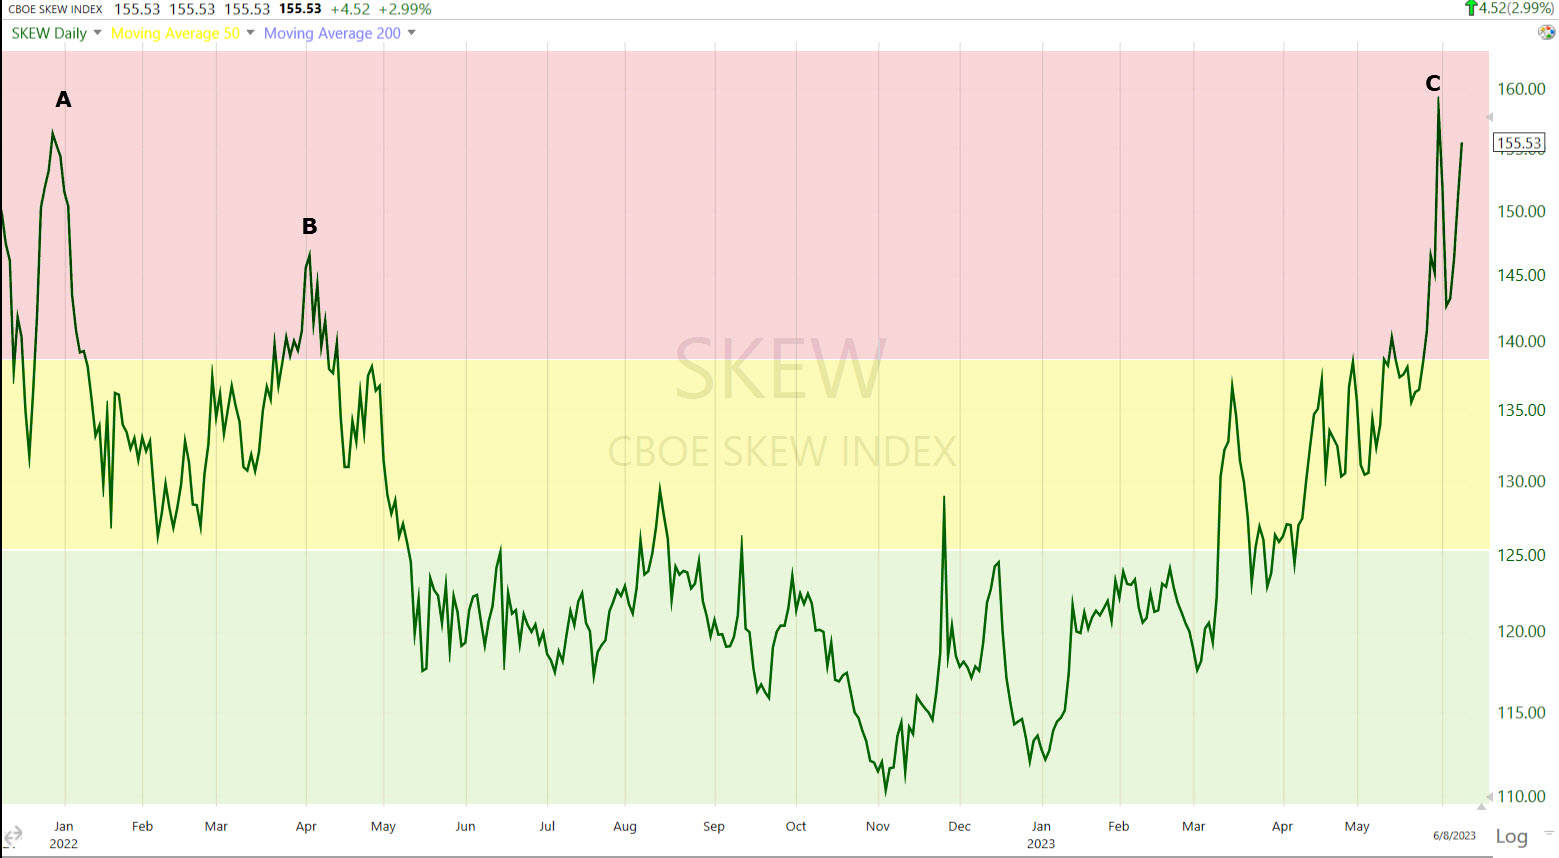
SKEW (daily) at A the market made its all time record highs just before entering the start of a bear market the next month. At B the S&P fell -20%. At C investors were hedging the unknown debt ceiling risk and then SKEW started coming down. So why’s it back up gain now? A extreme reading in SKEW doesn’t guarantee a market crash, but it tells you that pros are paying a high premium for deep out of the money puts as insurance against a crash. Usually when I’ve seen extreme SKEW signals and expected a crash, there were a bunch of other deflationary signals (sharp moves lower in copper, crude, yields, the Australian Dollar over a brief period) all signaling something bad coming, like the 150 reading in December 2019 and 142 in February, both before the COVID crash, but we had 6 weeks of increasing crash signals before that happened.
The timing does fit with my transition from Phase I to Phase II at the end of Q2 (end of June), but I haven’t called for a crash, just a market environment that turns from rallying and bullish, to worried about recession, starts lower and a more bearish outlook. That said, I can’t rule out a crash, I just don’t see the typical forewarning evidence of one at this point, but we’ll keep watching.
Jobless claims jumped to the biggest rise in initial claims year-to-date – excluding COVID – since 2009, and Initial Claims are a leading indicator, unlike the unemployment rate which is one of the worst lagging indicators out there. That doesn’t sound like a soft landing, but perhaps an inflection point in the labor market. That data sent yields lower, which was one of the key elements we saw in last night’s Overnight session portion of the Daily Wrap, as well as yesterday’s Afternoon Update – Tech and Mega-Caps To Get Some Short Term Relief, all of which suggested mega-caps rotate into leadership today and Small Caps lag just as we saw play out in today’s trade.
Averages
As you can see, the S&P and Dow are kind of bland, but the NASDAQ-100 massively outperformed the Russell 2000 as forecast as a high probability in yesterday’s Afternoon Update.
S&P-500 ⇧ 0.62 %
NASDAQ ⇧ 1.27 %
DOW JONES ⇧ 0.50 %
RUSSELL 2000 ⇩ -0.41 %
I’ve posted lot of chars of the major averages today. the one that I think matters most at this time is the S&P as it’s just 0.15% away from a close above $4300.
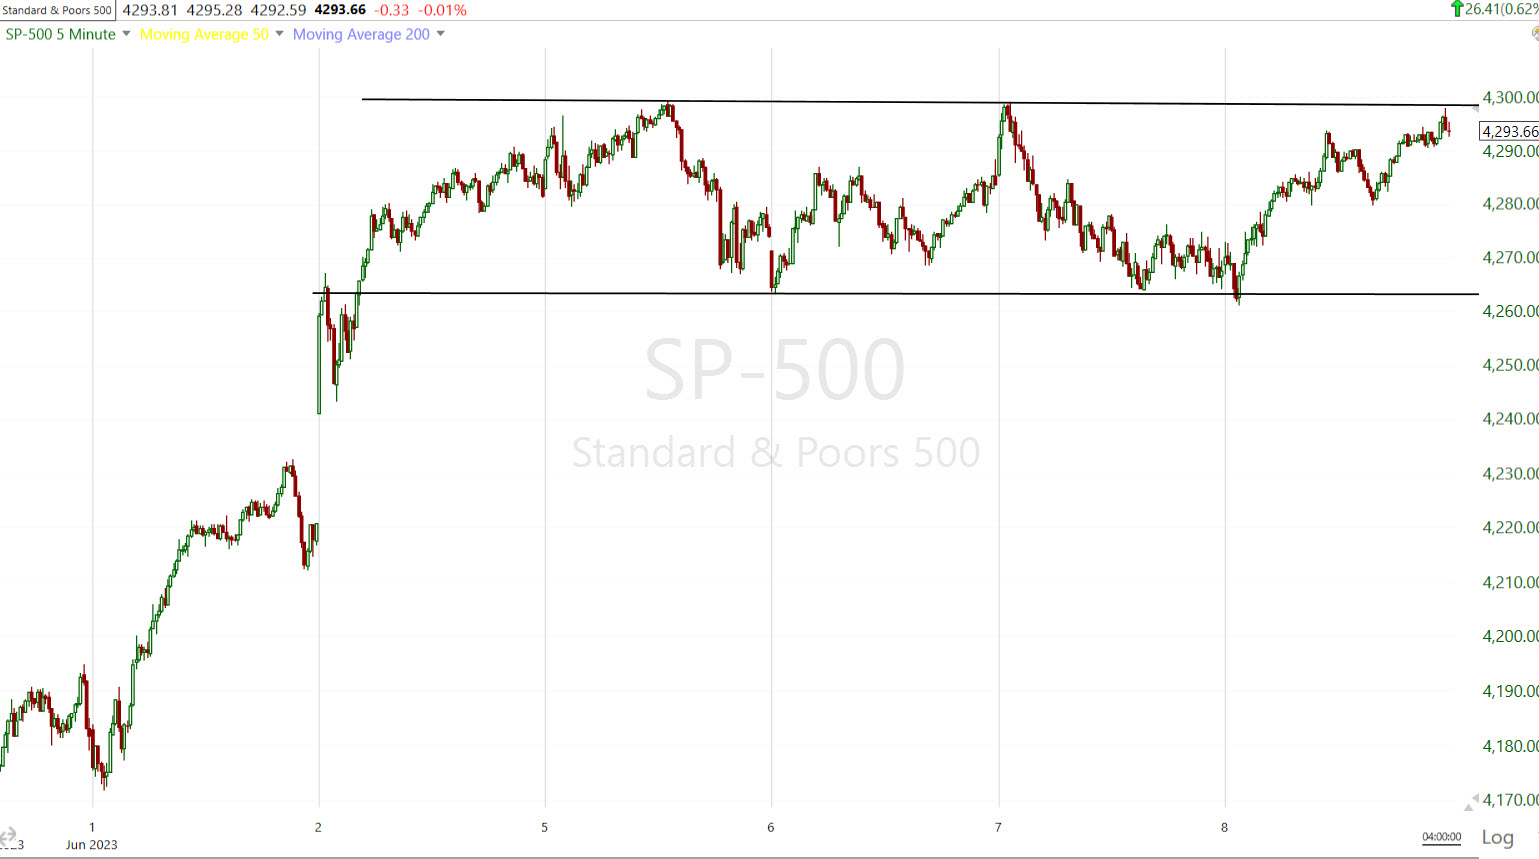 SP-500 (5m)
The short term 3C chart of SPY is looking good, like there’s a high probability the S&P closes above $4300 and instigates its own short squeeze (the short squeezes we’ve seen thus far in June are largely small caps stocks and that does nothing for the S&P).
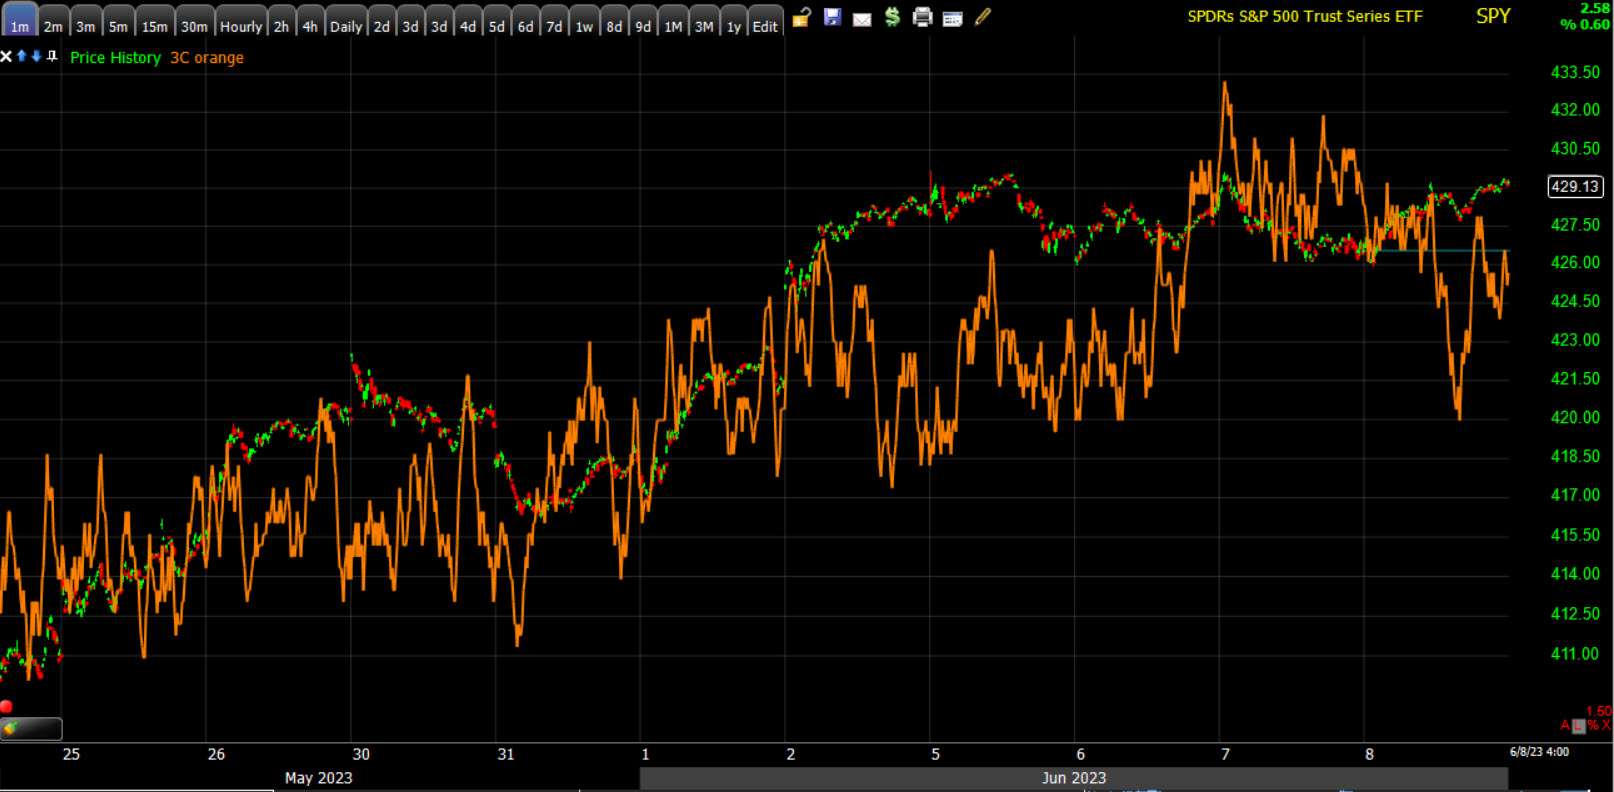 SPY (1m)
However, when we look at the longer term trend 3C charts we can see the same signs of distribution as we see in NASDAQ/QQQ and right into the month of June, which I’ve long believed is the highest probability moment for a transition from Phase I rally to Phase II recession concerns sending stocks lower.
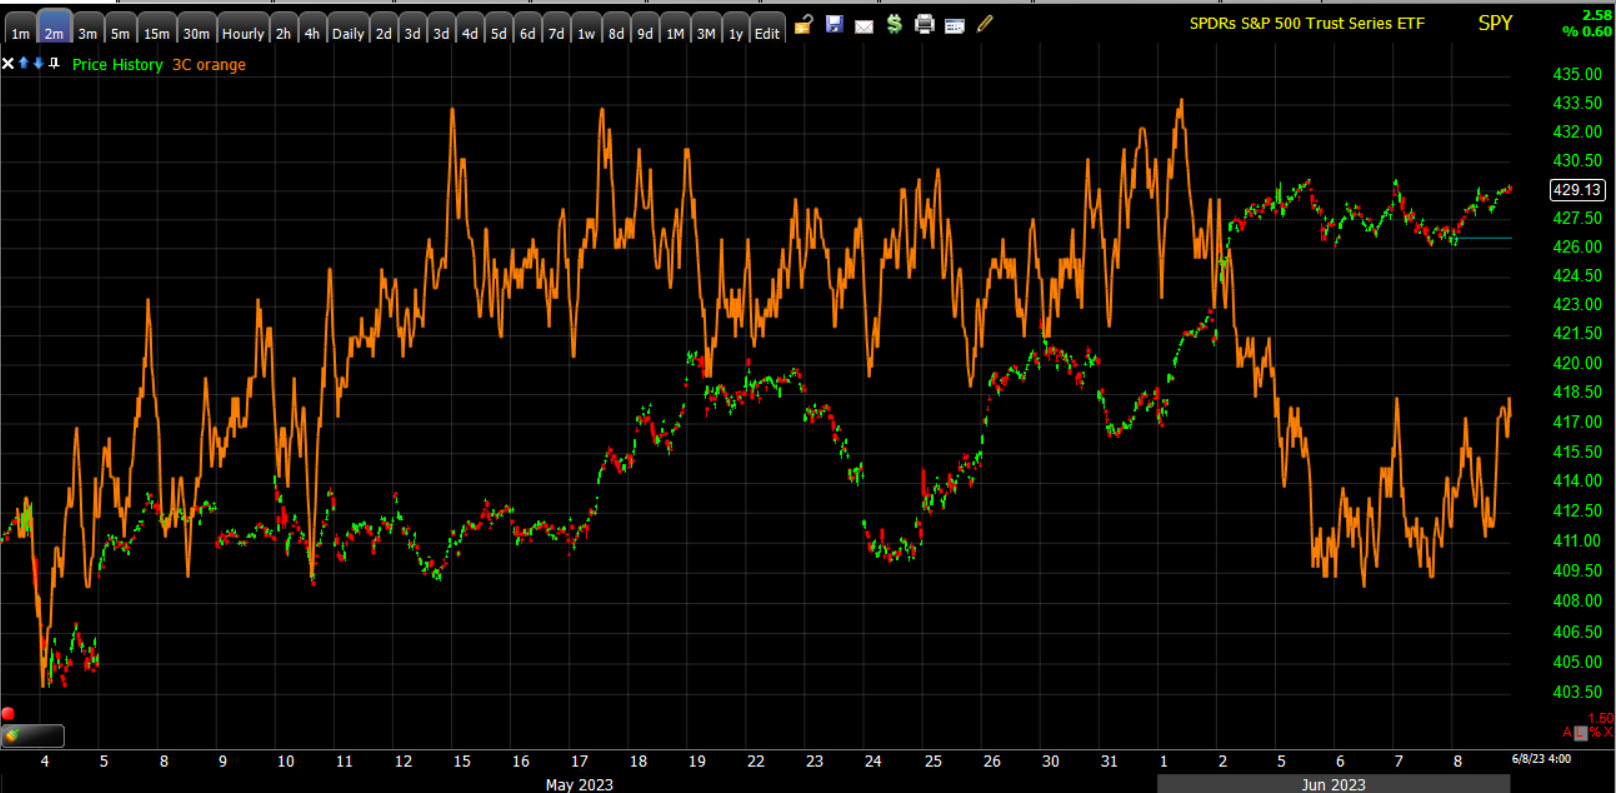 SPY (2m) on the left side of the chart, right into the end of May, 3C is VERY bullish, leading the S&P’s price higher. However, into June, 3C is negatively diverging (selling pressure), and that’s almost certainly being exacerbated by the large-caps and mega-caps. S&P has no exposure to Small Caps.
VIX (-2.1%) made a new lowest close since February 2020 when the S&P was at what were then, all time record highs, just before the COVID crash.
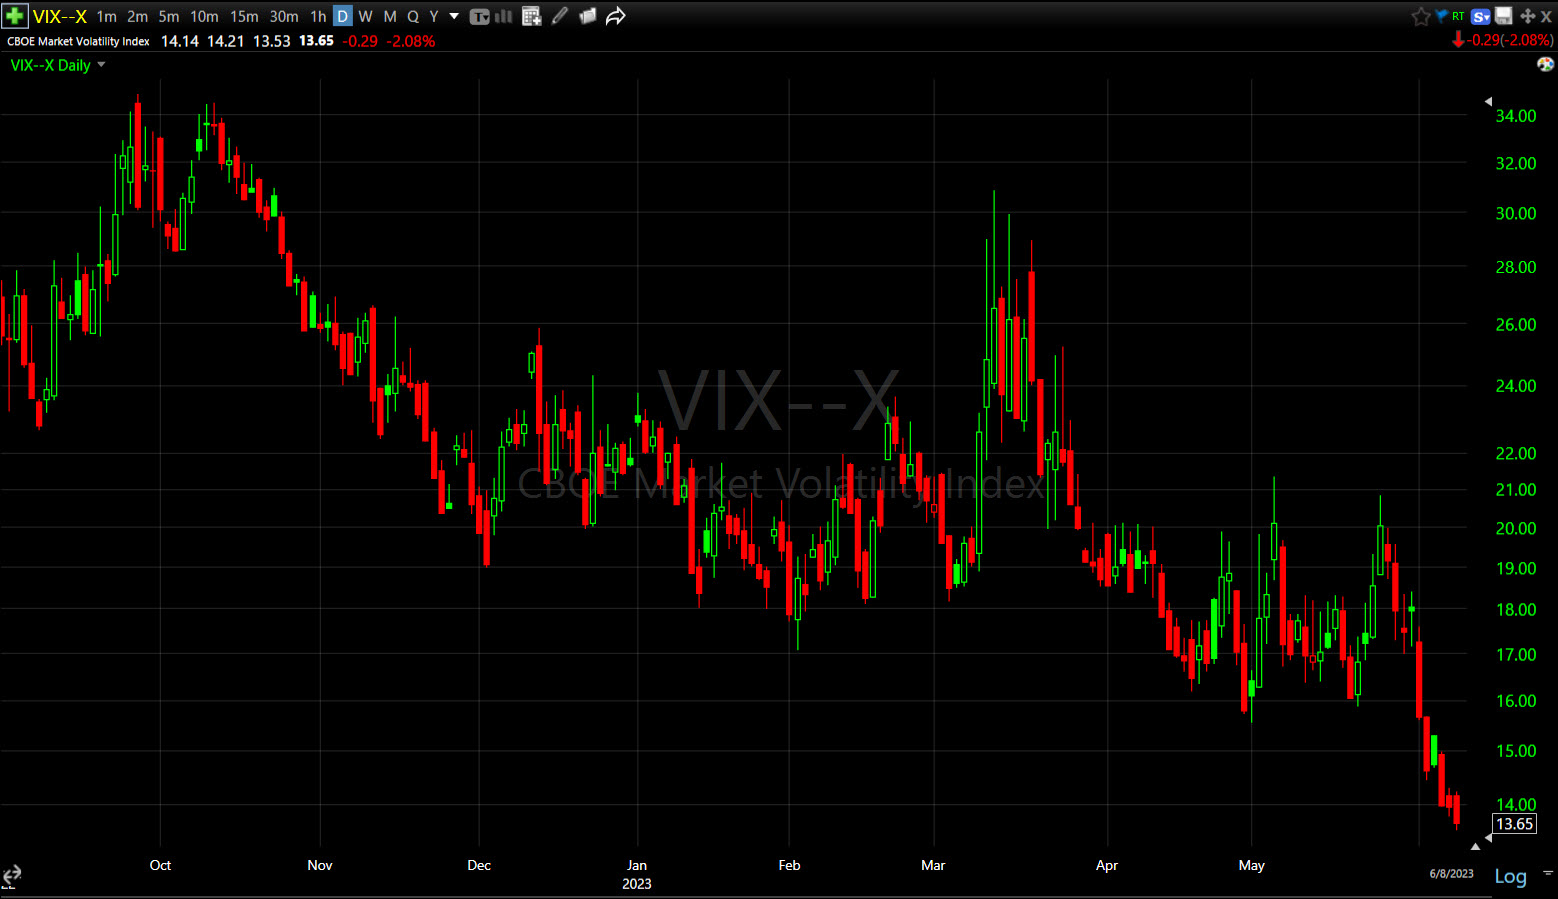 VIX (daily) – these are obscenely low levels in VIX that are not normal, but it seems the old hedge fund standby trade of shorting volatility during a rising market trend and taking advantage of contango (which for a decade was a near guaranteed pay day), is back in force.
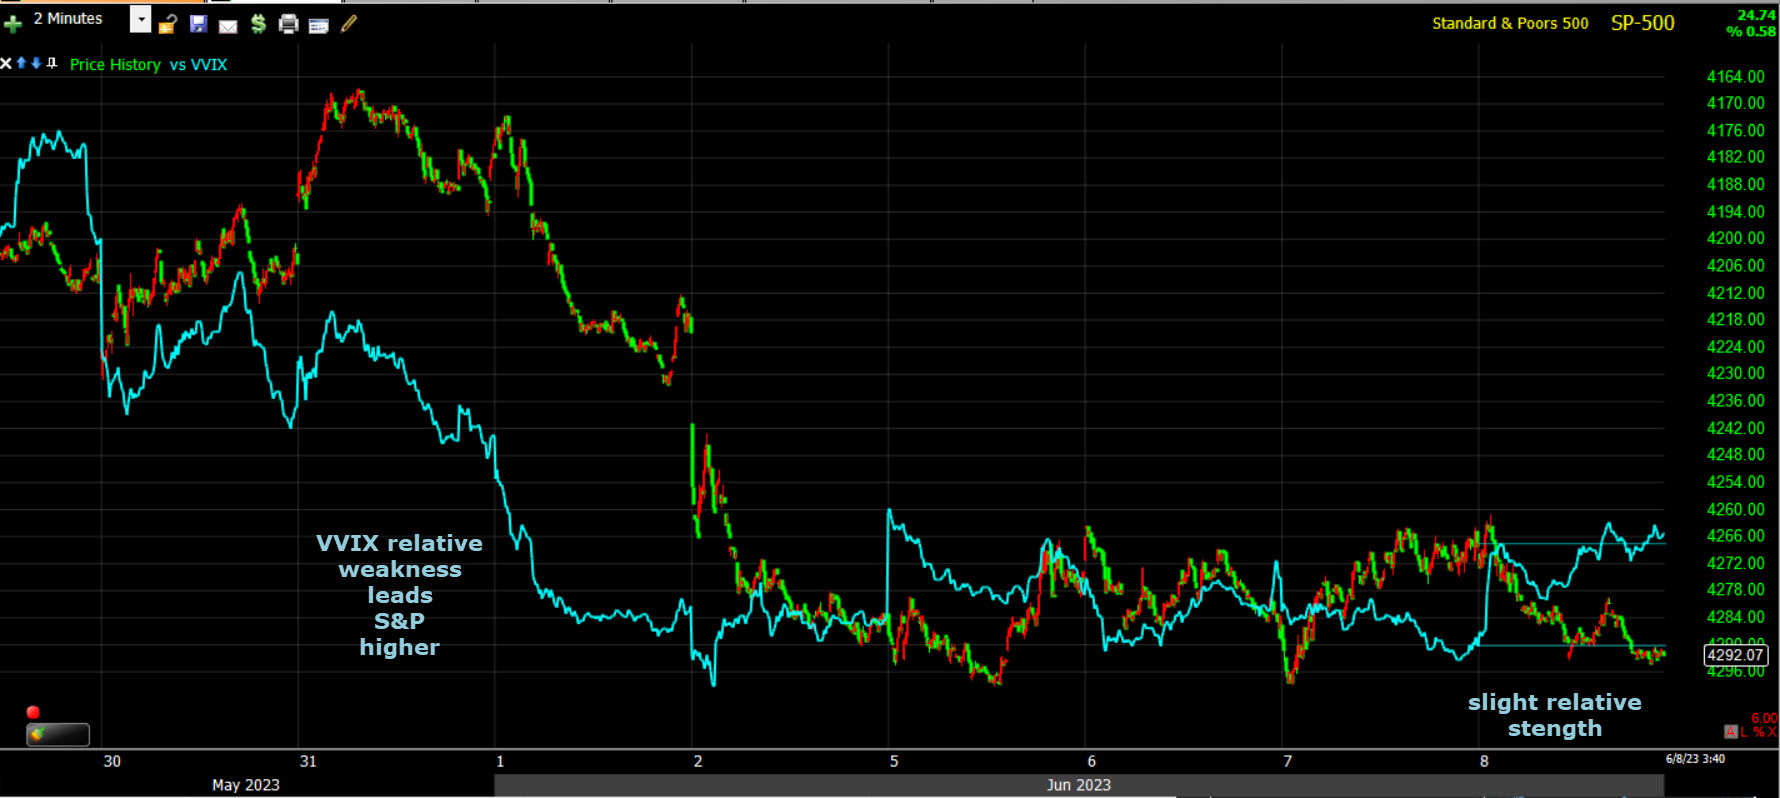
VVIX (+4.3%), however, ended the day noticeably higher. This isn’t enough to suggest a high probability signal that moves the market lower, but it’s worth watching. Here’s the chart from the Afternoon Update, or you can read the post.
The Absolute Breadth index ended at 45. If we do get a sub-14 close on the ABI in the month of June, long volatility is going to be very attractive as the levels of VIX here are ridiculously low and set for a rubber-band snap back, reversion to the mean, even without a market crash.
S&P sectors
7 of 11 S&P sectors closed higher. The bias was toward mega-caps with mega-cap heavy sectors, Technology and Consumer Discretionary, at the top of the leaderboard. Earlier today the third mega-cap heavy sector, Communications, also sat at the top of the leaderboard. Apple (AAPL +1.6%), Amazon.com (AMZN +2.5%), which was initiated by Wells Fargo with an Overweight rating, NVIDIA (NVDA +2.8%), and Tesla (TSLA +4.6%), which recorded its tenth straight gain, were among the biggest support factors. The Vanguard Mega Cap Growth ETF (MGK) gained 1.0% to outperform the S&P Equal Weight Index (+0.05%) by 95 basis points after a horrendous 240 basis point rout for the mega-caps yesterday. Key to today’s trade, Apple avoided a bear flag measured move target that would have broken a key support trend line that few traders would have missed. In fact Apple’s 3C chart was one of the first to show a change in character (positive) yesterday afternoon.
The Semiconductors index (SOX +1.1%) still has a bullish consolidation so it remains to be seen whether it breaks out.
Just as I’d expect to see from yesterday afternoon’s forecast of mega-caps rotating into leadership today with Small Caps on the weak side, the cyclical sectors that have been rallying with Small Caps were laggards today. The Regional Banks (-1.2%) were an obvious area to pull back, but the pull back was normal and fairly modest relative to the +14.4% gain over the prior 5 days. I am however seeing something on the intraday price action that may be a problem (see below)
The Retail sector pulled back early on with Regional Banks, down as much as -1.1%, but rallied in the afternoon to end with a +1.25% gain.
Materials ⇩ -0.36 %
Energy ⇩ -0.43 %
Financials ⇩ -0.09 %
Industrial ⇧ 0.18 %
Technology ⇧ 1.08 %
Consumer Staples ⇧ 0.69 %
Utilities ⇧ 0.44 %
Health Care ⇧ 0.64 %
Consumer Discretionary ⇧ 1.48 %
Real Estate ⇩ -0.61 %
Communications ⇧ 0.51 %
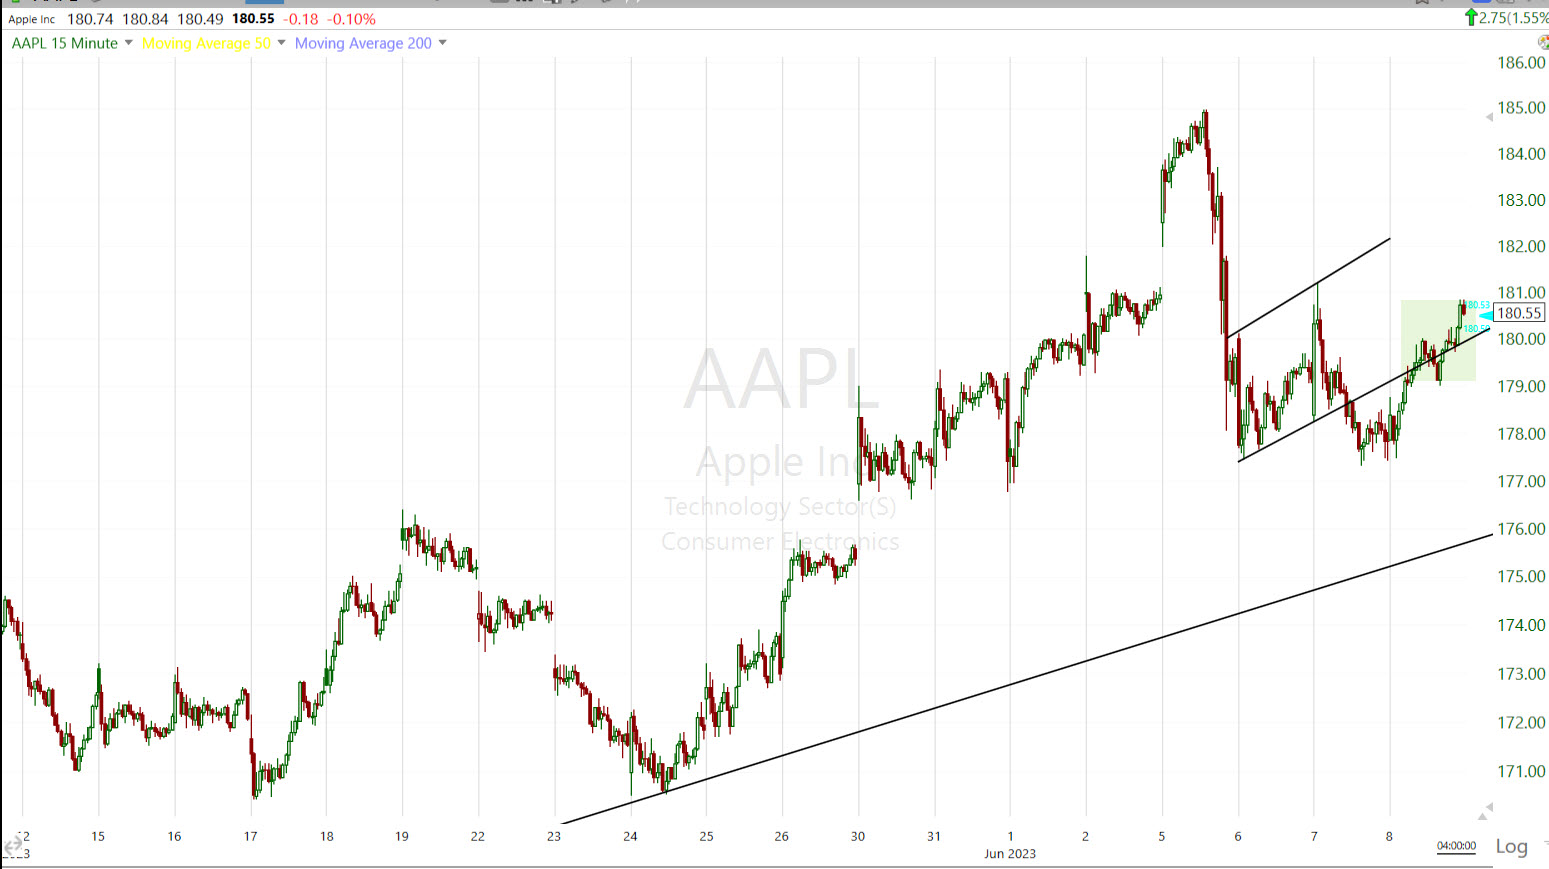 Apple (15m) just managed to negative the bear flag, which had it broken to meet it’s measured move and broke the up trend below, would have sent up a market wide panic flair or red flag and institutional money’s chance to sell into price strength would be at substantial risk. I wouldn’t doubt it if they stepped in yesterday afternoon to provide a little support to make sure that didn’t happen. Market makers have long been known to do the same.
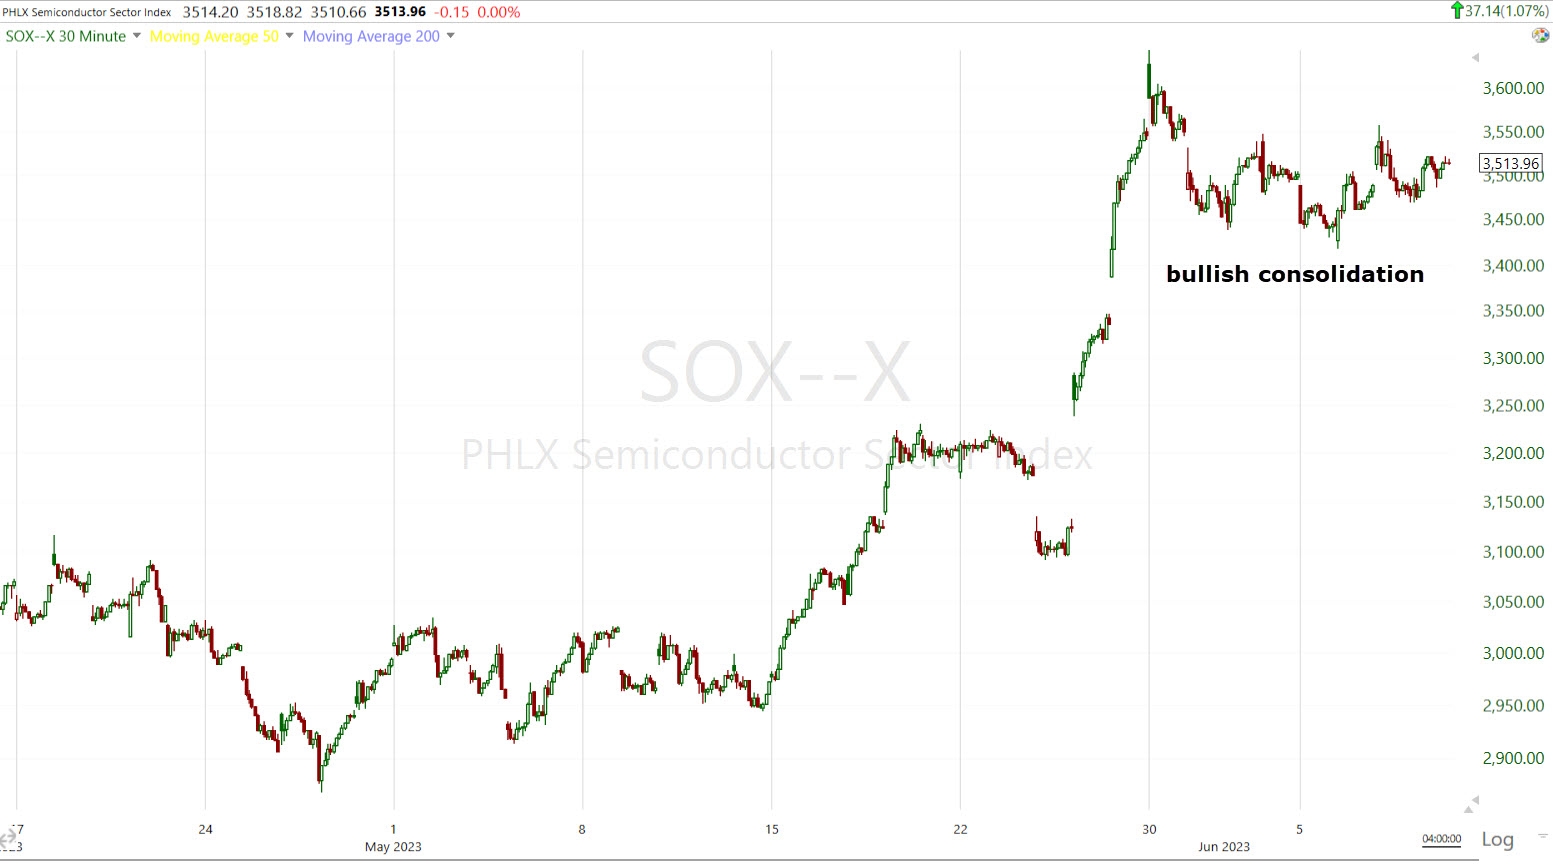 Semiconductor Index / SOX (30m)
I’m giving the Regional Banks the benefit of the doubt for now. The actual pull back in percentage terms was reasonable and small, but the price action this afternoon was a little concerning.
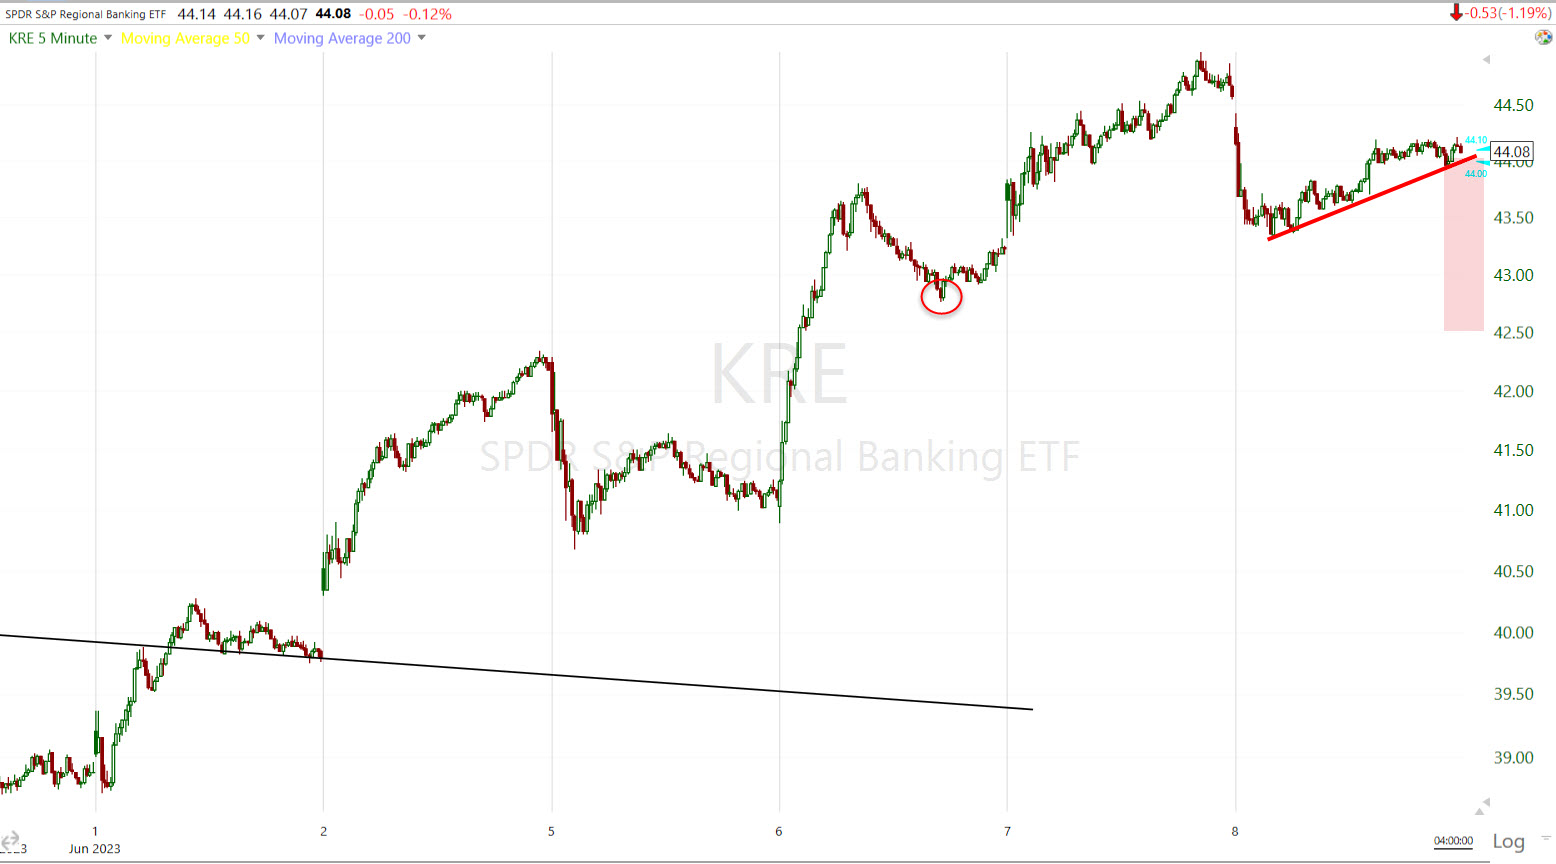 Regional Banks (5m) it’s the red trend line that’s concerning as it has a bearish bias. Perhaps a broader consolidation takes shape and it’s irrelevant, but as it sits now, if that trend line broke the measured move would test Tuesday’s pivot low (red circle) and threaten to break the short term trend of higher highs/higher lows. Can I say I’d be surprised if that happened? No, I wouldn’t. Unlike the venerable Goldman Sachs, I don’t believe for a second that Small Caps’ outperformance thus far in June has anything to do with an improving economy, rather it has everything to do with beaten up “bargain looking” stocks that have seen a massive short squeeze. When that short squeeze runs out of gas, I don’t expect these stocks to be able to gain of their own accord. They are absolutely the worst stocks to own heading into a recession, which I believe we’ll be heading into the second half of this year which starts at the end of this month. This chart of Regional Banks is a bellwether worth keeping a very close eye on. The other I’ll be watching extremely closely is Apple, for completely different reasons.
Internals
Market breadth had been somewhat negative for most of the session as is often the case when the heavily weighted mega-caps lead the market, but advancers and decliners at the NYSE and NASDAQ Composite settled on a nearly even basis. However, Volume today (837 mln. shares) was notably lower than yesterday’s 1 bln shares.
The Dominant price/volume relationship wasn’t as dominant as I look for and it wouldn’t have mattered with regard to 1-day overbought/oversold internals as the two other conditions weren’t present, but still I like to know what the relationship was and it was just dominant at Close Up/Volume Down. This is the most suspect of the 4 relationships and a necessary component in 1-day overbought internals, which aren’t relevant today.
Breadth oscillators are still overbought at 91, but off yesterday’s extreme overbought that nearly reached 99 (scale of zero to 100). the overbought dynamics are a result of small Caps’ near 8% gain for the month. For the health of the market, and small caps’ ability to gain more, it would be preferable for the averages to consolidate a little more. Overbought conditions can be worked off through price (pull back) or time (consolidation).
Market breadth has been improving in June with the leadership of Small Caps, but it’s still notably weaker than the extremely strong breadth seen up until February.
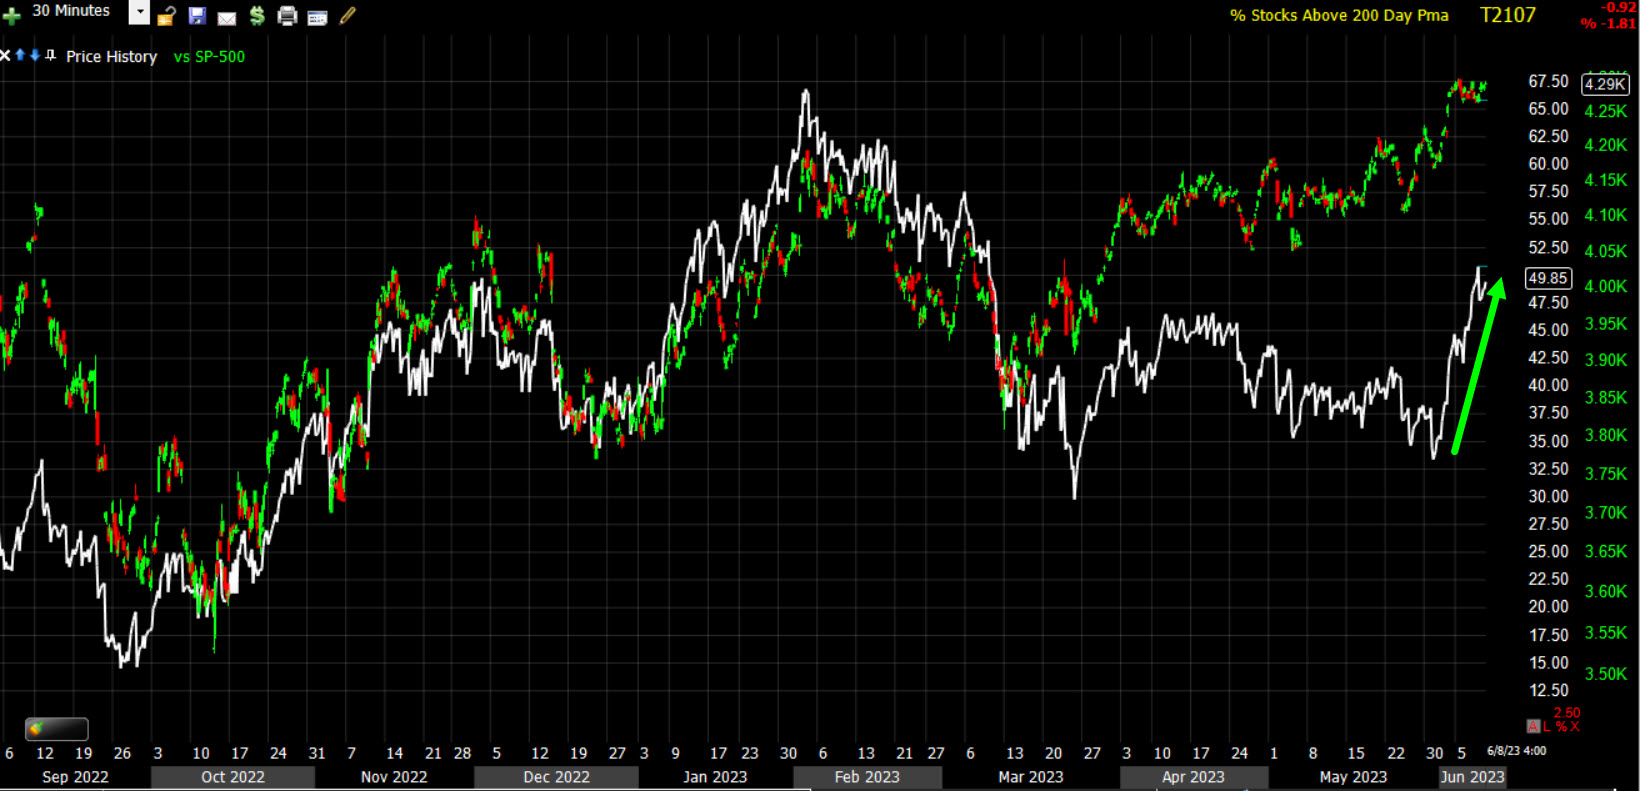 SP-500 (30m) and the percentage of NYSE stocks trading above their 200-day sma (white) with June’s improvement at the green arrow, but overall, on a rend basis for the rally from October, this is significant detioraration.
Treasuries
Treasuries were bid across the curve, as early overnight 3C charts in last night’s Daily Wrap (overnight section) suggested. That’s helpful for the mega-caps that have been extremely rate sensitive, especially in 2022. One of the biggest factors in my call for mega-caps to rotate into leadership in 2023 was rate risk had notably subsided.
The 2-year yield fell three basis points to 4.52% and the economically sensitive 10-year yield fell seven basis points to 3.71% as the initial clams report was not pretty.
Currencies and Commodities
The U.S. Dollar Index fell again today (with yields) by about -0.7% (a big move for the dollar) to its biggest daily drop since March and the second big drop in a week , down to to 3-week lows. That’s helpful for stocks broadly.
This still does not give us a definitive answer to the question, “Where’s the dollar going from here?” as there’s the chance for a bullish “W” base, or a bearish descending triangle. This is an important question to be answered as it relates to equities (and gold) given the extremely strong inverse correlation with stocks since shortly after the end of the COVID crash.
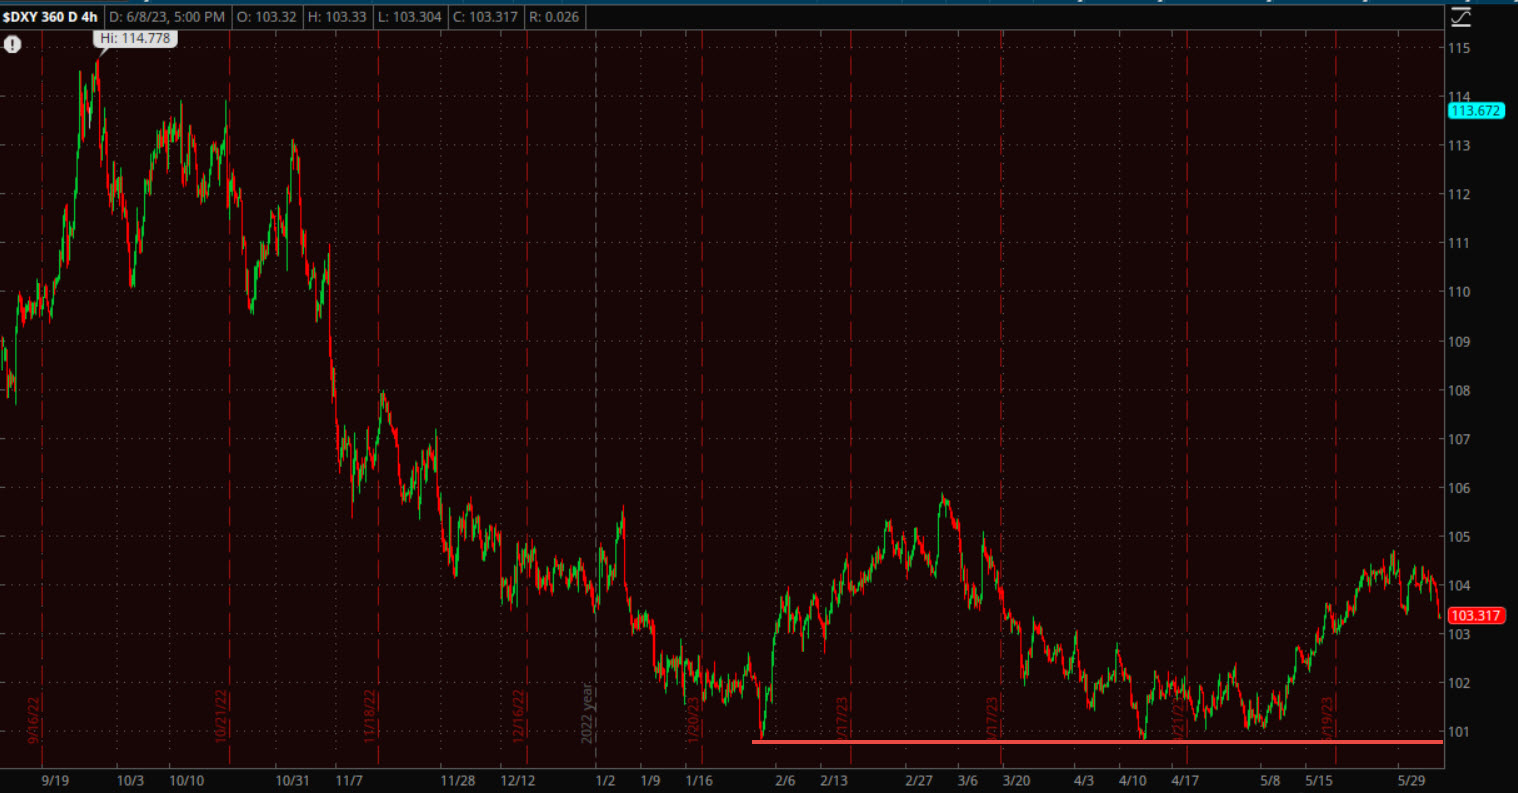 U.S. Dollar index (4H) – this could still go either way – “W” base (bad for stocks and gold) or Descending triangle (good for stocks and gold).
What the decline did was help narrow some of the massive divergent risk I’ve been talking about for just about a month in both the dollar nd yields vs. stocks. Over the last 16 months this kind of divergence has been horrible for stocks and to be honest, I’m surprised it has gone on this long without stocks catching down, although I do believe the divergence is “part” of the reason mega-caps no longer looked attractive heading into June as the rate risk not only reappeared, but is quite extreme.
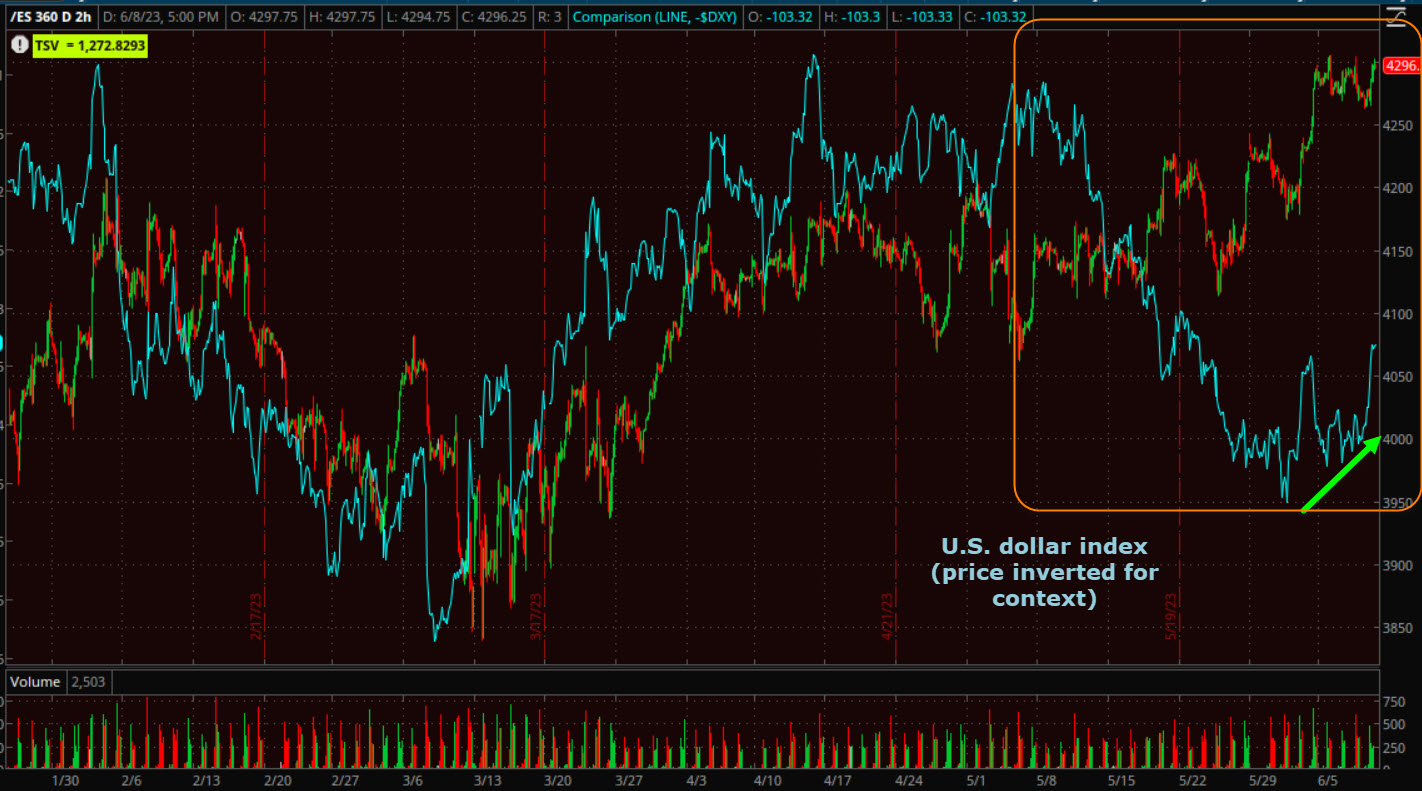 S&P futures (2H) and the dollar (price inverted for easier context) with the alligator jaws of death in orange, but the recent dollar weakness (green arrow) starting to close some of the massive divergent gap. The dollar/Yields inverse or negative correlation with stocks has been one of the strongest market signals in our tool box. If the divergence continues, then it’s another massive headwind that may be another reason for smart money to exit their October rally long positions while they still can before these jaws slam shut.
WTI Crude oil futures fell -1.7% to $71.24/bbl, and traded below $70 (below pre-Saudi production cut headlines). A downside catalyst was initial headlines about a possible Iran nuclear deal, but that was denied by the White House an hour later.
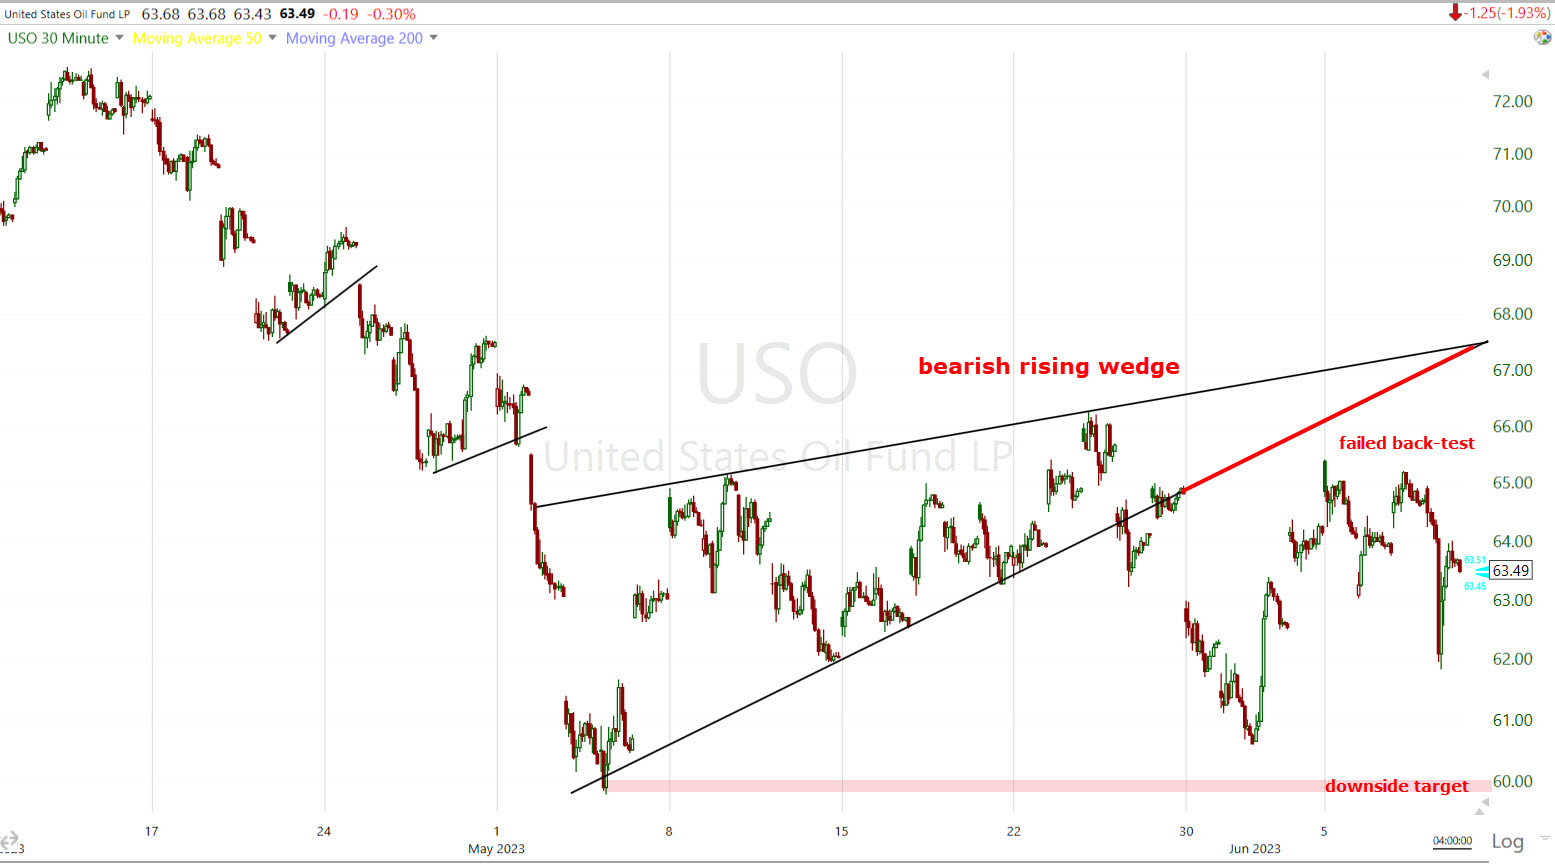 Using USO as a proxy (because it’s so much easier for me to draw trend lines here), thus far we have a broken bearish rising wedge, a failed back-test and a downside measured move based on the wedge that’s about -5.7% lower for oil. That does not mean that oil can’t trade lower, it just means that’s the next high probability pit-stop. Once a measured move is fulfilled, the highest probability, most likely scenario is price consolidates in the area of the target. If that consolidation is bearish, then we have the target for the next downside measured move.
Gold futures gained +1.0% to $1,978.60/oz, ramped higher this morning by losses in treasury yields and the dollar as a result of the much weaker than expected Initial jobless claims report. Stocks and gold have been fairly highly correlated since arch of 2022 when the Fed started hiking rates, and both have been strongly negatively correlated with the Dollar and Yields. The weak U.S. data sent both the dollar and U.S. Treasury yields lower and as you can see by the chart below, gold jumped at the 8:30 a.m. ET release of the Initial Claims report, as the dollar fell sharply.
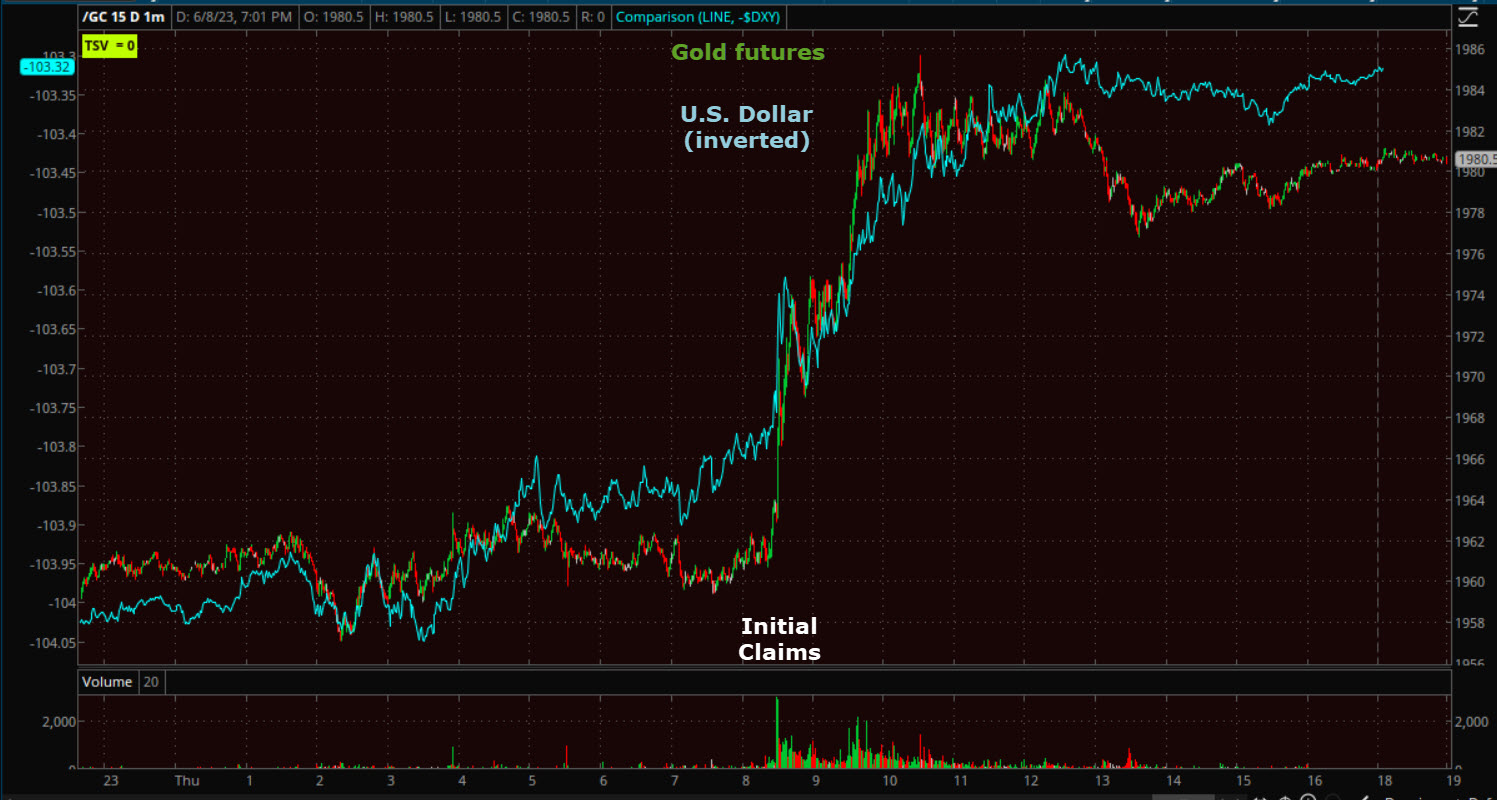 Gold Futures (1m) and the U.S. dollar Index (price inverted for context) seeing Gold jump as the dollar (and yields) dumped on the weaker than expected U.S. data.
I’ve mentioned recently that I see some potential for gold’s price action to improve. Today didn’t do anything to notably advance that view, but it didn’t hurt either.
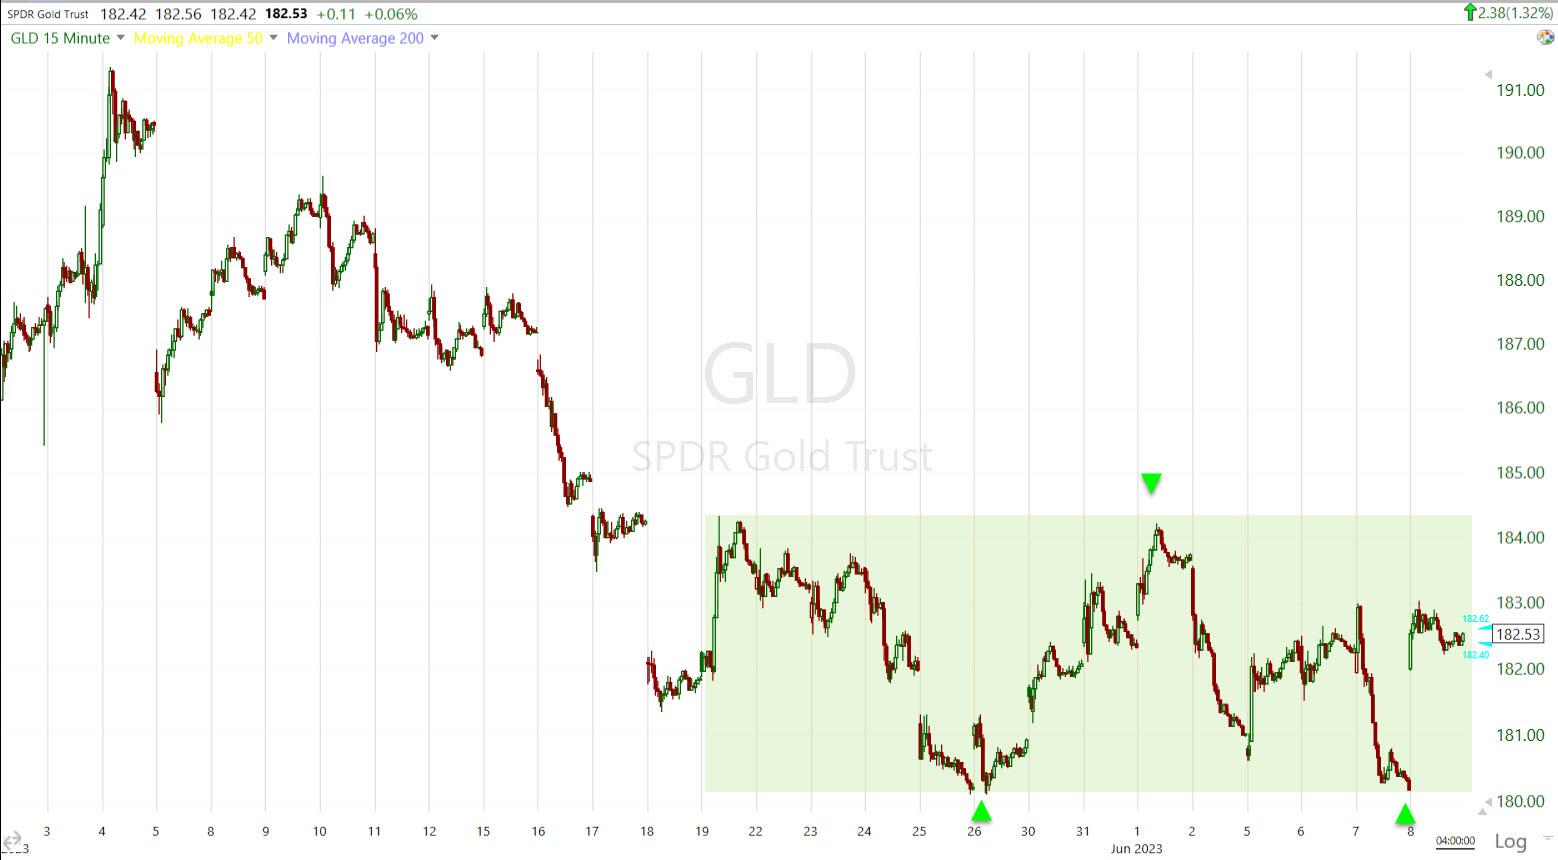 GLD (15m) as a proxy for gold futures with what appears to be a “W” base forming. We saw a much larger version of this type of base in October-November of last year in gold and the Dow. Gold gained +26% off that base. This is smaller. Currently if the base does prove to be what it looks like, the measured move upon a breakout is about +2.4%, but from current levels it’s +3.4% higher (and it could always add to the gains upon a breakout from a bullish base). It may be worth a look from a risk : reward perspective if gold pulls back some, but doesn’t break below recent lows. The idea would be to buy as close as you can to the lows (and have a stop just below). Let’s say gold pulled back -1% from here (still above recent lows), you could buy there with a stop just below the recent lows (I prefer on a closing, not intraday, basis). That would give you about +4.5% of upside potential with just -0.3% of downside risk (depending on how far below recent lows you put your stop (a wider stop is less likely to be stopped out, but offers a lower risk : reward profile).
In any case, as described above, that’s a risk : reward profile of 15:1. I don’t take any trade/investment with a profile of less than 3:1. something to think about, especially if we get more evidence supporting a bullish near term outlook for gold.
For an asset that use to be so volatile, and garnered so much attention form the younger generation, Bitcoin has been an absolute snooze fest. I explained in last night’s Daily Wrap why, and what I believe it will take to make Bitcoin an attractive investment again on the long side,
” BTC is still a speculative asset class (maybe not to the younger generation, but to anyone running money for a living), it’s going to do best when there’s excess money in the system.”
I don’t even see the point in posting an updated chart. My call has been that bitcoin loiters around $27k and it’s sitting at $26,854. When something changes there, I’ll be the first to let you know.
Summary
I hope I’ve been clear in my explanation of what I expect in June. It’s not that I expect the market to break down and trade lower in June, at least not yet. I’m expect there’s a high probability that there are more short squeezes, the next of which I’m watching for is S&P futures as non-commercial shorts (e.g.- hedge funds) are just about as short as they have been in more than a decade. An S&P close above $4300 would very likely start the short covering, which is buying demand, which would send prices higher, causing more shorts at a larger loss to start covering, until we have a full blown short squeeze. Dumb money, listening to CNBC and Goldman Sachs tell them that we’re in a new bull market and that Small Caps’ week of outperformance is an indication the economy is improving, will likely buy this crap, quite literally, which is exactly the group of people smart money wants to unload their shares on at higher prices. That’s been my expectation for the end of Phase I, catalyzed buy a “Sell the news” event if and when the Fed fails to hike rates next week. I don’t expect there will be an immediate sell the news on no rate hike, but rather we’d likely see an initial rally, but smart money that’s been front-running the Fed ending its rate hike cycle with peak inflation and peak hawkishness last year, will use that to sell into. We’re already seeing some signs of distribution in the year to date leaders – Tech, NASDAQ and mega-caps. I suspect we’ll see more if given the opportunity to sell into higher prices.
I wouldn’t be jumping in short yet as we could very well have a melt-up, then a massive rug-pull. However, if and when the evidence of my hypothesis builds, we’ll know that it’s time to start making that transition.
Overnight
S&P futures (and others across the board) are down -0.1% and 3C looks slightly weaker tonight as the S&P sits at the top of its range, just below $4300.
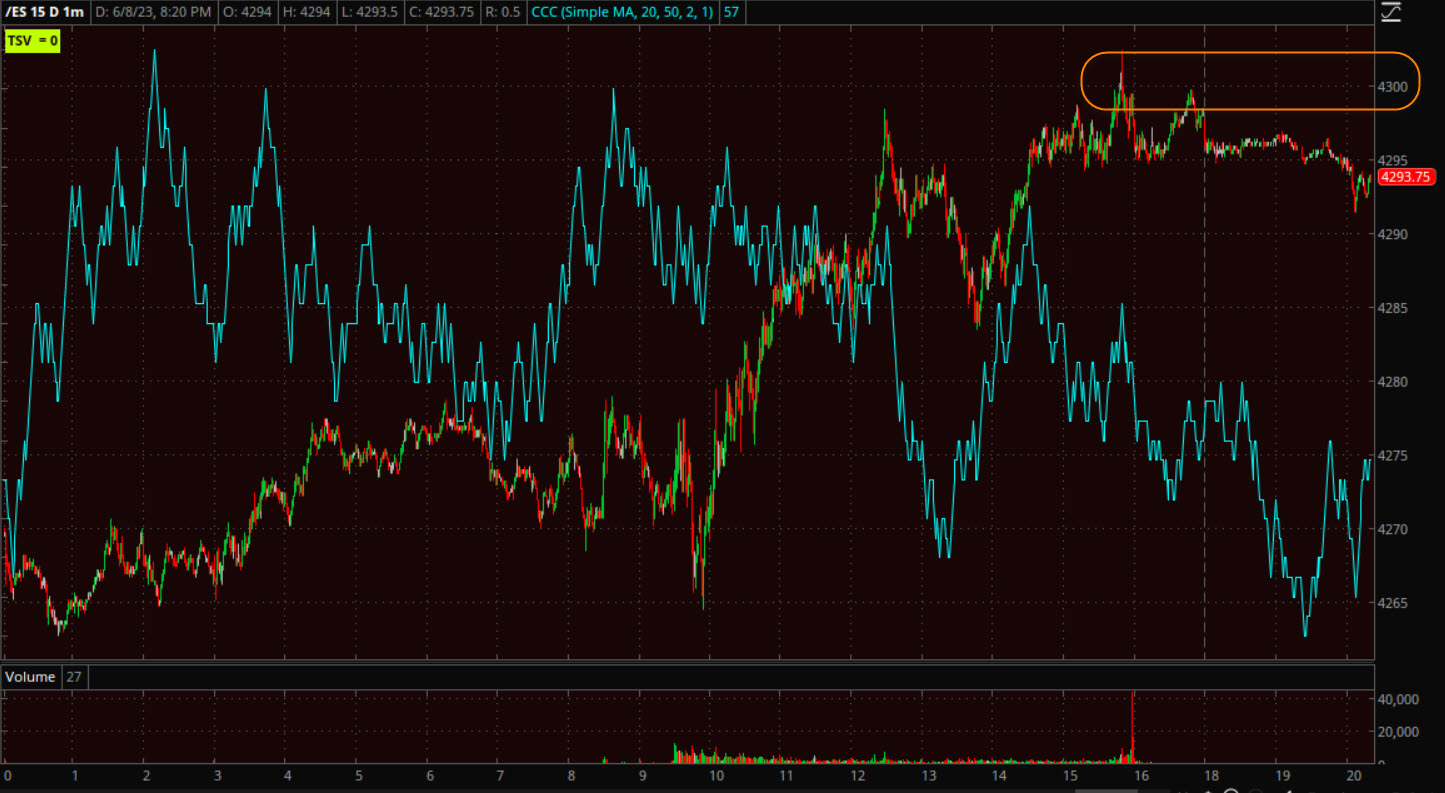 S&P futures (1m) and 3C. I wouldn’t say this is a huge deal, but notice that as S&P futures trade above $4300, 3C shows selling. I think the catalyst to breakout above this key level is just not there yet, unless mom and pop investors buy the “S&P new bull market” nonsense. I’ve mentioned a few times in recent days that it may be that traders/investors don’t want to take on additional long risk ahead of Tuesday’s CPI report and Wednesday’s FOMC. That’s just a theory, but it seems reasonable enough. I don’t see the S&P breaking out above $4300 from Small Cap gains, but rather mega-caps.
The U.S. Dollar index is unchanged.
WTI Crude oil futures are down -0.6%/bbl.
Gold futures are little changed (+0.05%).
Bitcoin futures are down -0.4%.
The 2-year yield is unchanged and the 10-year yield is up +1 bp.
There is no U.S. economic data of note tomorrow.