The stock market got off to a promising start today, led by NVIDIA (NVDA +3.7%) and the mega-cap stocks, many of which have been behind recent market weakness.
Adding to positive sentiment…
- The House of Representatives passed a resolution for large reconciliation bill that calls for $4.5 trillion in tax cuts over next decade. The budget resolution will now head to the Senate for consideration. Once the Senate passes the resolution, the House and Senate will begin drafting the actual legislation.
The early gains carried the S&P 500 back above its 50-day moving average (6,005), but it didn’t stay there for long.
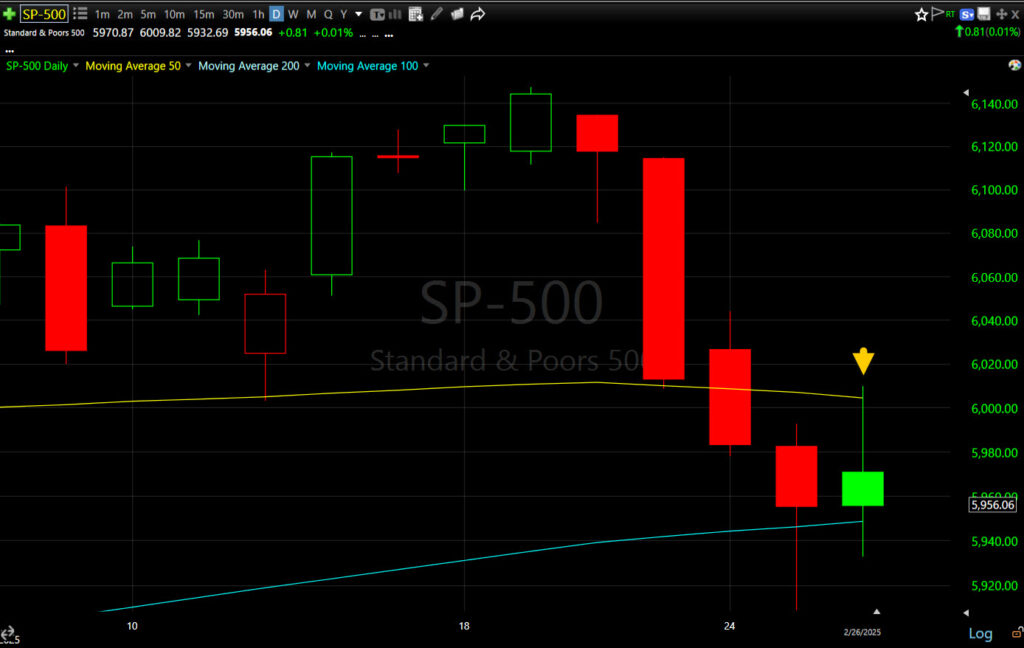 SPX (daily) and 50-day (yellow).
- President Trump commented in a press conference of a cabinet meeting that “I’m not stopping the tariffs,” in reference to Canada/Mexico scheduled to go into effect March 4 and that his plan for reciprocal tariffs will start to be implemented April 2.
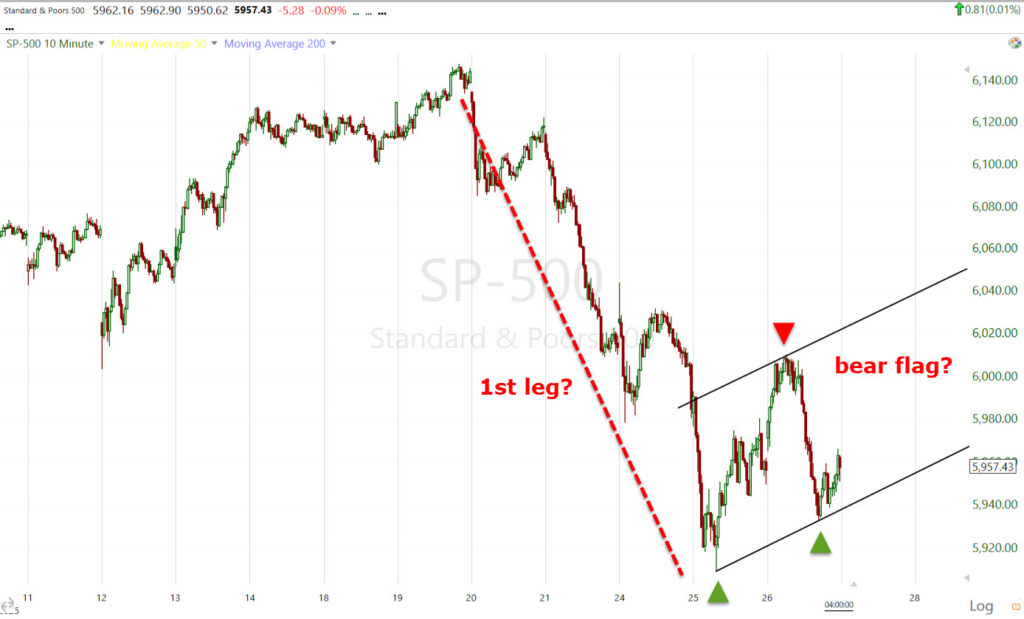
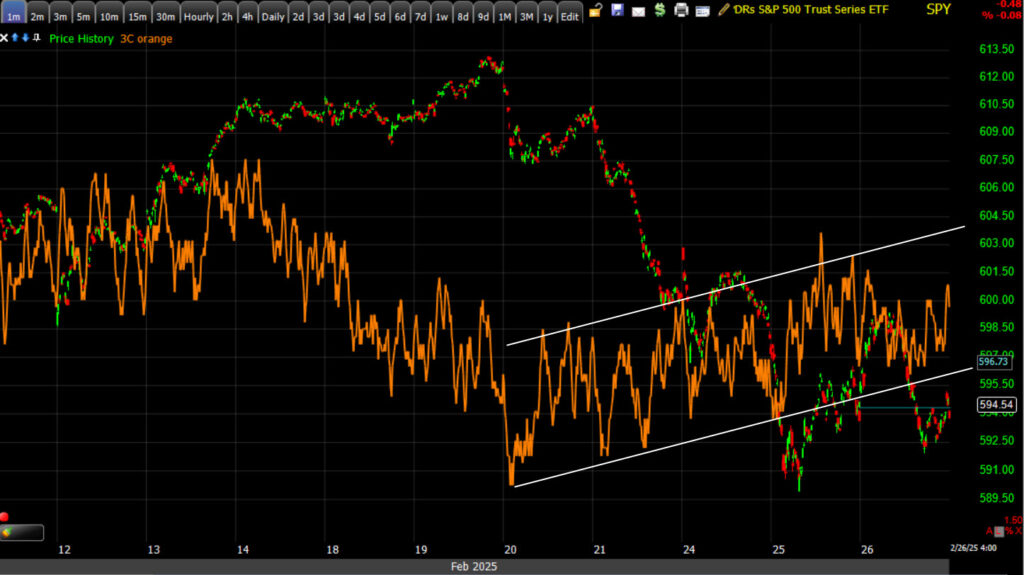
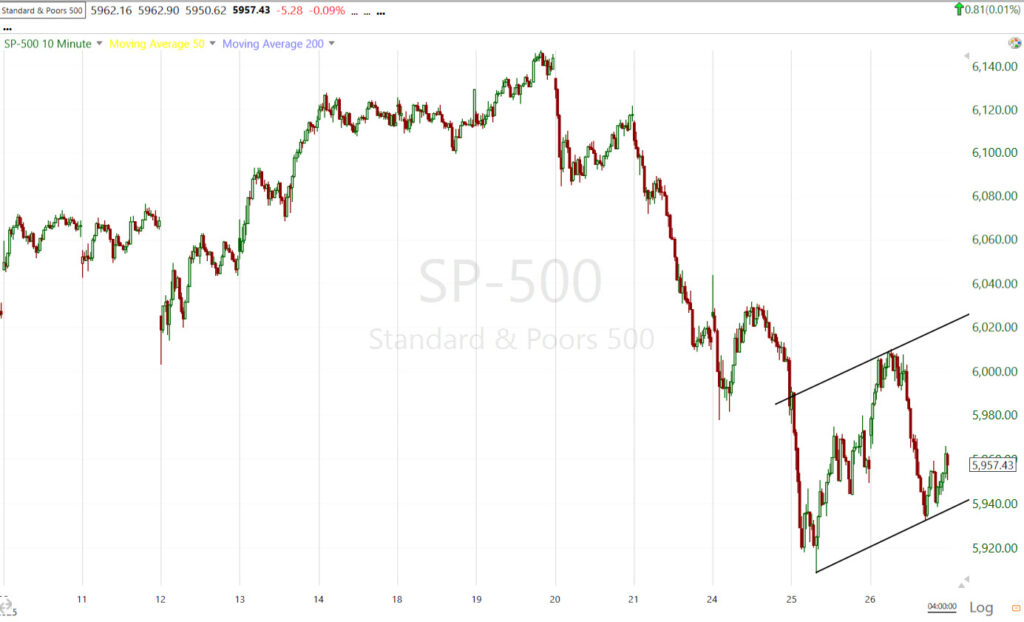
The averages put in a pivot high, then move to a pivot low this afternoon, allowing me to start fleshing out a potential larger bear flag that 3C has been forecasting in days in advance…
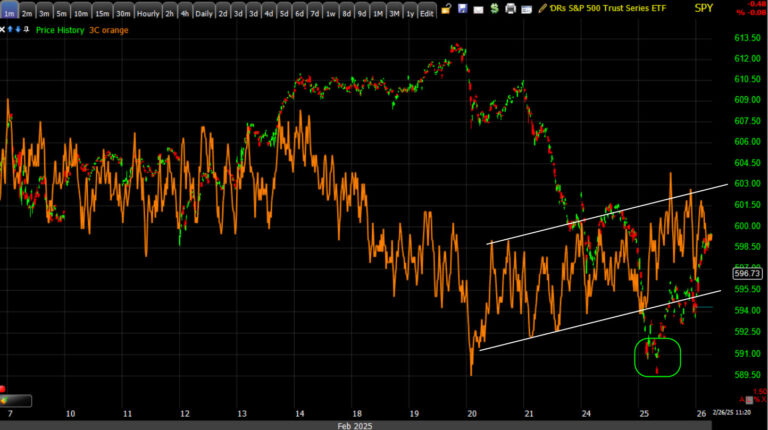 SPY (1m) from my first cash session post of the day… 3C is leading price in to a bear flag-like consolidation.
SPX (10m as of the close) – We’re off to a reasonably good start. I also said,
“We’d need a couple more price pivot highs/lows to confirm a bear flag price consolidation such as 3C is currently reflecting and I’m not sure we have time to get those in place before today’s close and Nvidia earnings after the bell. If Nvidia earnings came in mediocre, not so bad as to cause renewed selling, but not so good as to sponsor a stronger rally, then we’d likely have the time to allow for such a price consolidation to develop, perhaps into the core-PCE data — the Fed’s preferred measure of inflation — on Friday.”
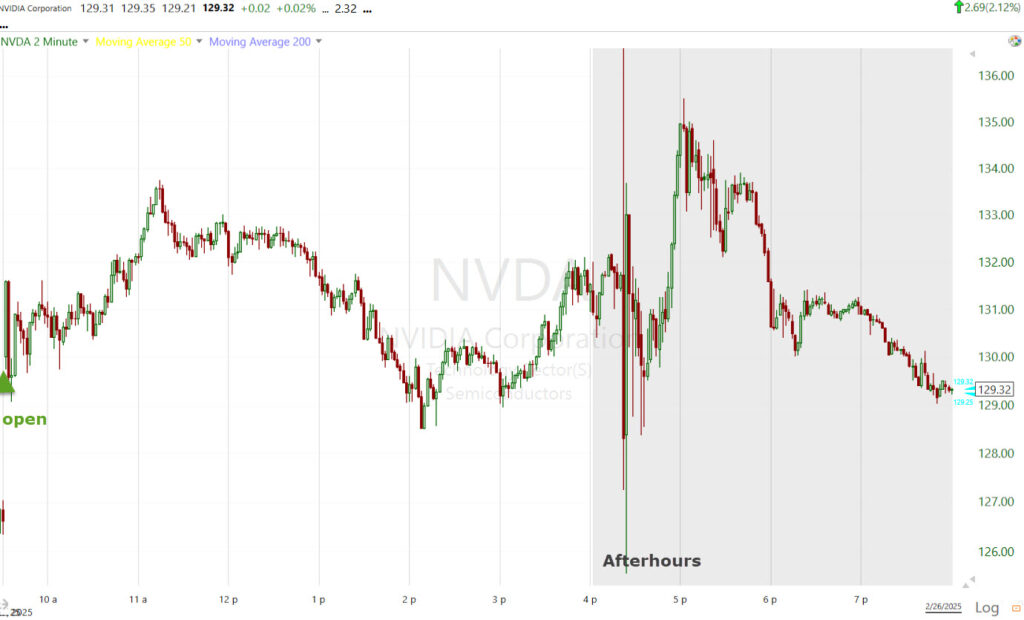
Thus far in extended trading, Nvidia blew away earnings estimates, but the stock hasn’t moved much, which is the scenario described just above for the bear flag to develop further from here.
I updated the measured moves for the larger flags and each of the averages in this afternoon’s, “Larger Flags?” post.
Elsewhere,
- Axios reported that the White House is ordering agencies to get ready for a large amount of firings. I can’t imagine this is going to be helpful for the labor market given some months Payrolls would have been negative if it weren’t for massive government hiring.
- President Trump signed an executive order directing hospitals and insurers to disclose actual prices, not estimates, for healthcare costs
- Trump signed another executive order launching an investigation into copper imports,
- And announced that his administration will create a new visa category of “gold cards” for high-level immigrants with $5 million or more to invest in the U.S.
- EU tariffs will be coming into sharper focvs over the next month. In a sign of things to come, President Trump commented, “The European Union was formed in order to screw the United States, that’s the purpose of it. And they’ve done a good job of it. But now I’m president.”
- President Trump also confirmed Ukrainian President, Zelensky, will be visiting the White House on Friday, which sounds like a deal for rare earth minerals has been struck.
Economic data,
- New home sales decreased -10.5% month-over-month in January (consensus -2.6% decline MoM) to a seasonally adjusted annual rate of 657,000 units (consensus 681,000) from an upwardly revised 734,000 or +8.1% higher (from 698,000 or 3.6%) in December. On a year-over-year basis, new home sales were down -1.1%. The median price of new homes surged to $446k from $415k, the second biggest increase in the median new home sale price on record.
- The key takeaway from the report is that new home sales in January felt the brunt of affordability constraints that were tightened by elevated mortgage rates and higher prices such as we saw in yesterday’s housing data.
- MBA Mortgage Applications Index -1.2% week-over-week (prior -6.6%) with refinance applications down -4% and purchase applications flat
Averages
The S&P 500 avoided a fifth consecutive loss by the narrowest of margins. The Dow, Nasdaq, S&P 500, and Russell 2000 had been up as much as +0.6%, +1.4%, +0.9%, and +1.4%, respectively, at the best levels of the session, yet each of them retreated to negative territory in the afternoon session. The major indices managed to claw their way back from lower levels in the closing stages of trading, but the overall tone was understandably mixed.
S&P-500 ⇧ 0.01 %
NASDAQ ⇧ 0.22 %
DOW JONES ⇩ -0.43 %
RUSSELL 2000 ⇧ 0.19 %
The S&P wasn’t the only average to 1) hold technical support (@ 100-day) yesterday, but to also face technical resistance (@ 50-day today). The Dow did as well…
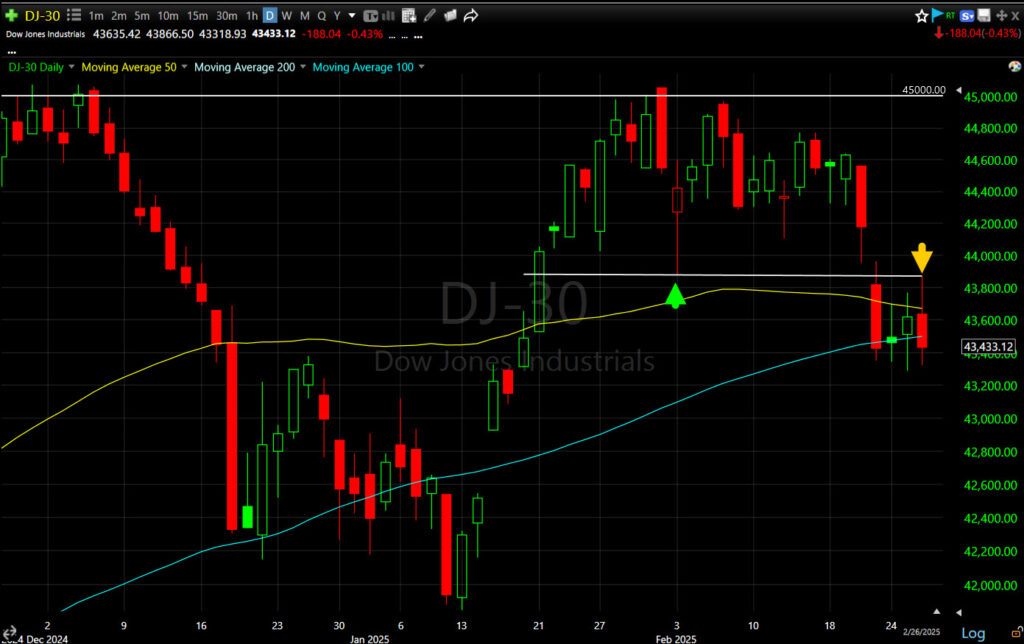 DJIA (daily) w/ technical resistance at the 50-day (yellow) and price resistance (former minor support) at the white trend line.
Here’s a closer view (intraday) of price resistance.
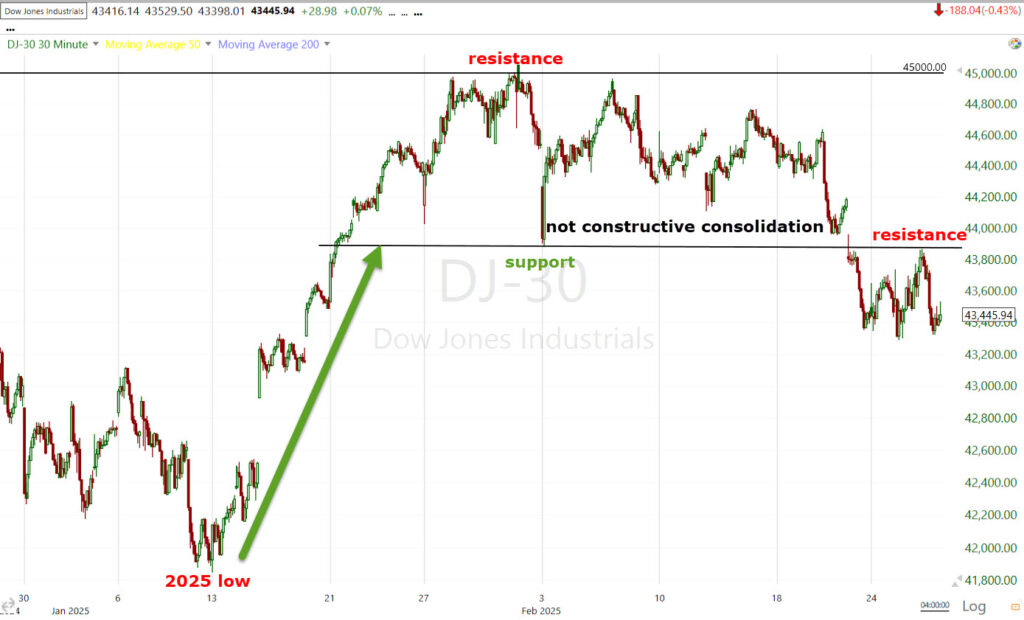 DJIA (30m) rallies off 2025 lows and enters a consolidation. The consolidation was not constructive (price action too volatile). Price broke below the consolidation area’s support, which proved to be resistance today along with the 50-day in a similar area.
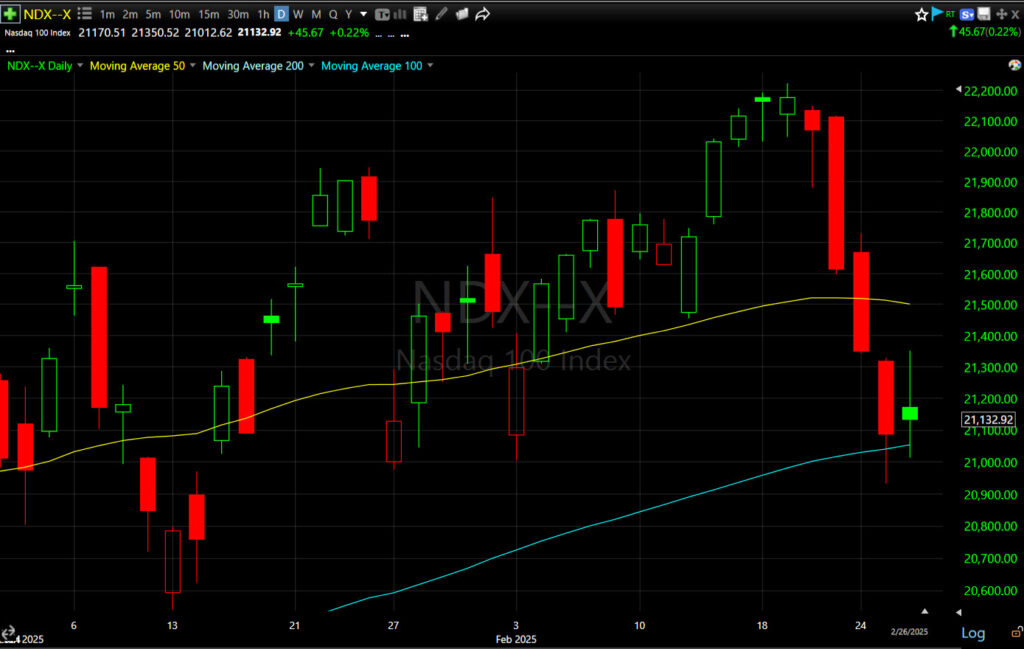 NDX (daily) put in a better showing at technical support (100-day) today, but this is not the typical strong rebound off a technical support level typical of a bull market. Today’s candle was an inside day, potentially setting up the first candle of a Falling Three Methods bearish consolidation. We “may” see a stronger rebound effort as investors and traders gain confidence in technical support holding for a second day, but like the S&P, NDX’s 3C chart reflects a probability of a larger bear flag consolidation just starting to develop and we can see something similar to the SPX on the NDX’s intraday price chart.
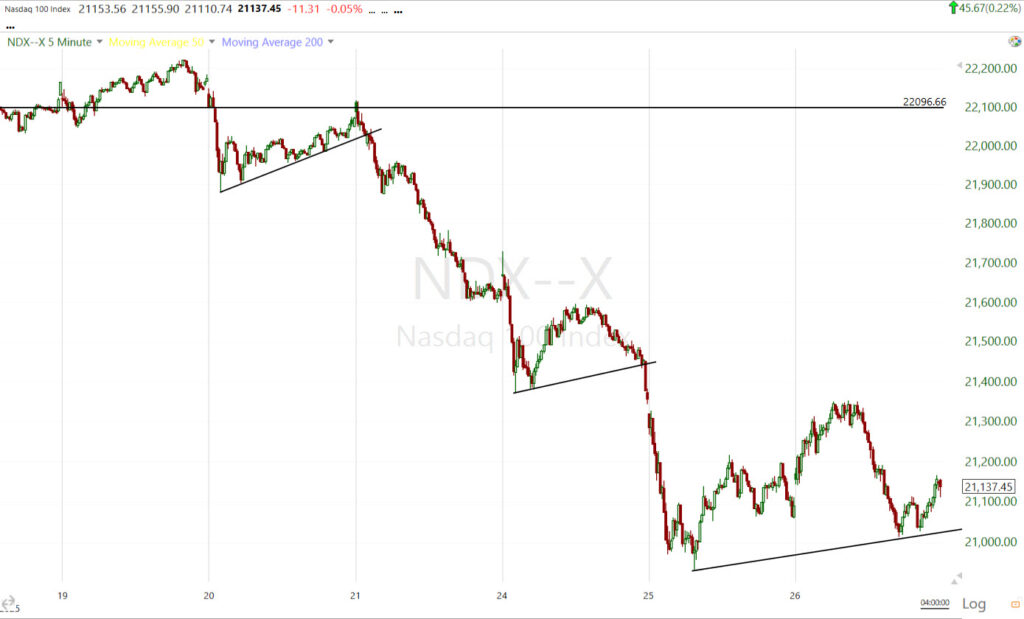 NDX (5m) – A larger bear flag developing here suggests a larger second leg down measured move. See the earlier post linked above with revised second leg measured moves from earlier today.
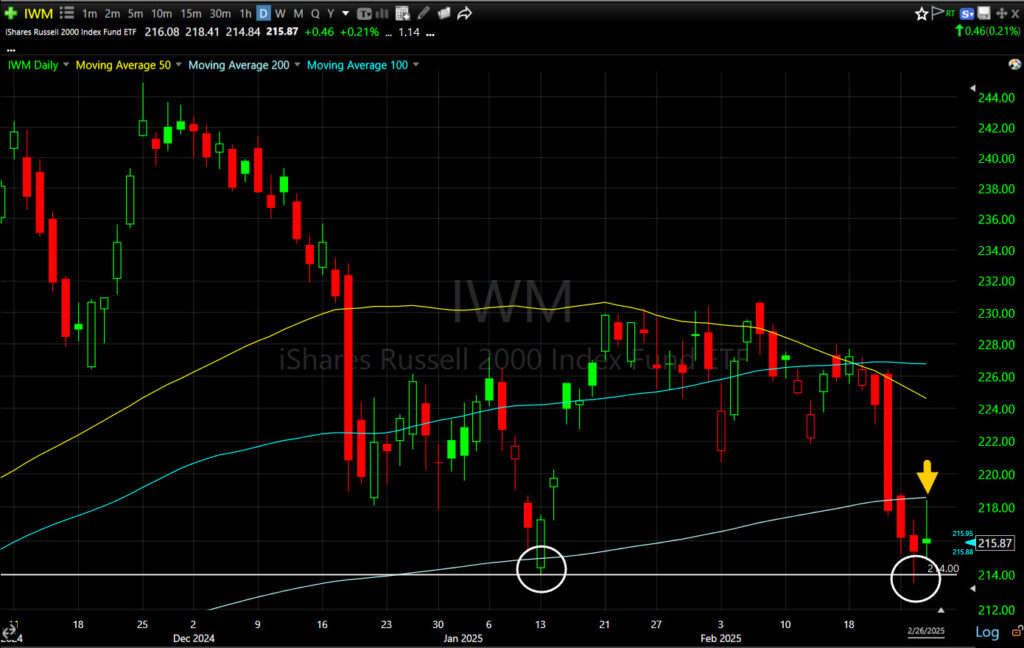
Small Caps were a mix of good and bad news, too. As highlighted early yesterday, IWM $214 looked like reasonable price support,
“Small Cap IWM has no notable technical level, but perhaps price support in the $214 area.”
IWM (daily) – Price held the $214 area yesterday and again today on a test, however ,the area of the 200-day above acted as technical resistance.
I put out a fairly comprehensive update of 3C charts in my first post of the cash session today, linked here. There were no notable changes at the close. The current 3C charts suggest the highest probability is the same as what I laid out late last week and in the weekend video update – That is still a larger bear flag consolidation, although my initial assumption was that it would happen earlier this week into Nvidia earnings and Nvidia would be the catalyst. I do think we could have a fairly well-formed larger bear flag by Friday morning’s Core-PCE data, although we wouldn’t have a lot of time to waste getting in two more price pivots tomorrow.
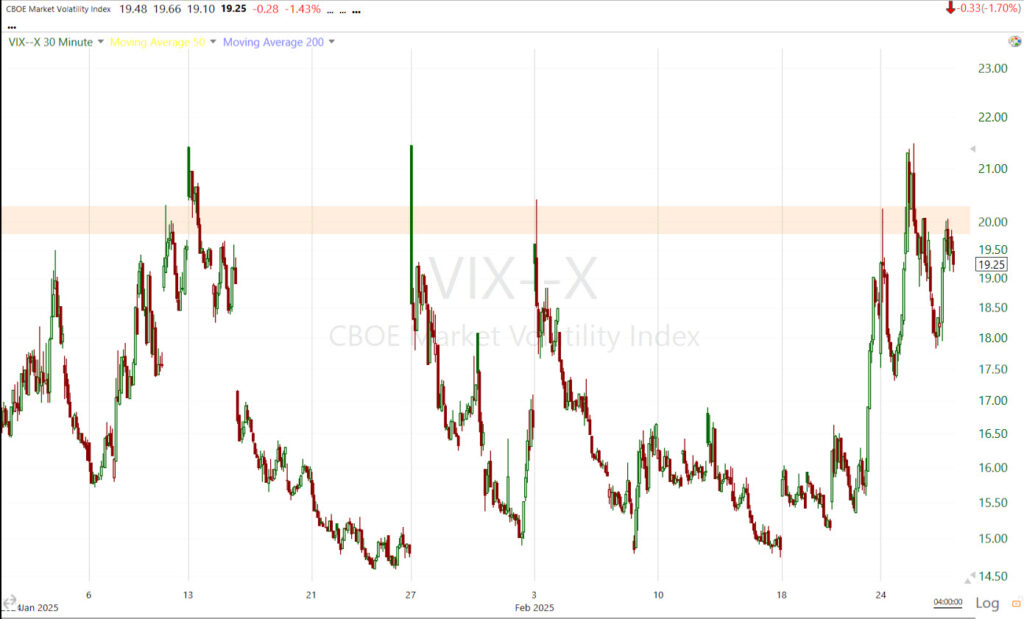
VIX (-1.7%) was unremarkable on the day. Without the context of a 45% move since the first ABI signal, VIX appears very modestly relatively weak on the day. Within that context, it held up just fine. VVIX (-2.25%) was a little weaker on the day. In average percentage terms for an ABI signal, VIX is pretty close to the long-term average of +50%. A bearish consolidation in the averages and a second leg down would almost certainly send VIX above $20 and kickstart a volatility feedback loop and increased equity deleveraging, which is when we get the really big moves in VIX.
VIX (30m)
The ABI hasn’t given a new closing signal since Thursday or a sub-14 intraday signal since Friday when it hit 9.15 at its low, but this is completely normal. Once the move starts, we get more uniformity in market breadth and the ABI rises (23 today). However, once an ABI signal is triggered, the signal is good for at least the next 30-days on average.
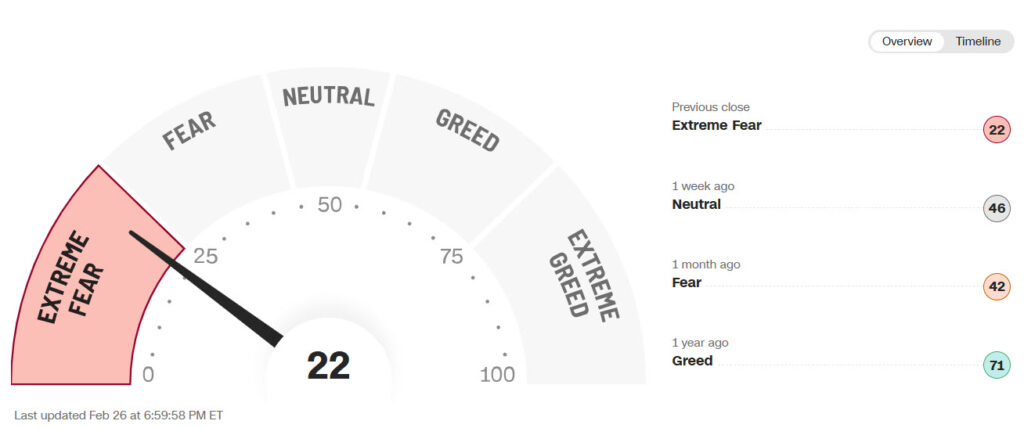
The Fear and Greed Index was unchanged today at 22. It is nearing a contrarian extreme.
I have often mentioned that it’s not a good idea to short a market that’s at bearish extremes, although that tends to be human nature (recency bias). However, I will say that the market correction has been orderly and not typical of the readings produced in other areas like deep and sharply oversold breadth and/or Volatility’s Term Structure entering backwardation (a sign of investor panic).
The strongest sellers’ capitulation (oversold) events have all 3 elements: Extreme Fear Sentiment; Extreme Oversold Breadth; Volatility’s Term Structure in Backwardation. On the last concept…
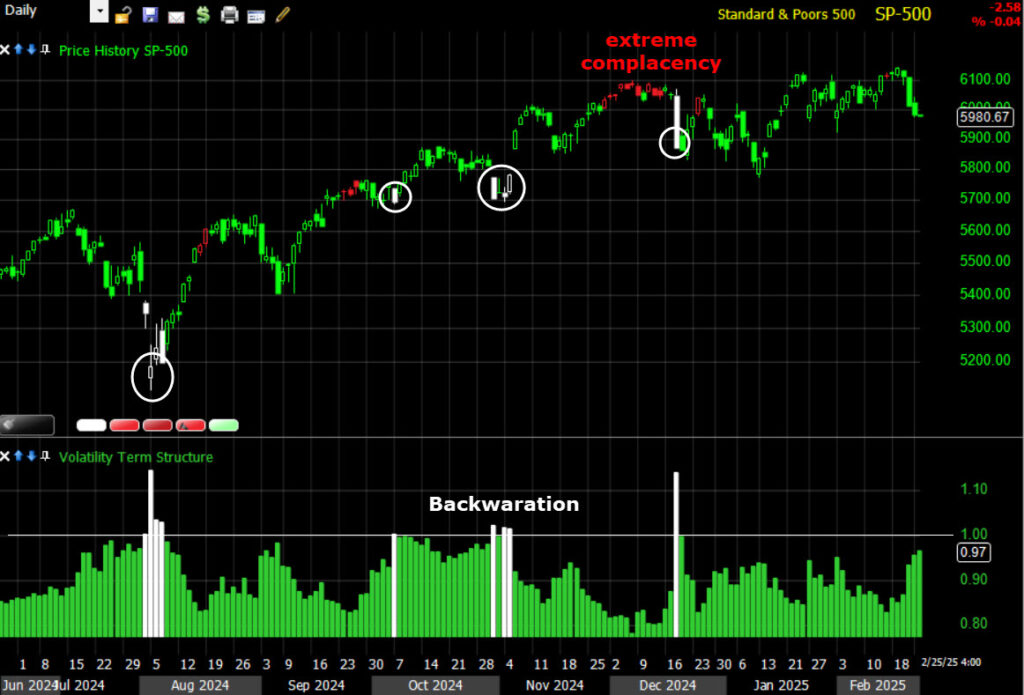 SPX (daily) and Volatility’s Term Structure. The Bars and Candles painted white are when volatility’s term structure moves into backwardation (extreme fear and panic). Unless we’re in the midst of an outlier crash event like Covid 2020, more often than not, when we get to backwardation we’re close to a panic low as you can see by some examples above. The red painted signals are extreme complacency. While the latter signal doesn’t mean markets have to fall, they do signal an unusual level of complacency.
The fact we don’t have a backwardation signal doesn’t necessarily mean the markets correction has to continue, but it does leave room for more selling, whereas if we were already seeing backwardation, the chances of finishing up a larger bear flag and a embarking on a whole next second leg down would be less likely. The fact the market’s correction has been orderly is not necessarily a bullish development as it leaves room for more selling to the point in which the market does get panicked and disorderly, which would typically accompany a “Sell everything” vibe. As I’ve demonstrated a few times this week, the defensive sectors have been outperforming as many are moving higher. In a panic-selling environment, even they’d be sold.
The bottom line is that the market doesn’t have to continue lower from here, but I’m not getting the kind of signals that make further losses unlikely.
S&P sectors
At least 8 of 11 sectors were higher this morning. By the close 8 of 11 were lower. Technology, one of the worst performing sectors yesterday, was the best today. Consumer Staples, one of the best performing yesterday and year-to-date coming into today, was the worst today. This is behavior that’s typical of 1-day oversold signals (the prior day), although we didn’t have any yesterday.
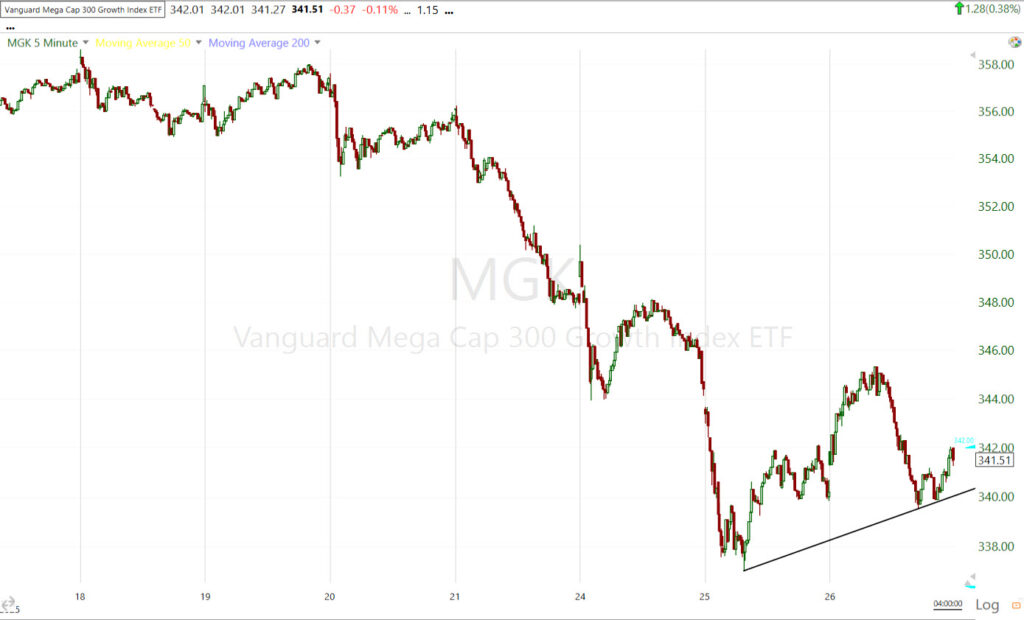
Mega Caps (MGK +0.4%) held the 100-day today…
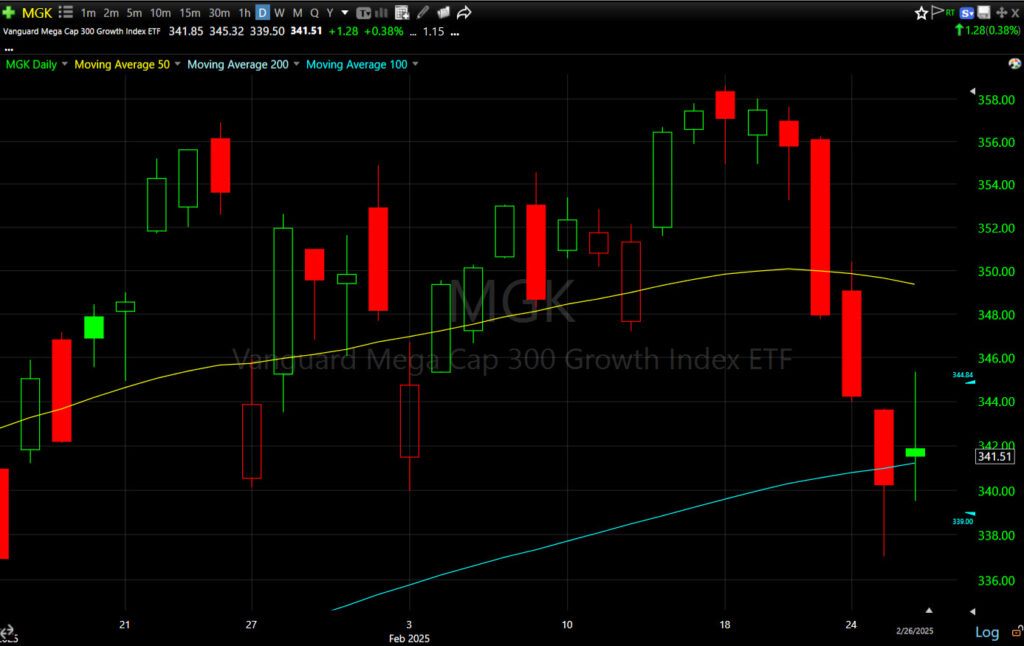 MGK (daily) and posted an inside day – potentially the first inside day candle of a Falling Three Methods bearish continuation pattern, although yesterday’s real body is not exceptionally wide, which would make a Falling Three Methods easier to accomplish as the next two days’ real bodies (open/close range) have to fit within yesterday’s real body (open/close range).
It looks like the Mega Cap Growth index (MGK) may also be starting to form a larger bear flag, which can happen regardless of a Falling Three Methods pattern, but many Falling Three Methods also happen to be bear flags.
MGK (5m) – Like the averages and many other assets, the more price pivots we get to confirm the flag’s trend lines, the higher quality the signal and probabilities of a second leg down. Price is actually early in the flag with today giving us the second pivot (the minimum to draw a trend line).
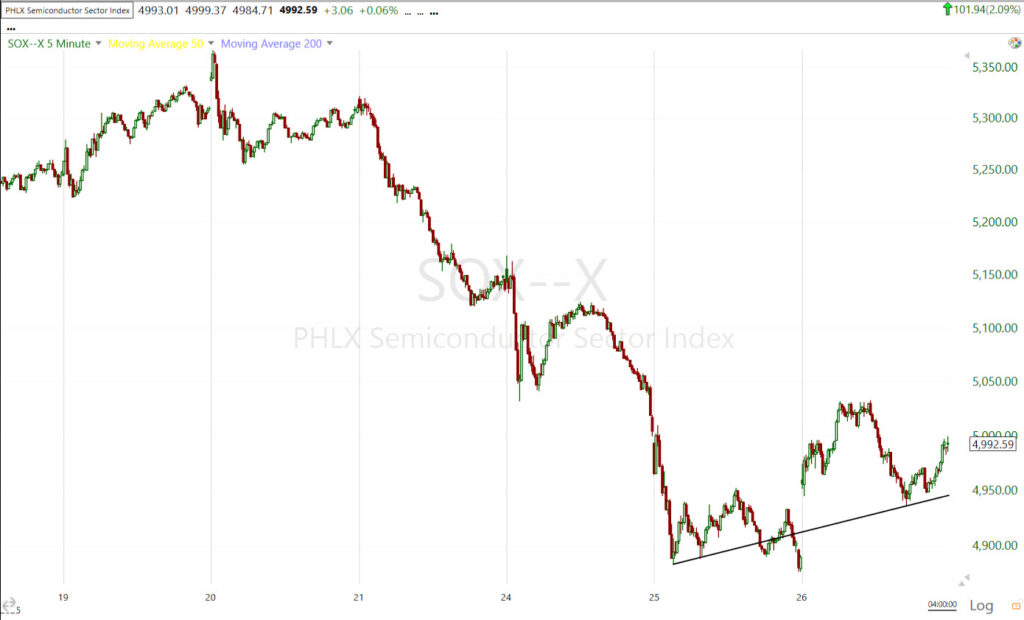
NVIDIA (NVDA +3.7%), which was down -9.1% over the last four sessions, exhibited relative strength today that helped the S&P 500 Technology sector and Philadelphia Semiconductor Index (SOX Index +2.1%) outperform. SOX may also be forming a bear flag similar to the averages and of MGK above, but until we get some more price data to confirm, my best guess is that price (whether in a bear flag or not), back-tests the trio of moving averages that failed as support near $5100, from below.
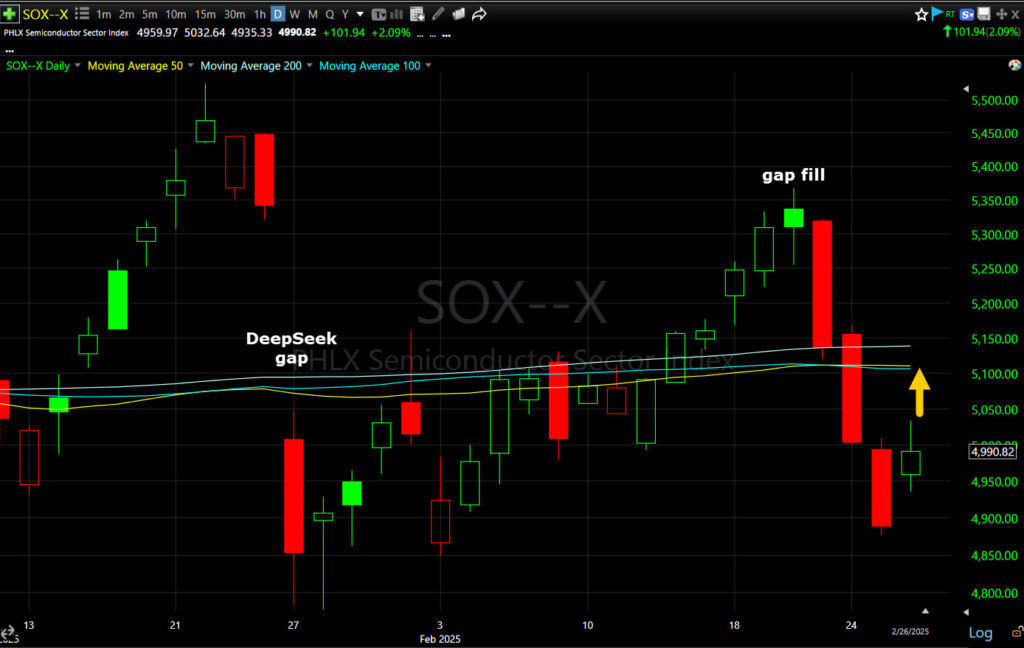 SOX (daily) – The back-testing of failed technical levels from below is similar to the gap fill concept in terms of probabilities, maybe not quite as high, but up there.
SOX’s (5m) trend line is almost certainly going to be revised. I almost didn’t include it, but wanted to show the low price conviction, upward slanting parrellogram-like trend, correcting/consolidating against the preceding price trend (down) that’s the hallmark of a bear flag. A bear flag of the size I envision could form and test the trio of moving averages from below that reside at the $5100 area.
Today had a corrective feel in other ways too, such as the Momentum (+0.6%) and Growth (+0.4%) style factors outperforming the Value (-0.35%) style factor. The relative performance between them has been exactly the opposite over the course of the recent market correction.
Materials ⇩ -0.05 %
Energy ⇩ -0.57 %
Financials ⇩ -0.22 %
Industrial ⇧ 0.06 %
Technology ⇧ 1.09 %
Consumer Staples ⇩ -1.91 %
Utilities ⇧ 0.42 %
Health Care ⇩ -0.72 %
Consumer Discretionary ⇩ -0.41 %
Real Estate ⇩ -0.49 %
Communications ⇩ -0.18 %
Internals
Advancers held a 2-to-1 margin over decliners at both the NYSE and Nasdaq Composite this morning. By the close both lost the edge, finishing more mixed with 1346 NYSE Advancers and 1416 NYSE Decliners. Volume was a tinge lighter at 1.05 bln. shares at the NYSE.
There are 3 criteria for 1-day internals signals – a majority of S&P sectors (up or down), Advancers/Decliners having at least a 2-to-1 margin or better, and my Dominant Price/Volume Relationship scan. Advancers/Decliners already rule out any 1-day internals signal.
The Dominant price/volume relationship for the component stocks that make up each of the major averages was dominant today at Close Down/Volume Down. This is the most benign of the 4 relationships and is the most common relationship reflective of consolidation days. While there’s no 1-day overbought or oversold signal, internals are screaming, “Consolidation day”, which is exactly what I look for in the type of consolidative price action we’re seeing develop… at present it’s most likely a bear flag.
Breadth oscillators are low and near oversold territory at 23.5 (scale 0 to 100), but they are nowhere near the extreme oversold signals we have seen that are below 1 or 2. They are not an immediate concern. They don’t point to probabilities that argue against the potential for a second leg down. However, if we did get a full second leg measured move, I would take at least partial profits at the measured move and maybe leave some runners if the environment remains favorable. I would expect that as a measured move is hit, breadth indicators will go deep oversold and a short term market low would be found shortly after. When we get big sell-offs, a lot of traders get caught up in the excitement and the extent of a bearish move with VIX spiking. This is in my view, the exact wrong time to initiate new short positions. It’s the time to be focusing on harvesting profits and getting ready for the next swing trade which would almost certainly be “long” for a reset of breadth oscillators back to overbought (unless we had a clear market top with probabilities of entering a bear market and that’s purely speculative at this point).
I’m not going to post a dozen breadth charts that show the rising probabilities of exactly that kind of environment taking shape as I just did in the last week, but they are there. I’ll give an example or two. Obviously they are not as powerful visually today as they were a week ago when they had similar signals, but the S&P had just made 2 new record highs. Pay attention to the trend.
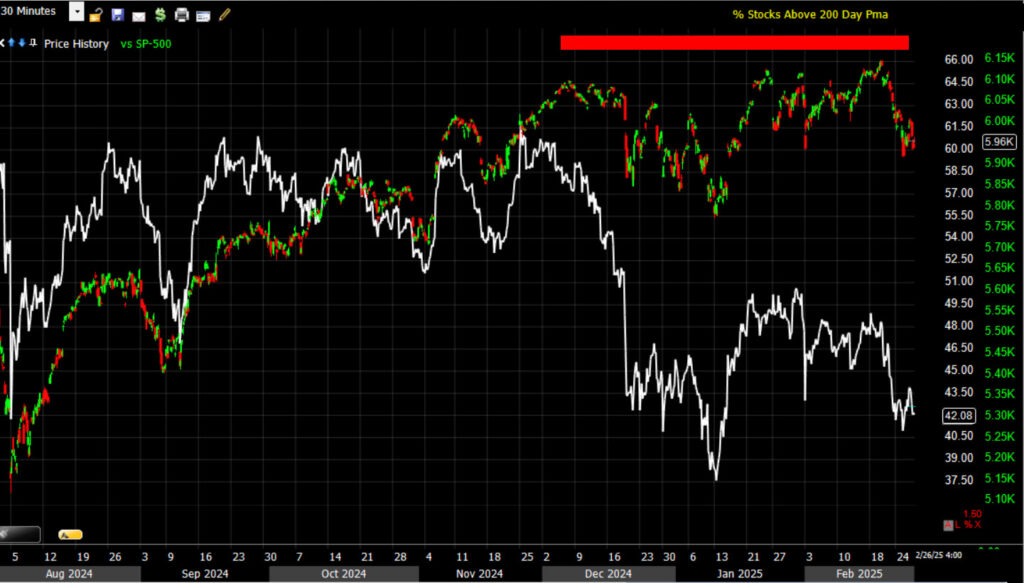 SPX (30m) and Percentage of ALL NYSE Stocks Above Their Long -Term, Primary Trend 200-day SMA. you saw this last week for S&P-500 component stocks. In this case, it’s the entire NYSE index. I’m using this in search of Leadership? For instance, the Small and Mid-Caps that were bid election night and that aren’t representative of stocks in the SPX/NDX, but the domestically focused Small and Mid-Cap stocks that many expected to benefit from Trump’s America First policies. What I see is a huge number of stocks falling below their own long term 200-day, or you might say, falling into their own bear markets. The percentage went from a steady bull market range of 60% down to 40% – less than half.
Included several key charts in the Feb. 20th Daily Wrap, “Shots Fired” in the same “Internals” section, and I added the long term trend 3C charts that made sense of it all and put a face of money flow on the breadth charts.
Treasuries
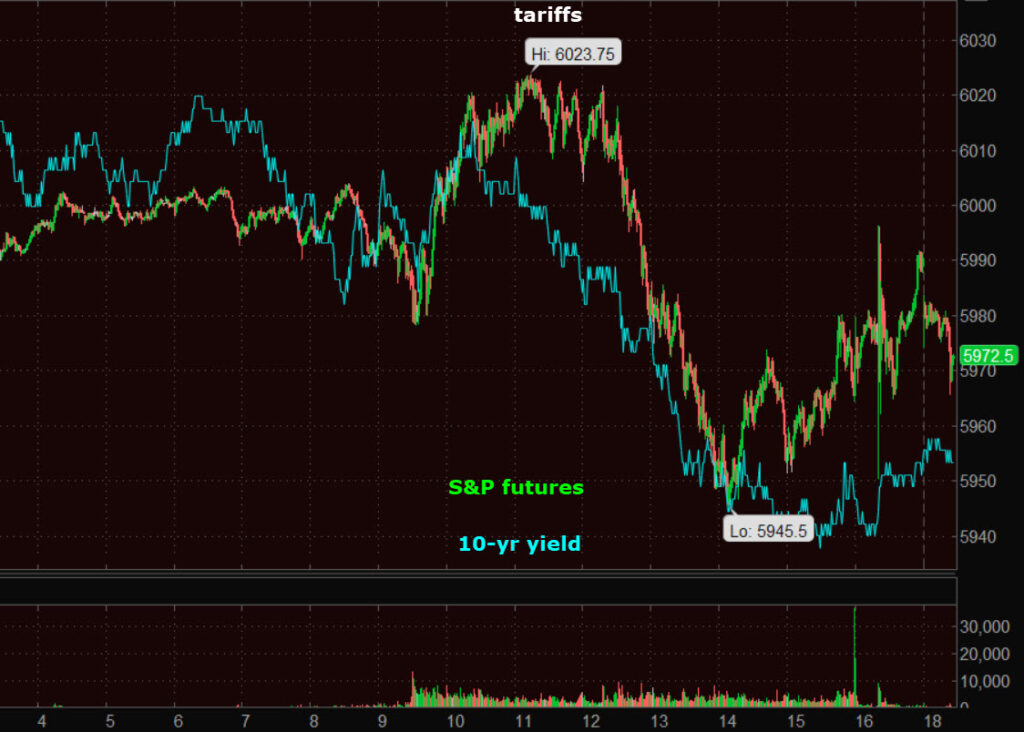
The Treasury market likely saw some safe-haven demand, albeit notably lighter than in recent days. However, growth concerns are still quite evident with yields falling after soft economic data this morning and the Trump comments on tariffs.
The 2-yr yield settled the day down three basis at 4.07% while the 10-yr note yield fell five basis points to 4.25%, leaving it down 30 basis points for the month.
The Treasury market favorably digested today’s $44 billion 7-yr note auction which kept some pressure on yields this afternoon.
The market has been exclusively focused on economic growth concerns, but as the chart below shows, inflation data continues to surprise to the upside (as growth surprises to the downside)…
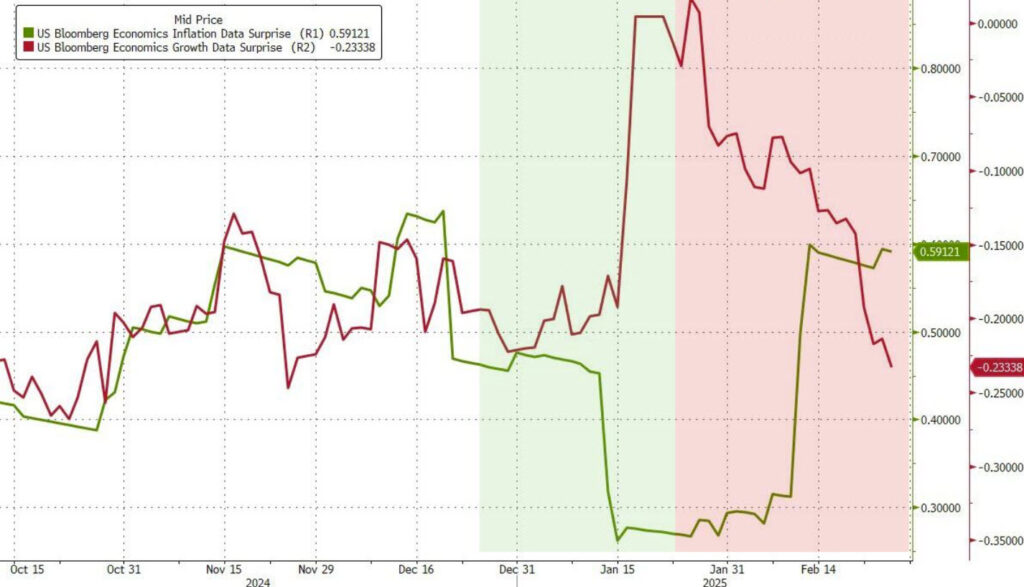 Economic Growth Data Surprises (to the downside) in red. Economic Inflation data Surprises (to the upside) in green, or what’s commonly referred to as “Stagflation,” stagnating growth in an inflationary environment. Weak growth (E.g.- Recessions) can tame inflation, but given the data we’re working with now, I am surprised how singularly focused investors are on the Growth side of the Fed’s mandate and less so on the inflation side.
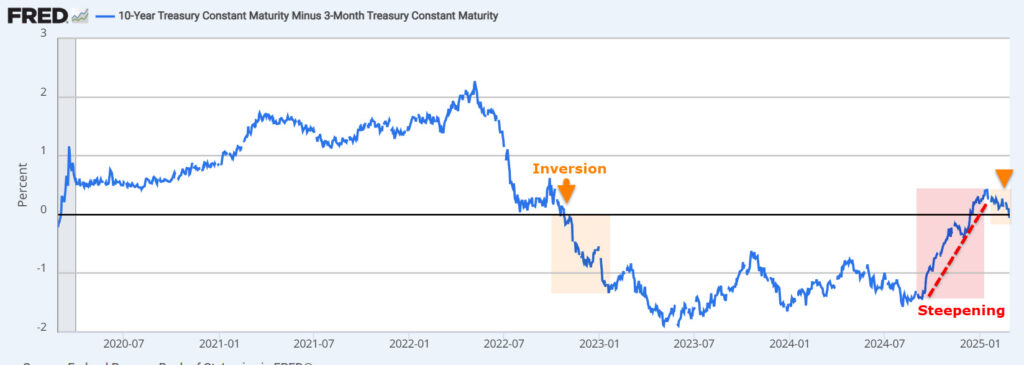
I’m not going to go through a primer on yield curve signals. You’ve likely heard them here many dozens of times times. It is interesting, though, that after the yield curve sharpened steeply out of inversion (prompted by Fed rate cuts), which tends to be the signal of a more imminent recession warning after inversion of the curve, we have recently seen parts of the yield curve move back into inversion amid investor economic growth concerns. Here’s the Fed’s preferred yield spread with regard to macroeconomic/recession signals, the 3-month less 10-yr yield spread…
3 month – 10-yr yield spread — Source; Saint Louis Federal Reserve Bank/FRED
Historically, this happens because investors start betting that the economy will slow down, prompting them to pile into longer-term bonds, driving those yields down below short-term rates.
Currencies and Commodities
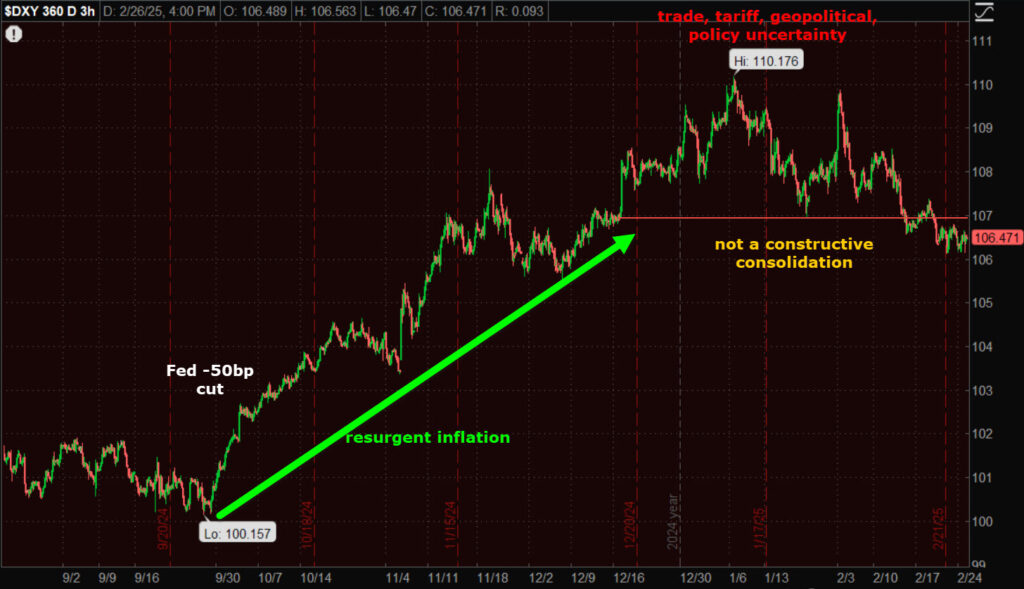
The U.S. Dollar Index closed down -0.2% to $106.47.
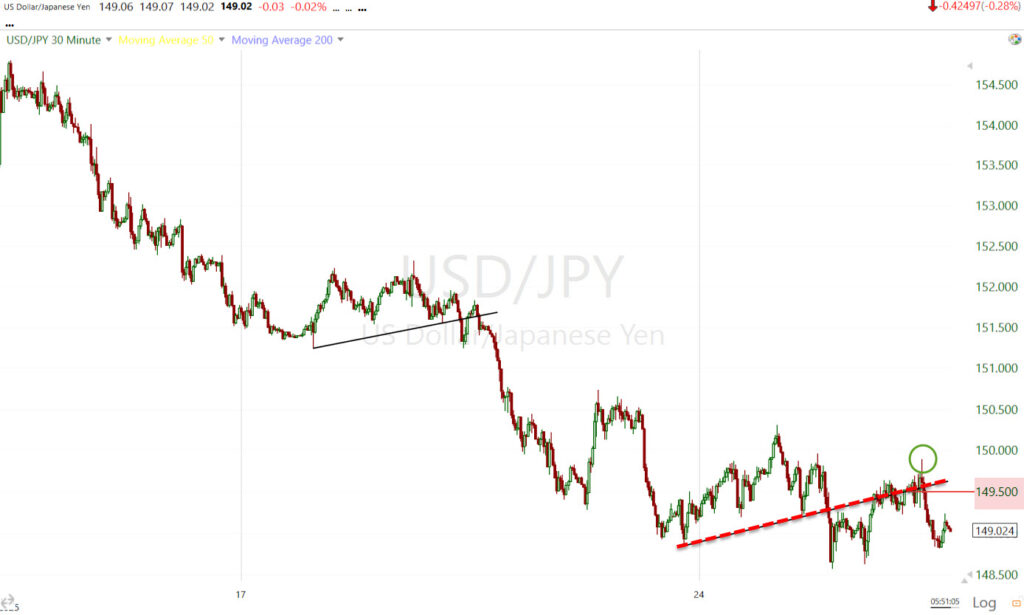
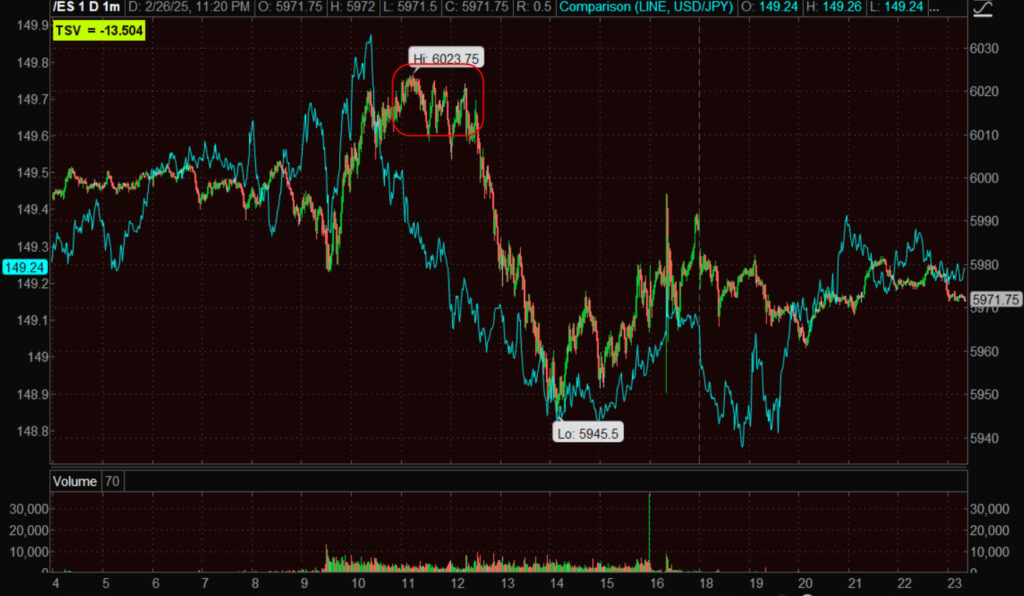
Last night I wrote that for USD/JPY to be more of a tailwind for stocks price would have to trade above $149.50 and invalidate the most recent bearish consolidation. Price briefly traded up to $149.89, then back below $149.50 – in other words it didn’t make the kind of move needed to invalidate recent bearish tone and help support market gains.
A different perspective intraday…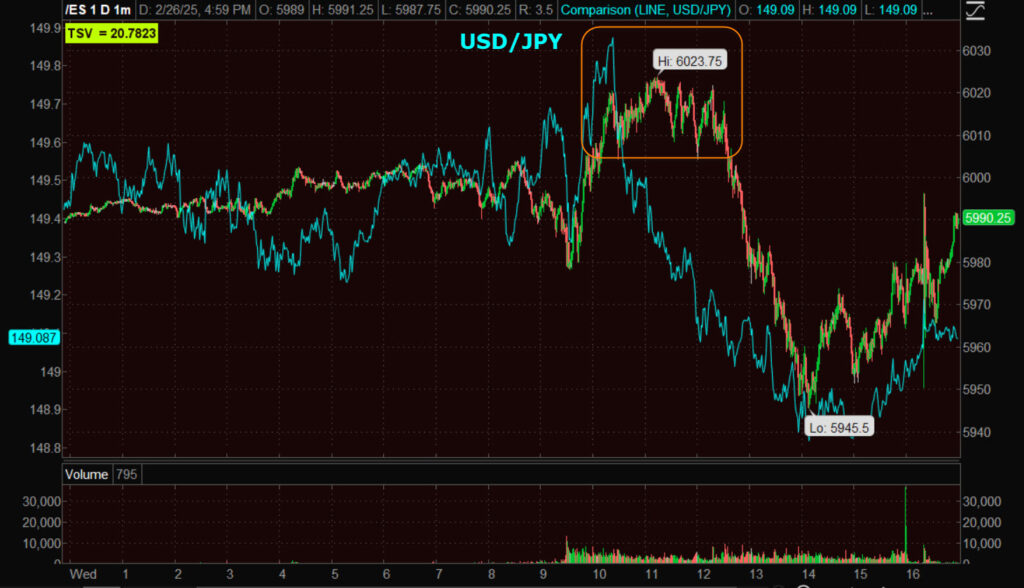 USDJPY vs. S&P futures (1m) – The Dollar-Yen’s relative weakness at session highs was about the time President Trump made the tariffs comments and as SPX was bumping into its 50-day SMA as resistance. The Dollar-Yen isn’t the end-all, be-all of markets, but the divergence didn’t help stocks.
WTI Crude oil closed lower by -0.45% to $66.82/bbl., reflecting economic slowdown fears along with lower yields again today. Price action doesn’t look great, but it’s not as bad as it could be.
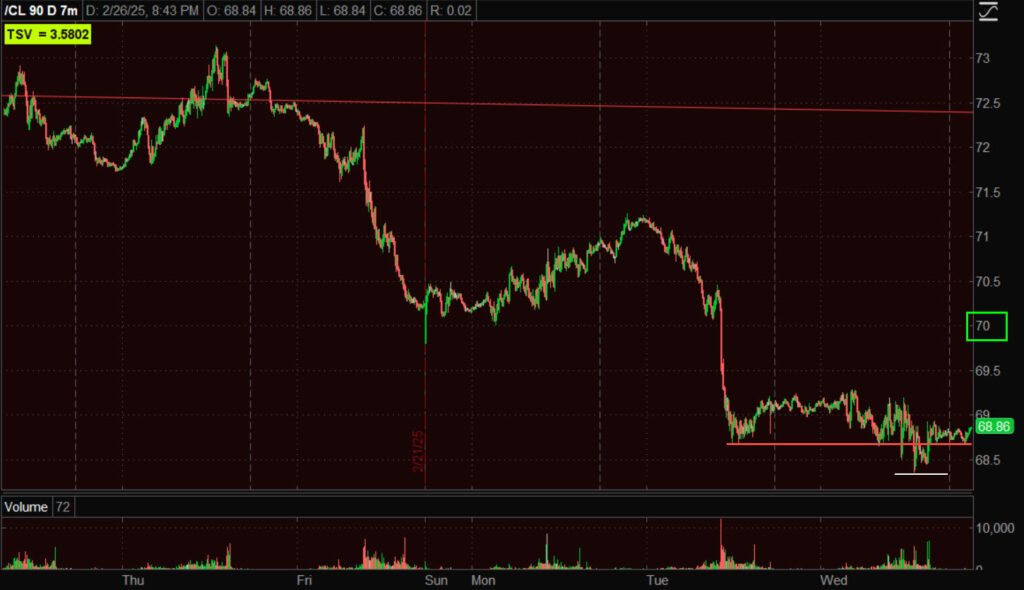 WTI (7m) – Believe it or not, an upward slanting parrellogram consolidation (flag) is more bearish than this lateral (rectangle) price consolidation. Price modestly undercut the trend line with a low at $68.36 and put in a small hammer candlestick. The $68.36 level is nearby minor support to watch in the day/s ahead. Price needs to get back above $70 in fairly short order to start to mitigate yesterday’s damage. If it can do so on increasing volume, all the better.
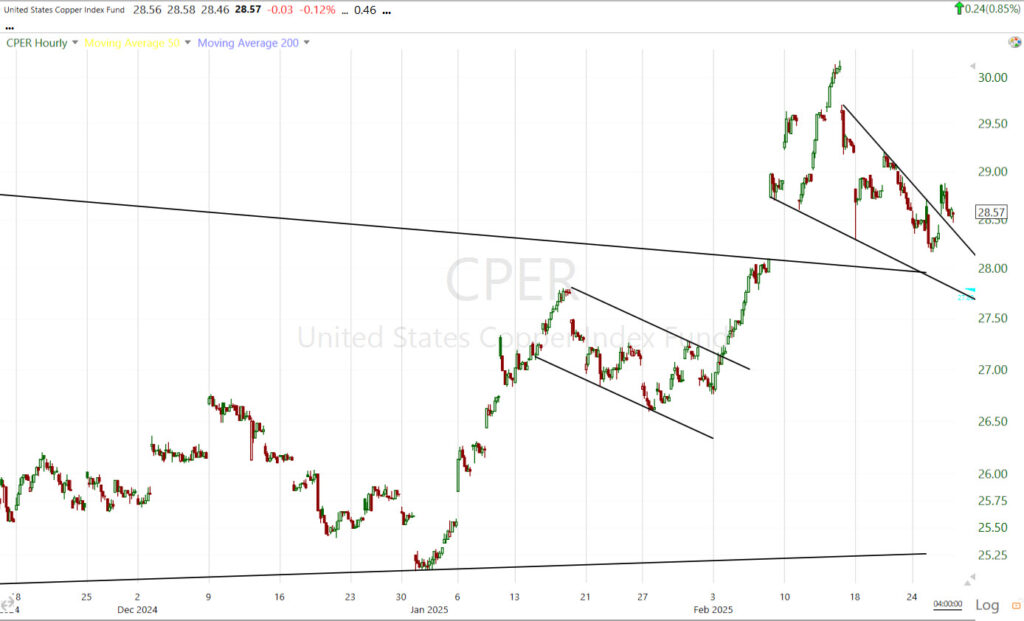
While the circumstances are vastly different drivers between Crude and Copper recently, they’re both macroeconomic leading indicator assets for growth and inflation. Copper can sometimes be more insightful, but crude is far more influential with regard to inflation. Copper has been looking better and better over recent months…
While the short-term dynamics over the last week are unique to each, I’m thinking probabilities favor that the two trends come into better alignment and more consistently reflect the growth, and more so inflation, message of the markets.
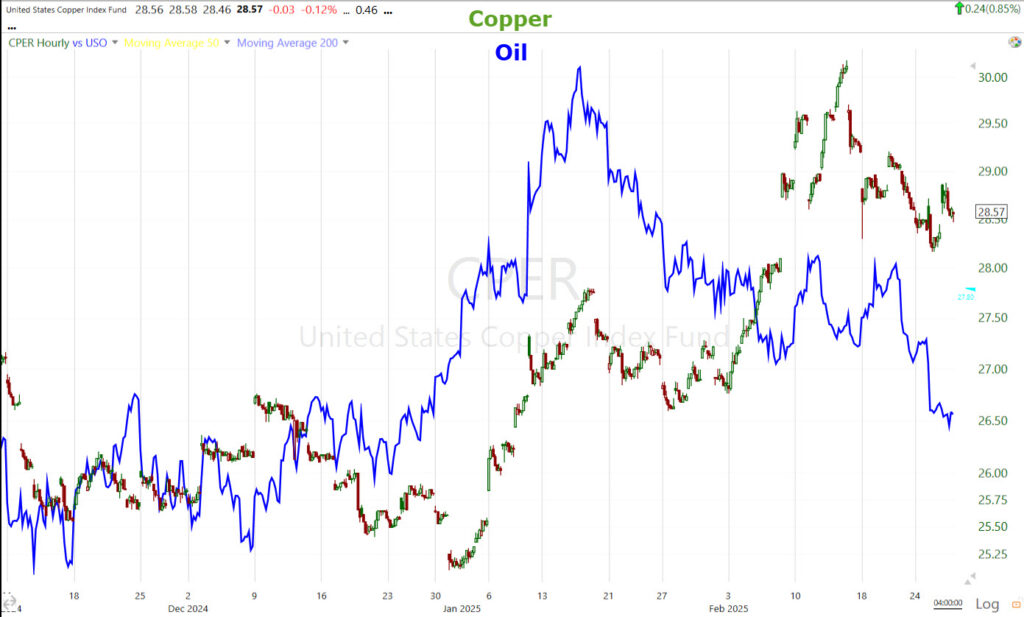 Copper/Oil’s (60m) recent relative performance has diverged. My money is on them realigning with regard to the macroeconomic inflation trend.
Gold futures had a small move of about +0.1% Yesterday’s sell-off in gold was unexpected in the face of a weaker dollar and lower yields, and ugly on heavy volume. Gold did find support Tuesday near $2900 which was the one silver lining (I’m very interested in $2885 holding, but $2900 is a stronger psychological level). Gold tested down to $2903.30 today and held with a close up to $2931.70. The day didn’t exactly post a bullish Tweezer bottom candlestick pair, but relative to $2900, it was close enough in concept…
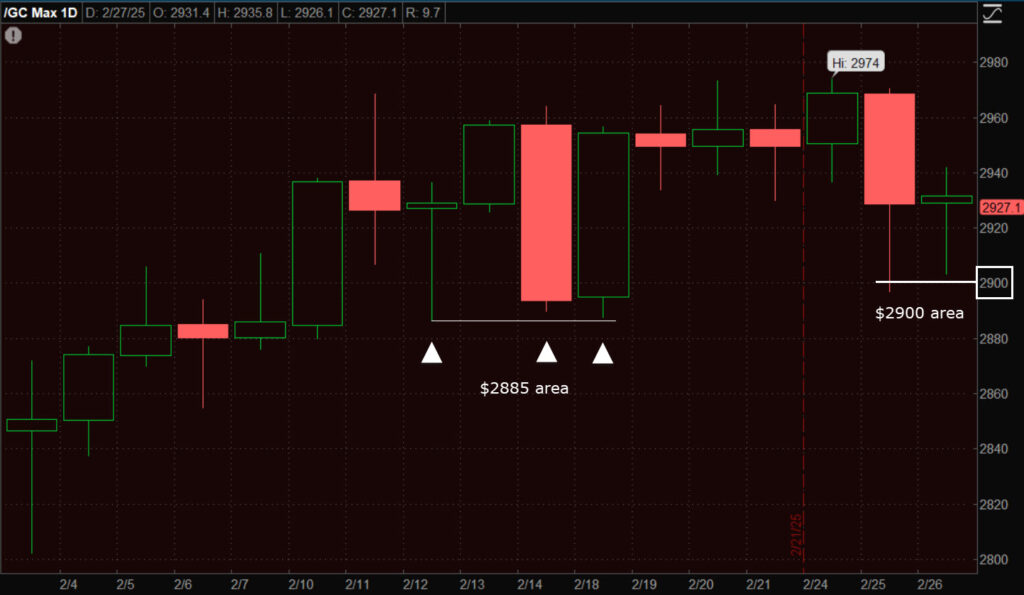 Gold (daily) – The Tweezer bottom concept here at $2900 is exactly why I’m keen on $2885 holding as we got support and successful tests in the area just prior to making new highs. A break of $2885 might not be catastrophic from a P&L perspective, but would not be good from a trend perspective. Depending on your time horizon, portfolio construction and other personal factors. For me, from a trader’s perspective, I personally would consider a stop or lightening up on position sizing with a break/close under $2885 as that starts to change the price trend in a very subtle way. “Changes in character lead to changes in trends”.
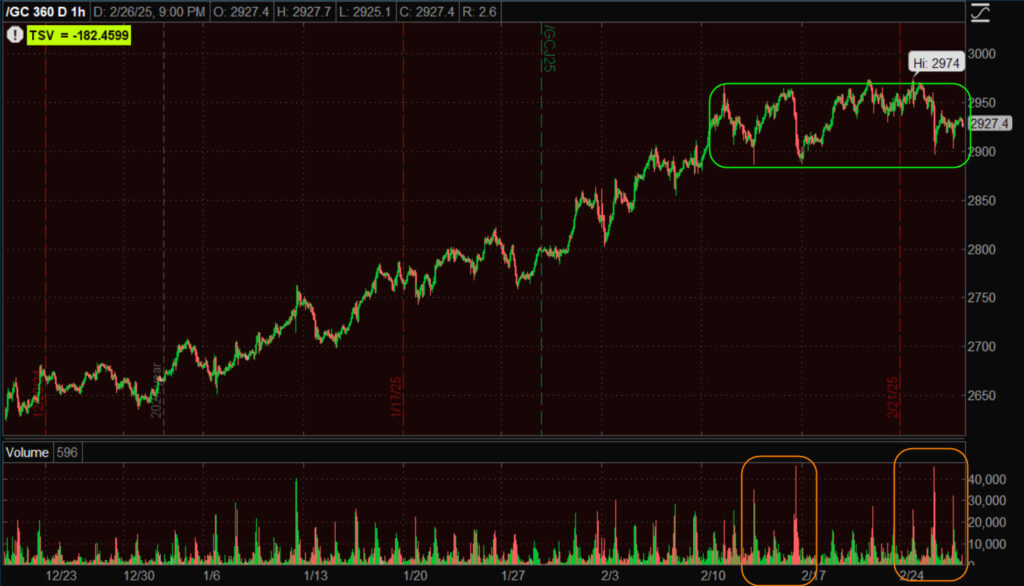 Gold (60m) – This price area can still easily morph into a new, cleaned up bullish consolidation. What I have not liked prior to yesterday’s selling is the volume. That can clean up from here too, but takes some more time and more work to really start to look better. Price is my top-weighted indicator, followed by volume, then indicators like 3C or other asset classes (rates, commodities, FX, credit, etc). That’s to say price is most important, but ideally price/volume work together in the best price set-ups and when that happens, most of the time the indicators are going to look good.
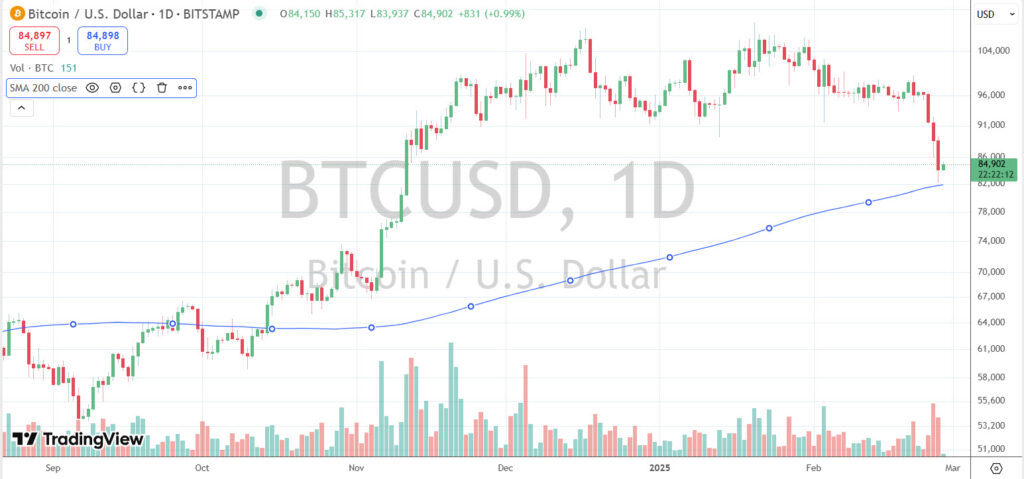
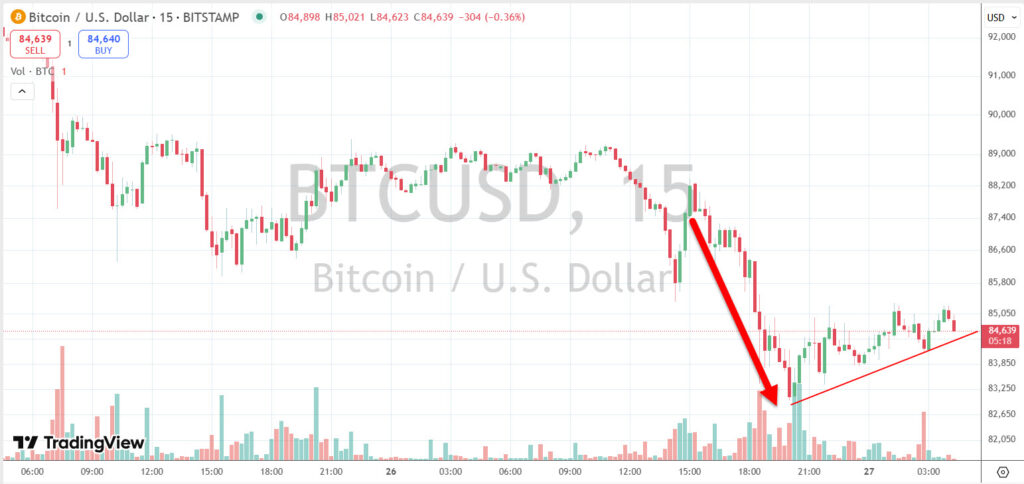
Bitcoin trades lower with an $84k handle.
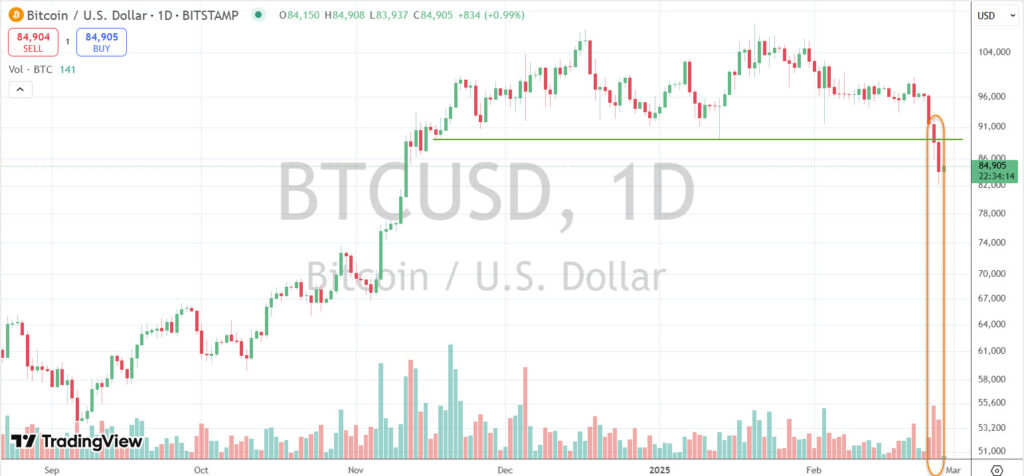 (daily) Volume increased yesterday as price broke the large sloppy range’s support low. Volume in this scenario is more art than science. An increase in volume on a down day that breaks support is not a good sign as stops are being hit, traders are exiting positions and opening the door to more selling. A huge volume spike may look ugly, but is often contrarian, signaling a sellers capitulation or selling exhaustion event and thereby a near-term low. Volume that rises on a sell-off, but doesn’t put in an unusually heavy spike is the sweet spot for more downside.
As range support broke, BTC made a new leg down.
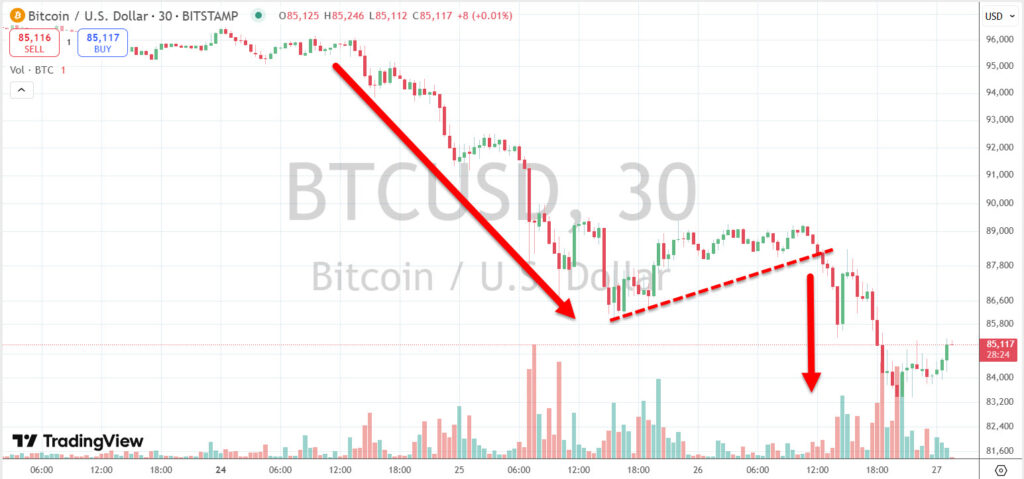 (30m)-Decline, bearish consolidation to wring out excesses and another decline on a pickup in sell side volume.
As a speculative asset, BTC does have some utility as a reflection of risk sentiment.
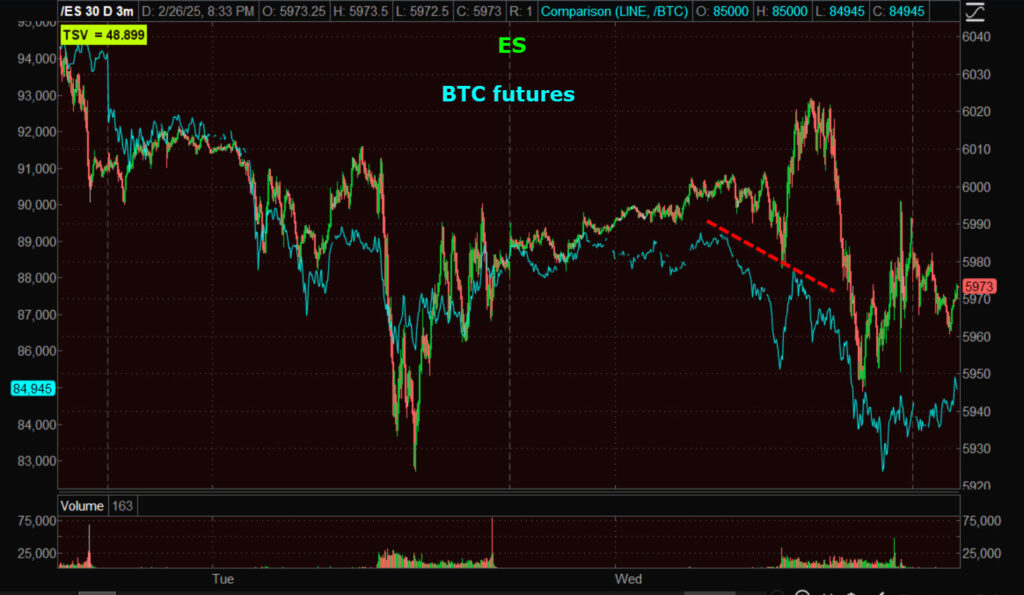 S&P futures (3m) and Bitcoin futures’ relative performance signaling risk sentiment and ES direction as price ran into technical resistance at its 50-day.
BTC/USD is nearing its 200-day SMA, which will obviously be an important test.
(daily) – A break of the 200-day suggests to me a much higher probability of the equity averages making a second major leg lower as outlined earlier today with updated measured moves (linked above).
Summary
The main takeaway from today is the day was 100% consistent with a consolidation. The consolidations thus far are early in the process with the first price pivots allowing trend lines to be objectively drawn in. Prior to today, price’s tone hinted at the probabilities of bear flag consolidations. 3C was the strongest signal at that point, fleshing out bearish flag consolidations…
An a few days later, 3C literally led price into similar, albeit still early, bearish flag-like consolidations…
SPX (10m) – With the even more important takeaway is that the size of the apparent flags forming makes the entirety of the preceding decline, “Leg 1.” That means that should the flags continue to develop, and break down, we have much bigger “Leg 2” measured moves and VIX almost certainly spikes above $20 and things could very well get much uglier than what the measured moves indicate once the fear emotion is engaged and running the show.
We are 8 weeks into the new year and there’s still no sign of leadership to be found. In late December I thought we’d have a good idea of where investors would be positioning for at least Q1 2025 leadership (maybe even H1 2025), but it simply has not materialized. Mega Caps have their problems post-earnings season, and with valuations and cap-ex spend on AI in light of post DeepSeek developments (in concept, not the DeepSeek itself).
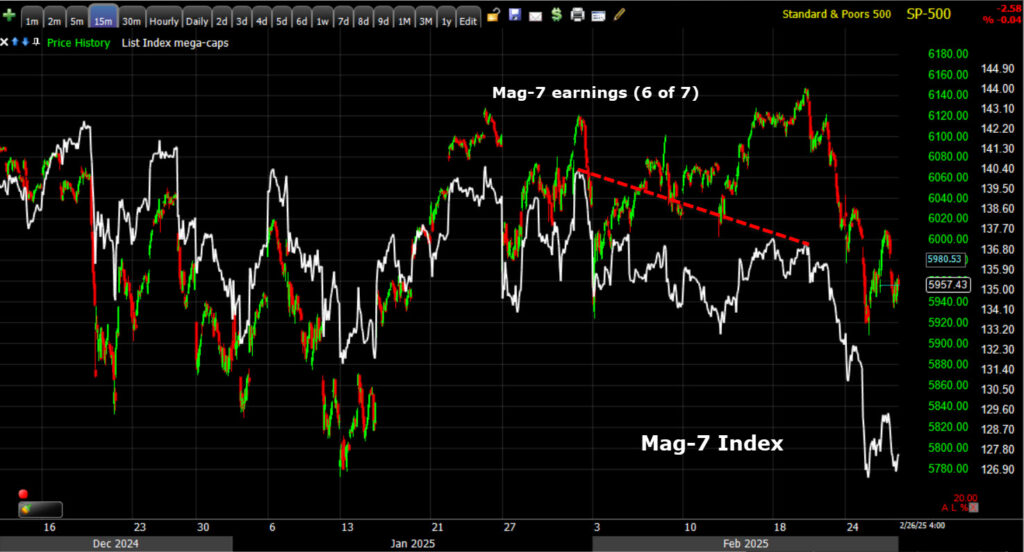 SPX (15m) and my Equal Weight Mag-7 mega cap list index. Notice the negative relative price performance divergence in mega caps AFTER they reported earnings.
Yo may have heard the phrase, “A Rising tide Lifts All Boats”, as an Ebb Tide lowers all boats. The majority of stocks are going to trend (in relative terms, not normalized price percent terms) with the benchmark index and that’s what the pro-economic growth cyclicals have done.
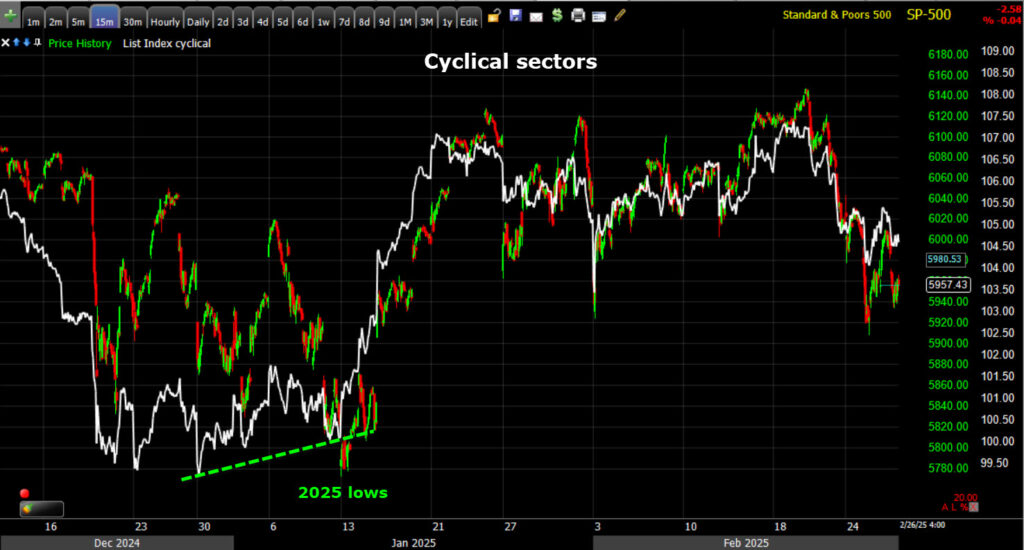 They did lead with a relative positive divergence off January 2025 market lows (green), but no sense of leadership whatsoever since then.
The only relative leadership is coming from the defensive sectors and part of that is because they are “counter-cyclical”, where you go when economic growth is faltering (everyone still has to shop for food, medications, pay electric and gas bills, health insurance, etc,).
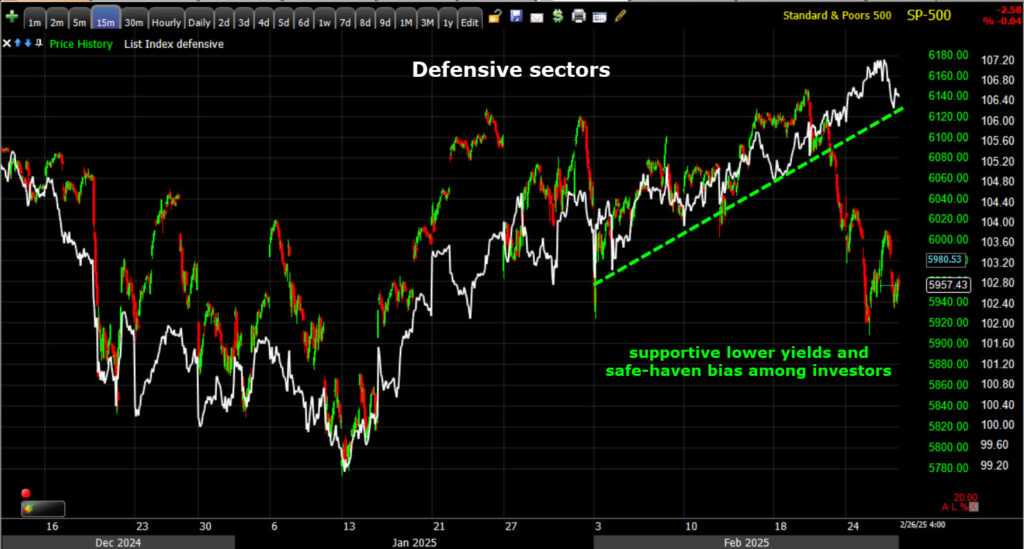 SPX and Defensive sectors (15m) – Another part is the growth scare has sent yields lower and because these are dividend heavy stocks, their dividends are “more” attractive relative to yields. notice I highlighted “More” attractive relative to yields, not necessarily attractive. And as you can see as the benchmark index has been coming down, part of their better relative performance is a flight to safety – a defensive mindset. If you manage a long-only fund and have to be long stocks, then you (or they) are going to buy the areas they think will do best in a growth slowdown. That may mean, the stocks they think will lose the least. The problem is, these stocks have no weight in the cap-weighted averages (with the exception of the health care sector) so they’re not going to lead a new bull market, especially coming from a “play defense” mindset. The averages led by these sectors/stocks certainly aren’t going to be able to withstand heavier selling in mega caps. These stocks just don’t have the weight. In fact, what usually happens is they outperform the first few weeks or month-plus early in a market decline, and then at some point the risk-off sentiment kicks in and everything is dumped. I’ve seen it again and again.
While my ABI signals were presented within the context of identifying an area of increased volatility with the aim of setting up trades, these signals “can” depict something bigger unfolding.
Some examples…
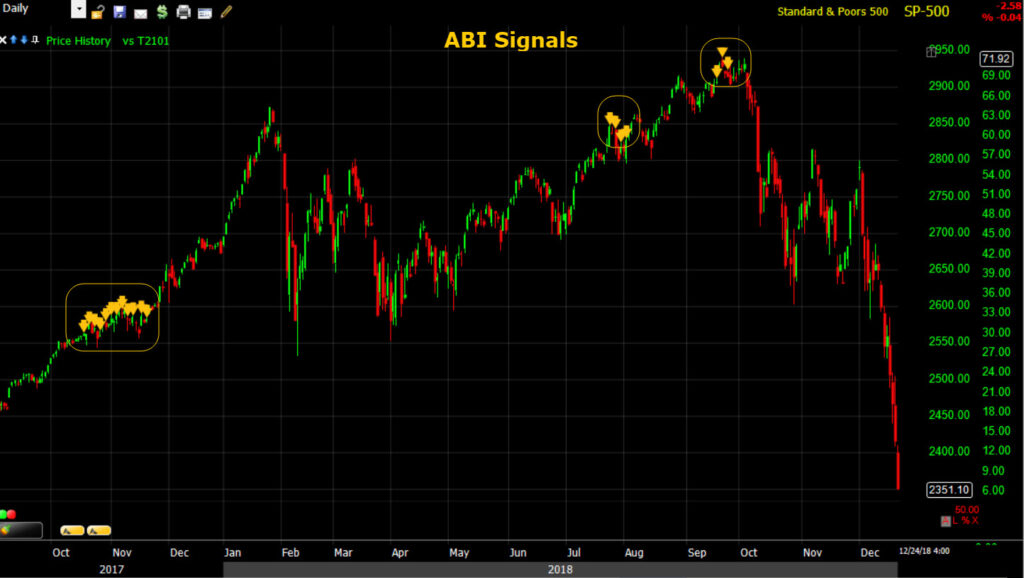 SPX (daily) 2017-2018 – Again, while I present these as shorter-term trading signals (over the next month or so), lets not forget what the creator of the indicator (not my signals or process) says about it,
” a low Absolute Breadth Index reading is more likely to signify the slow topping activity that frequently occurs at a market peak.”
Let’s look at the ABI signals in the context of which the indicator was originally designed to do – sniff out market bottoms and tops, not just trade volatility events a month or so out.
They signaled in late 2017 ahead of Armageddon in the volatility space in early 2018. They signaled something going on (as did my cross-asset analysis) ahead of the -20% crash later that year.
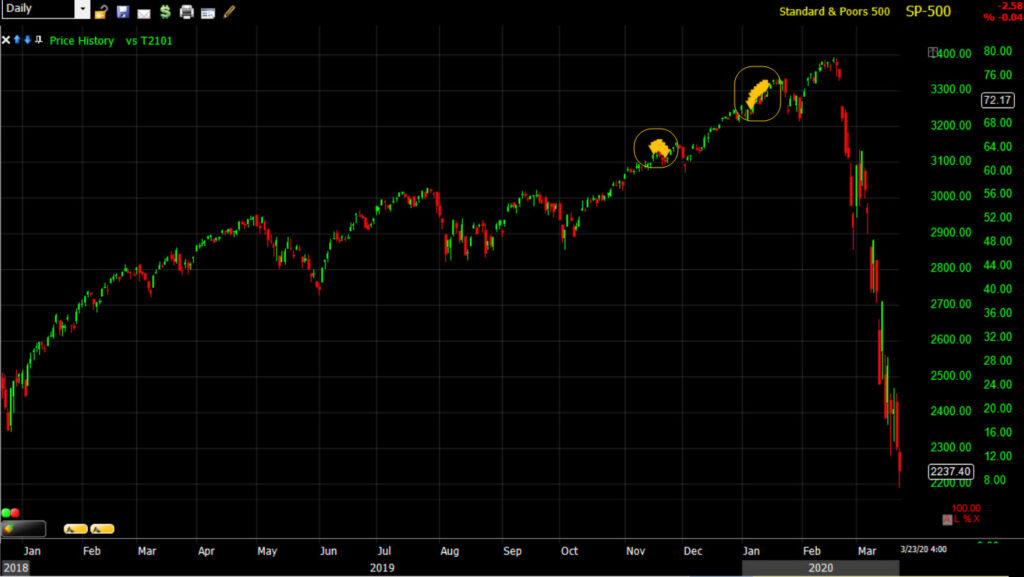 They signaled ahead of he SPX’s -35% Covid crash.
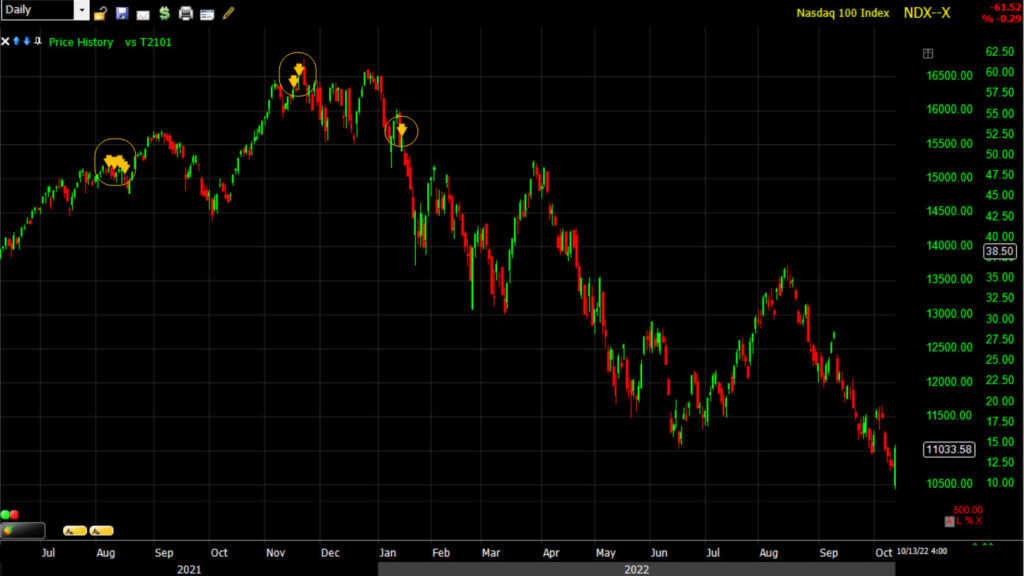 They signaled as the market started to top out in late 2021 heading into 2022’s bear market.
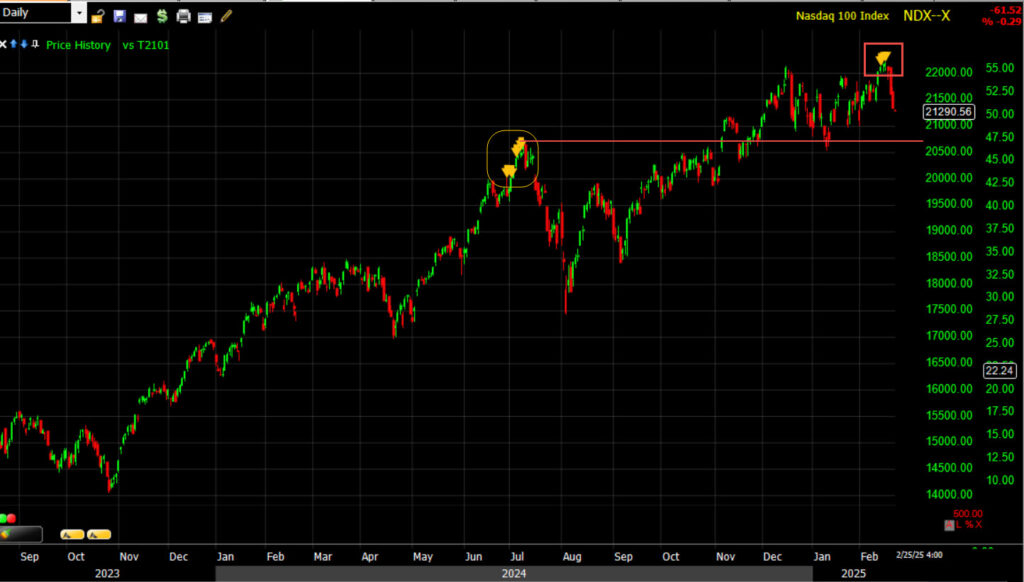 Most recently (current Nasdaq-100/daily) They signaled ahead of the last week’s correction. They signaled ahead of the NDX’s -15% crash last summer. The NDX is only about 2% above the highs of July when ABI fired off 8 or so signals. I’m not ready to present a case that this “may” be a bigger market top forming, but the advance notice this indicator gives within the context of the creators original intent, means that possibility can’t be ruled out.
The worst bear market and economic recession of my career (outside of COVID’s intensity over such a short period) was the Great Financial Crisis. That recession was a hair away from a Depression and had the government and the Fed not gone into policy, “No Man’s Land” with measures that hadn’t been taken ever before, or in some cases not since the actual Great Depression of the early 20th century, we could have seen a depression. I don’t think the Fe was even sure they could avoid a recession until it was all said and done.
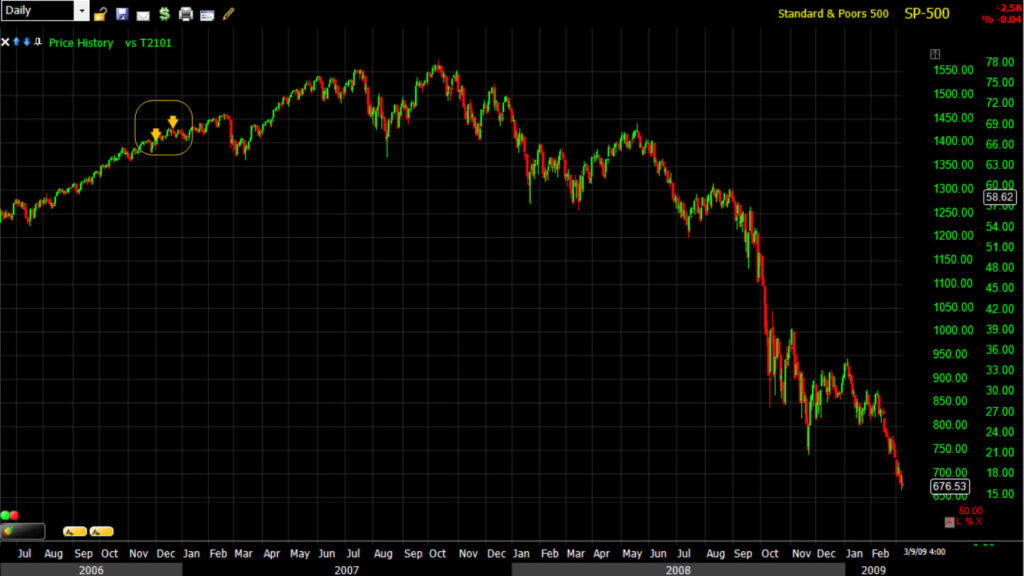 ABI was signaling back then, too, ahead of the 2007 SPX all-time high (and there’s always a new record high before a recession) and ahead of the Great Financial Crisis. It was saying that conditions were consistent with, “ the slow topping activity that frequently occurs at a market peak.”
When I look at this chart and the signal well in advance of the worst crisis of any of our lifetimes, the signals since last Summer can’t be ruled out as part of something bigger. However, that’s not the case I’m making at present. It’s just a reality that may come under closer scrutiny this year.
We have other signals. Again I’d encourage you to look at the breadth and corresponding 3C charts from the Feb. 20th, “Shots Fired” post linked above.
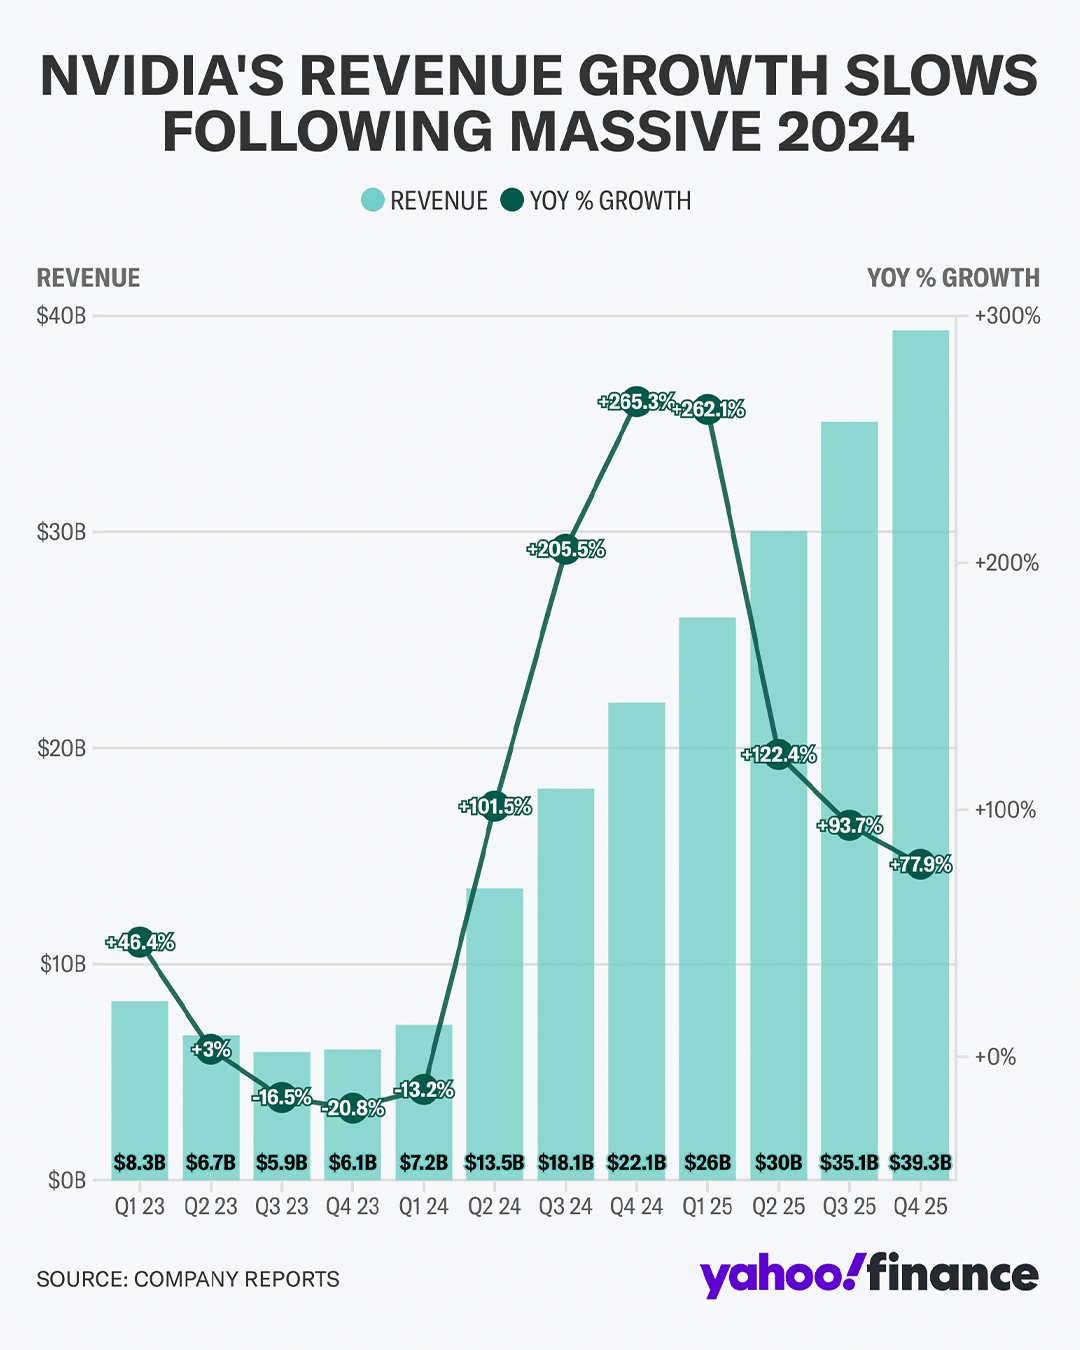
As far as Nvidia’s earnings after the bell – they were blowout earnings, yet the stock barely moved in afterhours relative to the headline beat. All earnings season I’ve been writing, the same thing. It’s not the beat, it’s the ROC of growth considering what’s already been priced in. Here’s an excerpt from the February 6th, 2024 Daily Wrap – Amazon Disappoints
“Amazon reported earning after the close. Amazon beat on the top and bottom line, but disappointed with Q1 2025 guidance. This is exactly what I’ve been saying to be on the lookout for months- the rate of change in beats and forward guidance.”
Here’s Nvidia’s Revenue Growth with the Year-Over-Year (YoY) ROC…
Envision the ROC as a bell curve. Is it accelerating or decelerating?
Nvidia’s reaction may not be what you’d expect for headline blowout earnings.
NVDA (2m today from the cash open w/ afterhours). I don’t like taking too much away from the less liquid after hours market, so we’ll see what we have tomorrow.
If things hold up along these lines, and assuming all other things equal, then we’re probably on track for what I wrote earlier on Wednesday with regard to fleshing out a bear flag,
“We’d need a couple more price pivot highs/lows to confirm a bear flag price consolidation such as 3C is currently reflecting and I’m not sure we have time to get those in place before today’s close and Nvidia earnings after the bell. If Nvidia earnings came in mediocre, not so bad as to cause renewed selling, but not so good as to sponsor a stronger rally, then we’d likely have the time to allow for such a price consolidation to develop, perhaps into the core-PCE data — the Fed’s preferred measure of inflation — on Friday.”
So far, it seems like we’re on track.
Overnight
S&P and Dow futures are flat tonight. Nasdaq 100 futures are down 0.15%, and small cap Russell 2000 futures are up 0.4%.
VIX futures (+1.1%) display modest relative strength.
U.S. dollar index is up 0.2%.
USDJPY is modestly supportive of S&P futures in the neutral range which would work out well with the low conviction trade expected in a flag consolidation.
WTI crude oil futures are up +0.2% to $68.75/bbl.
Gold futures are down 0.4% to $2918.50 – consolidative, above support.
Bitcoin trades at $84,700. We have a small bear flag heading into the overnight session so a test of the 200 day SMA looks highly probable.
BTC/USD (15m) -We’ll see what price looks like at that point and I can check some of the ETFs and BTC futures 3C chart.
Yields are modestly higher with the two year up 1.5 basis points and the 10 year yield up 2.5 basis points.
Economic data out tomorrow will include the second estimate for Q4 GDP, the weekly Initial and Continuing Jobless Claims report, January Durable Goods Orders, and January Pending Home Sales.
