It’s month-end and the market got a little more interesting today. I have a lot of information for you tonight.
Today was the big day the market has been waiting for — or feared — as the averages’ prices drifted modestly lower since Friday’s open. Unlike CPI and PPI, Core PCE came in at market consensus., although that consensus was lifted in reaction to CPI and PPI. Although the monthly figures rose, they were in line with expectations, which contradicts the hot CPI and PPI prints for January,
The Headline PCE Deflator rose 0.3% MoM as expected, and at +2.4% YoY in January. The Fed’s favorite inflation indicator – the Core PCE Deflator – dropped to +2.8% YoY in January as consensus expected.
On a side note, this is more evidence inflation is nearly twice as high as the GDP report’s ridiculous 1.6% deflator (inflation proxy in GDP calculation), which inflated GDP in what appears to me to be an obvious goal-seeking effort to make the economy look stronger than it is in an election year.
Digging deeper beyond the headline numbers, there was plenty of evidence of the inflationary bump that upends the market’s hopes for rate cuts sooner than later.
Services (light blue) are seining the inflation bump I’ve expected on a month-over-month basis.
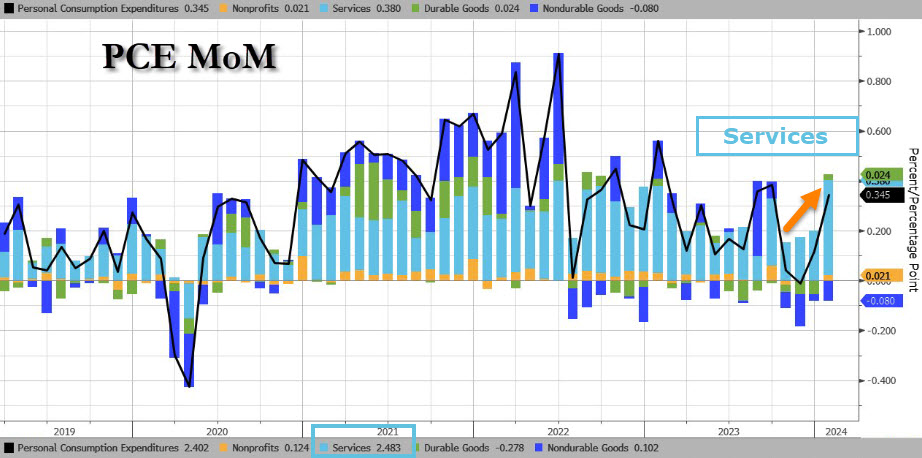
Source: Bloomberg
Reflecting this recent “bump” in inflation,
- Core PCE on a 3 month annualized basis moved up to 2.8% from 2.0%
- Core PCE on a 6 month annualized basis moved up 2.6% from 2.2%
On a Core basis (excluding Food and Energy prices) Services jumped even more.
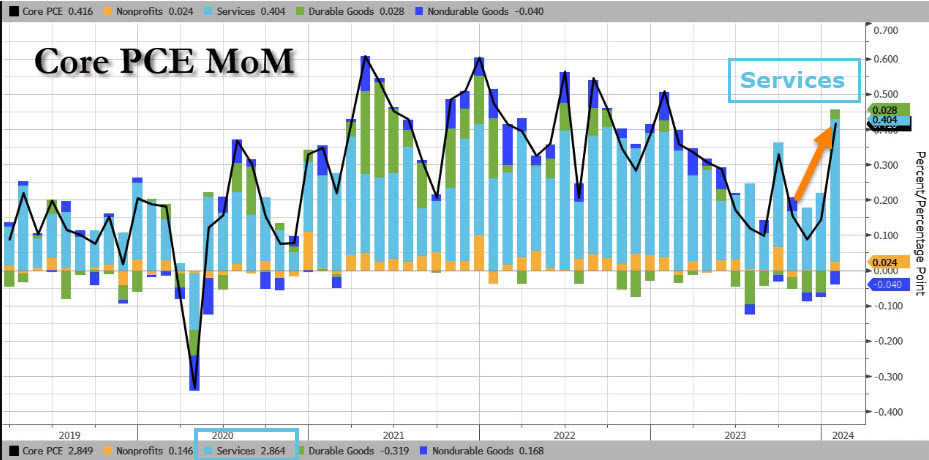
Source: Bloomberg
Also note that Durable Goods (green) went from deflation to inflation.
The Super Core index (removes the Housing index from the PCE Services excluding Energy index – or Core Services) saw every sub-group rise month over month.
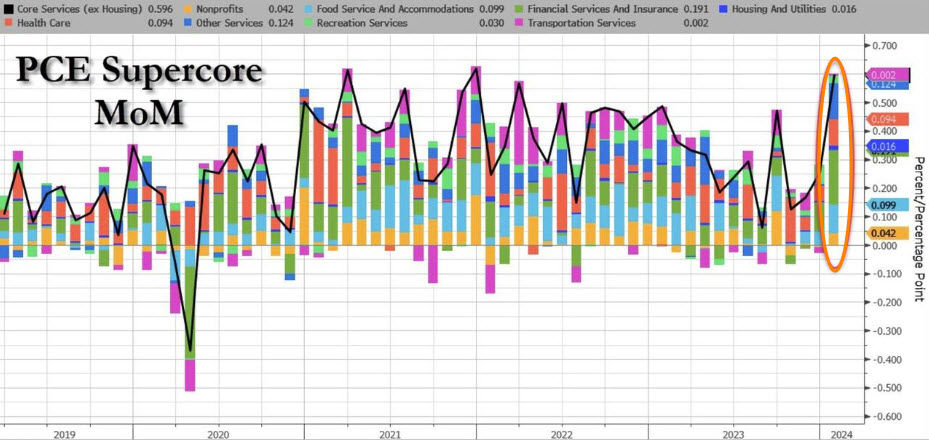
Source: Bloomberg
The month-over-month increases were enough to move the Super-Core higher on a year-over-year basis as well.
The bottom line is the report does little to change the Fed’s current, “higher for longer” path, which was reinforced by some Fed officials today:
- The Fed’s Goolsbee said: “The Fed should be careful extrapolating Jan. PCE data forward,” adding, “If the Fed stays quite restrictive, it will eventually have to think about the employment impact”
I suspect this comment was what turned the Dollar higher from PCE-related morning losses.
- The Fed’s Daly said the Fed is, ‘Ready’ to Cut When Data Demands It”
- The Fed’s Bostic was asked about the PCE data and replied, “Sometimes different measures point in different directions but it is useful to use a range of approaches to assess inflation”
- The Fed’s Mester said, ” The Fed does not want to move on just one data report” and that right now her baseline forecasts for “three cuts in 2024 still feels about right.” This is down from the 7 cuts the market priced in and rallied on in December.
To be clear, there still is no evidence of a 1970’s-early 1980’s resurgence in inflation, but a decent bump and sticky inflation is keeping the Fed on hold. Virtually nothing in the market or economics moves in a straight line. The Fed’s concern is whether or not this is just a bump in the trend.
The Fed cut rates too soon in the early 1980’s inflation due to political pressure as the economy was in recession. The economy went into recession in 1980, inflation re-surged, the Fed had to hike rates again, and another recession followed in 1981-1982.
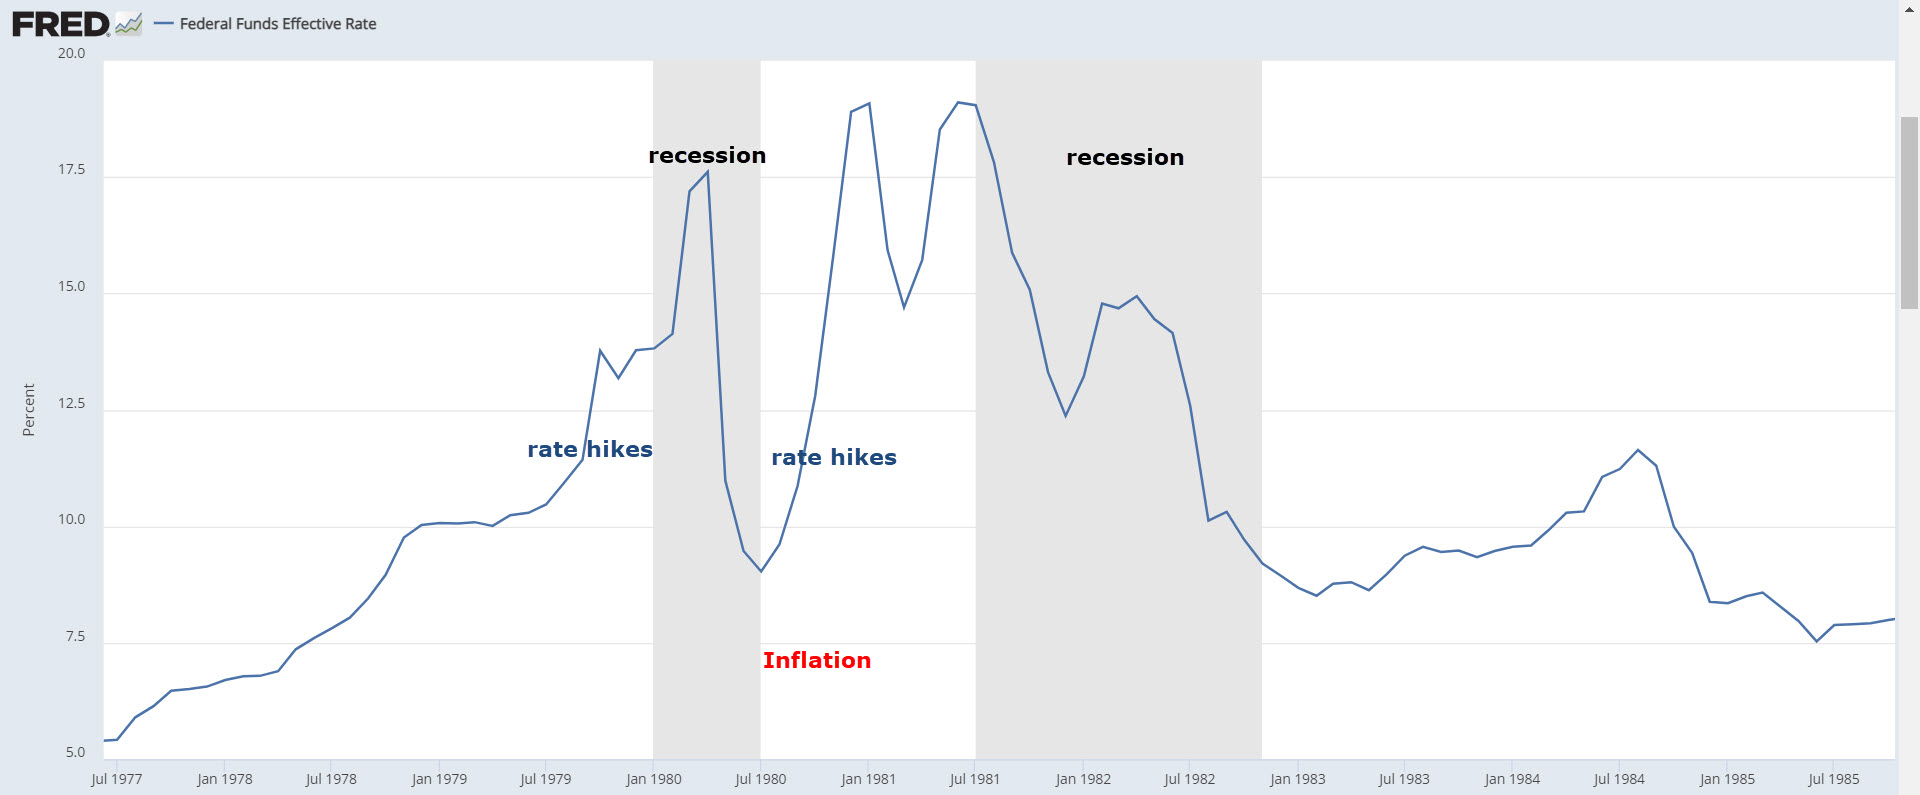 The Fed Fund Effective Rate (recession shading in gray) reached 20%. This is the “Volcker mistake” that Powell seems to be terrified of making; cutting rates too soon before inflation is definitively defeated. Yet, the longer the Fed Funds rate remains elevated, the more downward pressure it exerts on the economy as you can see by the two back-to-back recessions of the early 1980’s fight against inflation.
From comments Powell has made, that seems to be his nightmare scenario. This bump in inflation is what changed the Fed’s tone from December’s hints of a March rate cuts, to January’s “higher for longer” message.
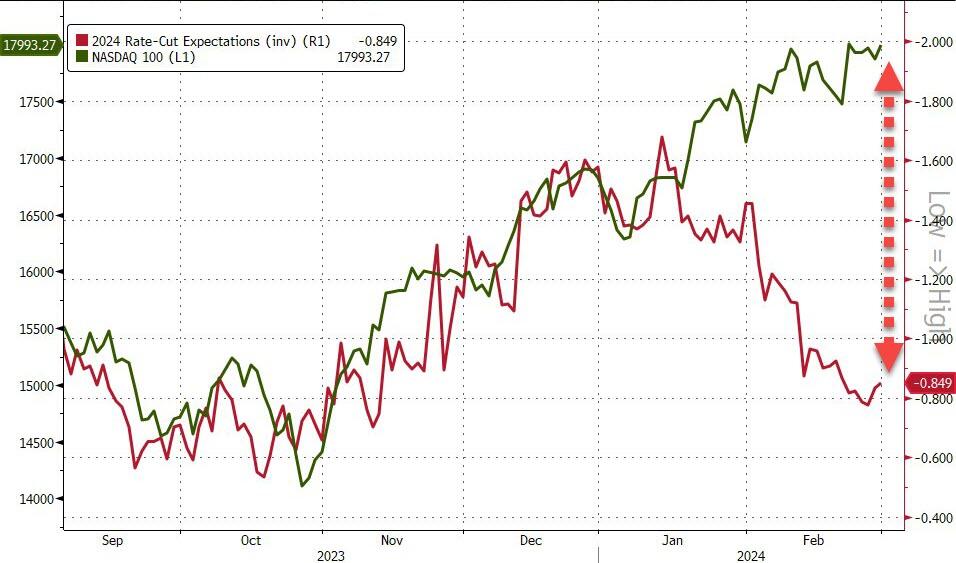
2024 rate cut expectations went from 154 basis points at the start of February (even higher in December), and as we end February the market is pricing in 84 basis points -nearly halved in a month. It was the expectation of the more and earlier rate cuts that first sent the S&P above $4600. The chart below shows the decoupling.
NASDAQ vs. Rate Cut Expectations
Today’s Economic Data:
- Weekly Initial Claims 215K came in higher than consensus (206K); while the prior week was revised slightly higher to 202K from 201K. Weekly Continuing Claims hit 1.905 mln. The prior week was revised to 1.860 mln from 1.826 mln. The four-week moving average of continuing claims is the highest since December 11, 2021.
The takeaway from the report is that it has become more challenging to find a new job right away, which is symptomatic of a labor market that is not running as tight as it once was.
- Chicago PMI was soft, dropping to 44.0 in February (consensus 47.6) from 46.0 in January. Readings below 50 indicate contraction. The print took the headline to its lowest level since last July Just about every metric in the report was weak; new orders, employment, inventories, supplier deliveries, production and back-orders all contracted, but prices paid increased.
- Pending home sales were ugly, and not surprising as we have been seeing recently in a number of weak data points. Pending home sales dropped -4.9% in January (consensus 1.0%) following a big downside revised 5.7% increase in December from 8.3%. This was the biggest MoM decline since August and dragged the YoY sales decline to -6.82%, near all-time record lows. Earlier this week US mortgage applications for home purchases fell, nearing its lowest level since 1995.
On the day… I was surprised there wasn’t more of a relief rally after the in-line headline PCE considering the market’s recent “Wait and see” attitude over the last 4 days. Trade most of the day was muted after this morning’s release of the Personal Income and Spending Report for January (PCE).
There was an initial short squeeze, but it didn’t last long. The indices were trading with modest gains most of the session and the DJIA went red on the day prior to the close. In the final hour of trade, Mega-caps’ weight propelled the market higher in to the close of the trading day, and month end. However, mega-caps aren’t displaying the leadership we’ve seen from the group for most of 2024 (excluding the first week of January).
Averages
The S&P 500 briefly traded above 5,100 before closing shy of that level. NASDAQ-100 ended the day best due to Tech sector, mega-caps and semiconductors. Small Caps traded up as much as +1.8% in early trade as short-covering in the most shorted index surged at the open, then fell off to a gain of +0.65%. Small Caps came off their best levels shortly after 10 a.m. ET and did little the rest of the day – having no exposure to mega-caps’ gains in the final hour of trade.
S&P-500 ⇧ 0.54 %
NASDAQ ⇧ 0.95 %
DOW JONES ⇧ 0.14 %
RUSSELL 2000 ⇧ 0.65 %
As covered this afternoon, each of the averages has their own near-term challenge. The S&P, NASDAQ-100 and Dow Industrials’ challenge are similar… to breakout above the week’s bullishly biased consolidation.
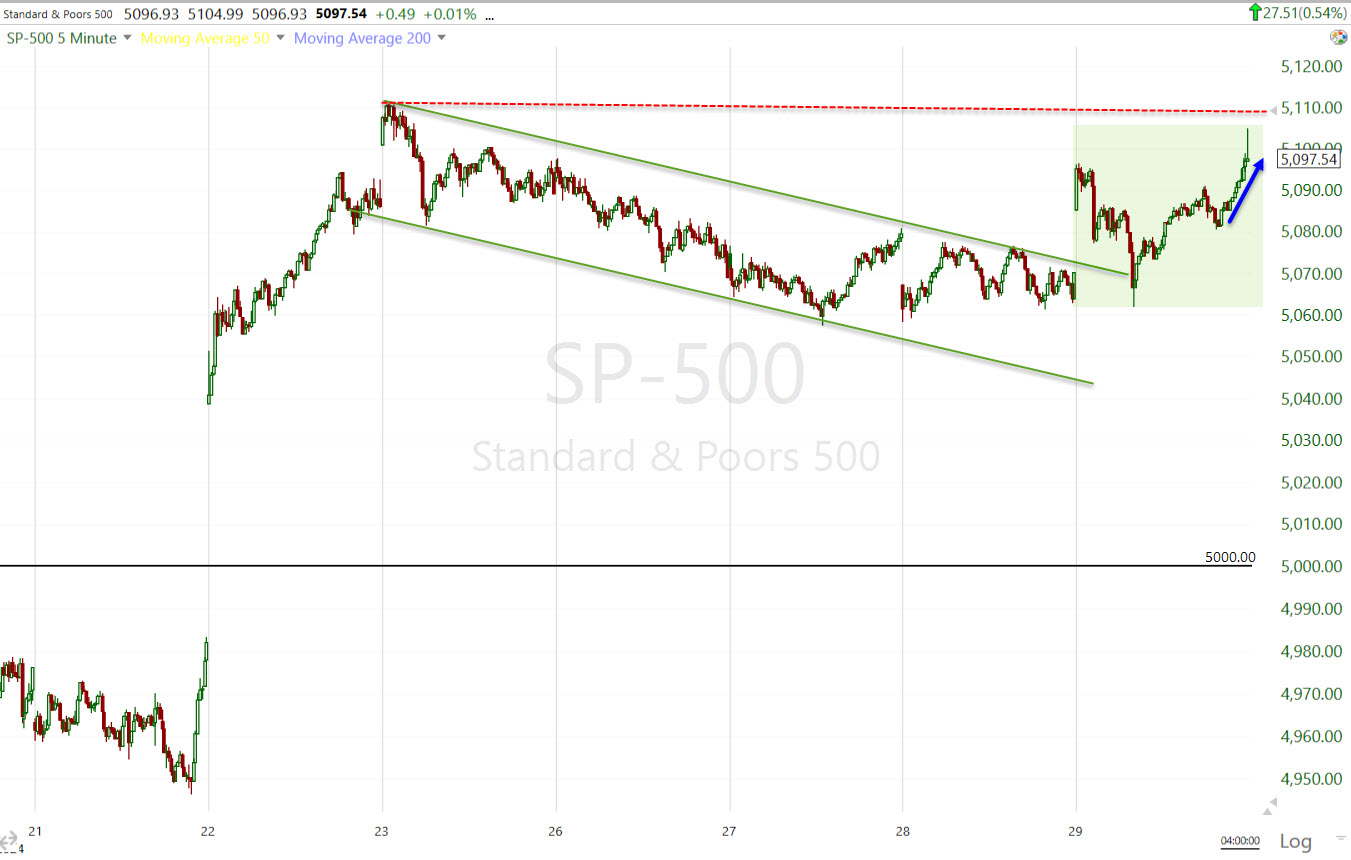 SP-500 (5m) while price action has been dull this week, it still retained a bullish bias. It’s not a textbook bull flag, but close enough. I was surprised we didn’t see a stronger relief rally reaction to the in-line headline PCE. Few bother to look under the hood.
The initial breakout is always the most tense for me. If it’s not a clear, definitive breakout making a higher high vs. where the consolidation began (5100 area), there’s a risk of a failed breakout and a failed breakout is rarely good news for what’s to come. There’s nothing wrong with this chart, I’m just surprised we didn’t see a stronger bid.
NASDAQ-100’s price chart is a virtual carbon copy of S&P’s with the same near-term challenge. The only difference is the local resistance from the CPI data.
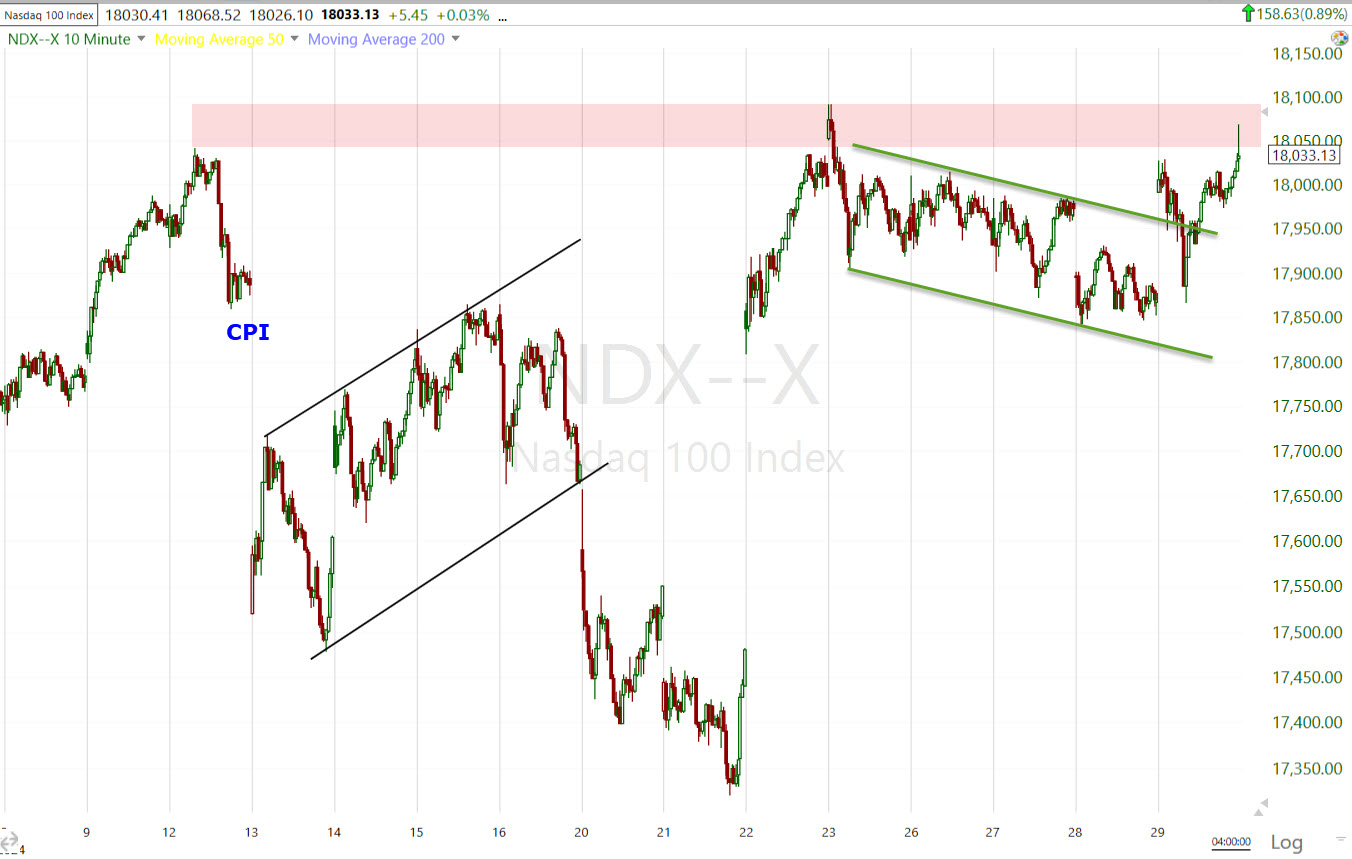 NASDAQ-100 (15m) This is what I’m talking about (red). The S&P doesn’t have this local resistance, which surprises me as Tech has led and this is the tech heavy index.
Since the CPI report, I’ve been writing nearly every day, “Expect a lot more price volatility, both up and down, and a more lateral turn” and to expect it to be a choppy ride.”
The NDX is a perfect example of this volatility, both up and down and the choppy ride. In two weeks we have both a bear and bull flag. I may be wrong, but I don’t recall any bear flags on the NDX’s price chart since the November rally began. It’s a change in character and changes in character almost always precede a change in price trend. Even the 1987 Black Monday crash didn’t just materialize out of nowhere. There were plenty of changes in character in price before that crash if you look.
The Dow is in a similar situation, but it didn’t benefit from the mega-caps gains this afternoon due to its price weighting as opposed to the S&P’s market-cap weight and the NASDAQ’s modified market cap weight.
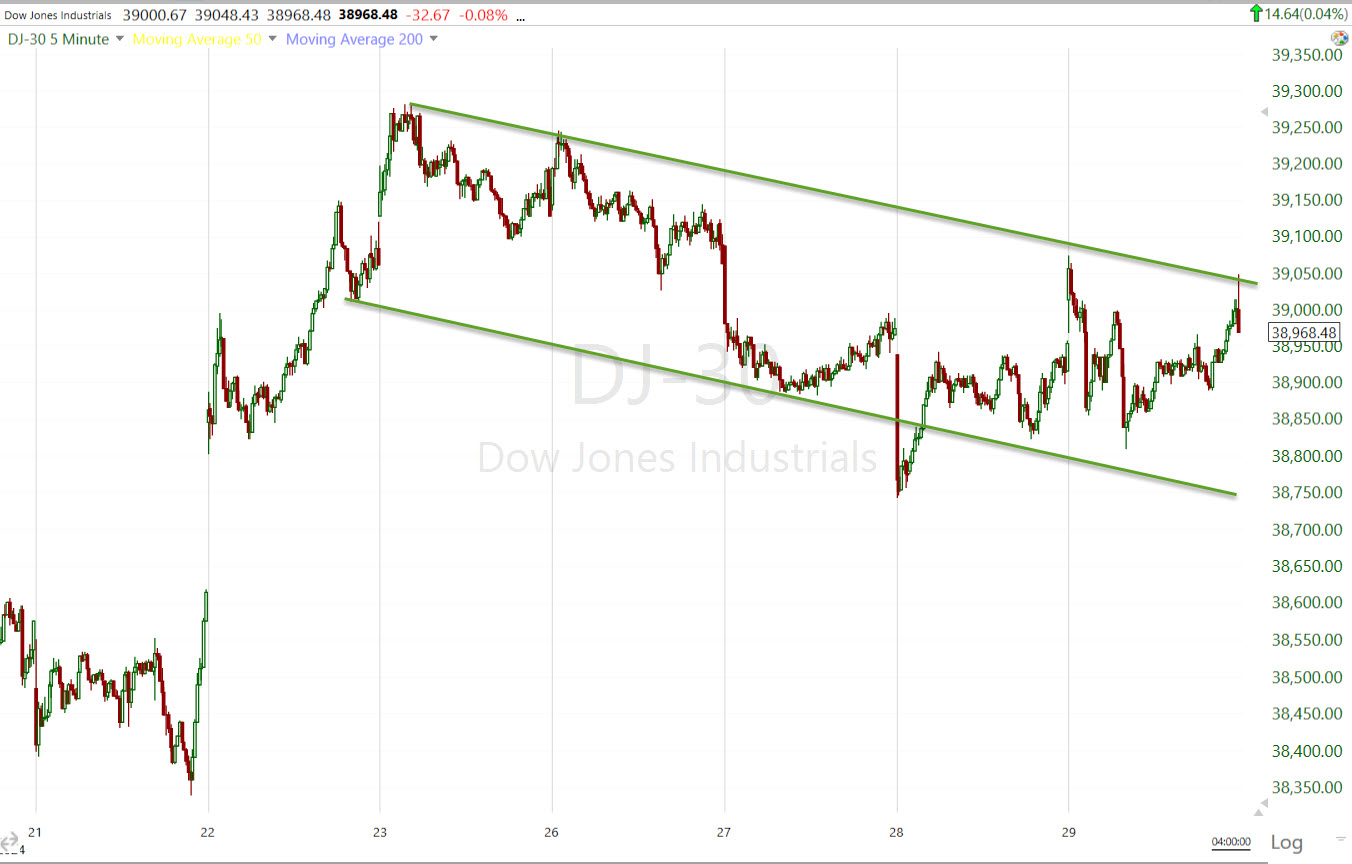 DJIA (5m) as a result, the Dow didn’t breakout of the week long bullish consolidation today.
Small Caps are in a different boat entirely with no exposure to mega-caps, but they’ve been riding a wave of short covering in the Most Shorted Index.
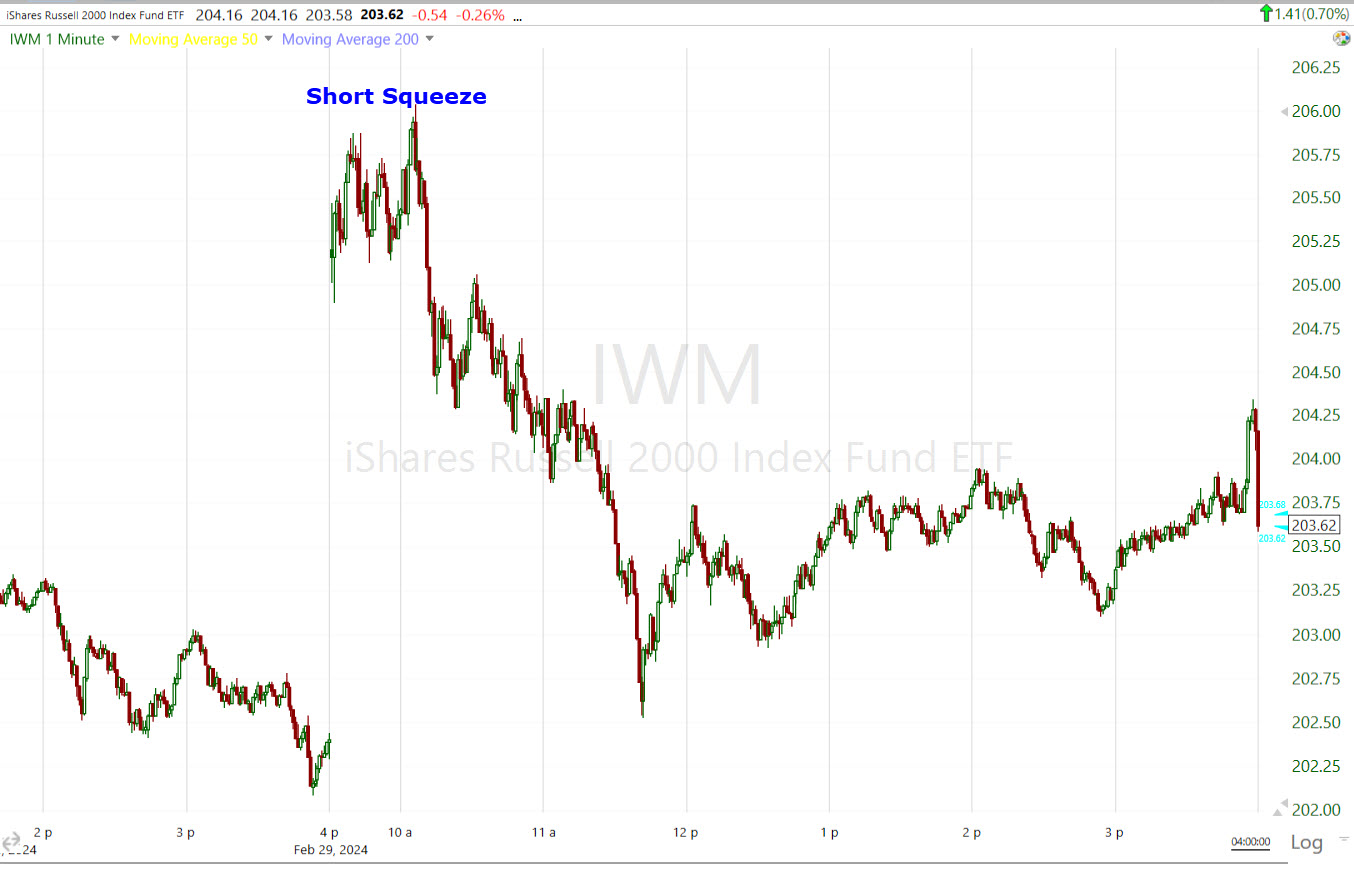 IWM (1m Today) You can see the big gap up and a +1.8% early gain. Small Caps were up 2x to 6x more than any other average at the open, but faded after the short squeeze lost momentum, and of course got no benefit of mega-caps run into the close. That leaves the index at a dangerous spot where price has failed 2x already this month – the roughly 2-year lateral range.
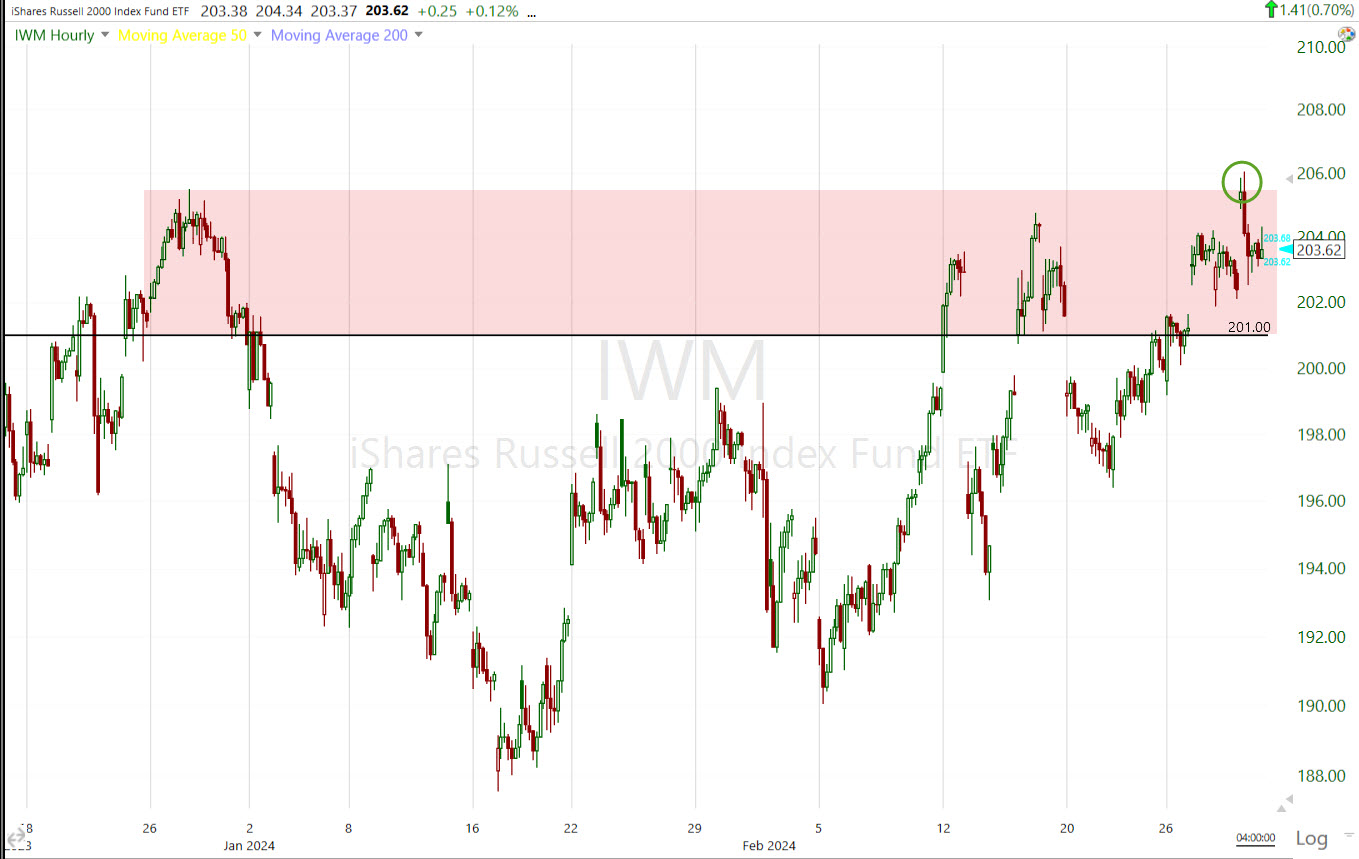 IWM (60m) the trend line is the top of that 2 year range. Interestingly IWM opened (green circle) just above where price has failed twice, then sank lower to close back in the red zone. There appears to be a little more room for short covering, but not much, and all of Small Caps gains this week have been due to short covering.
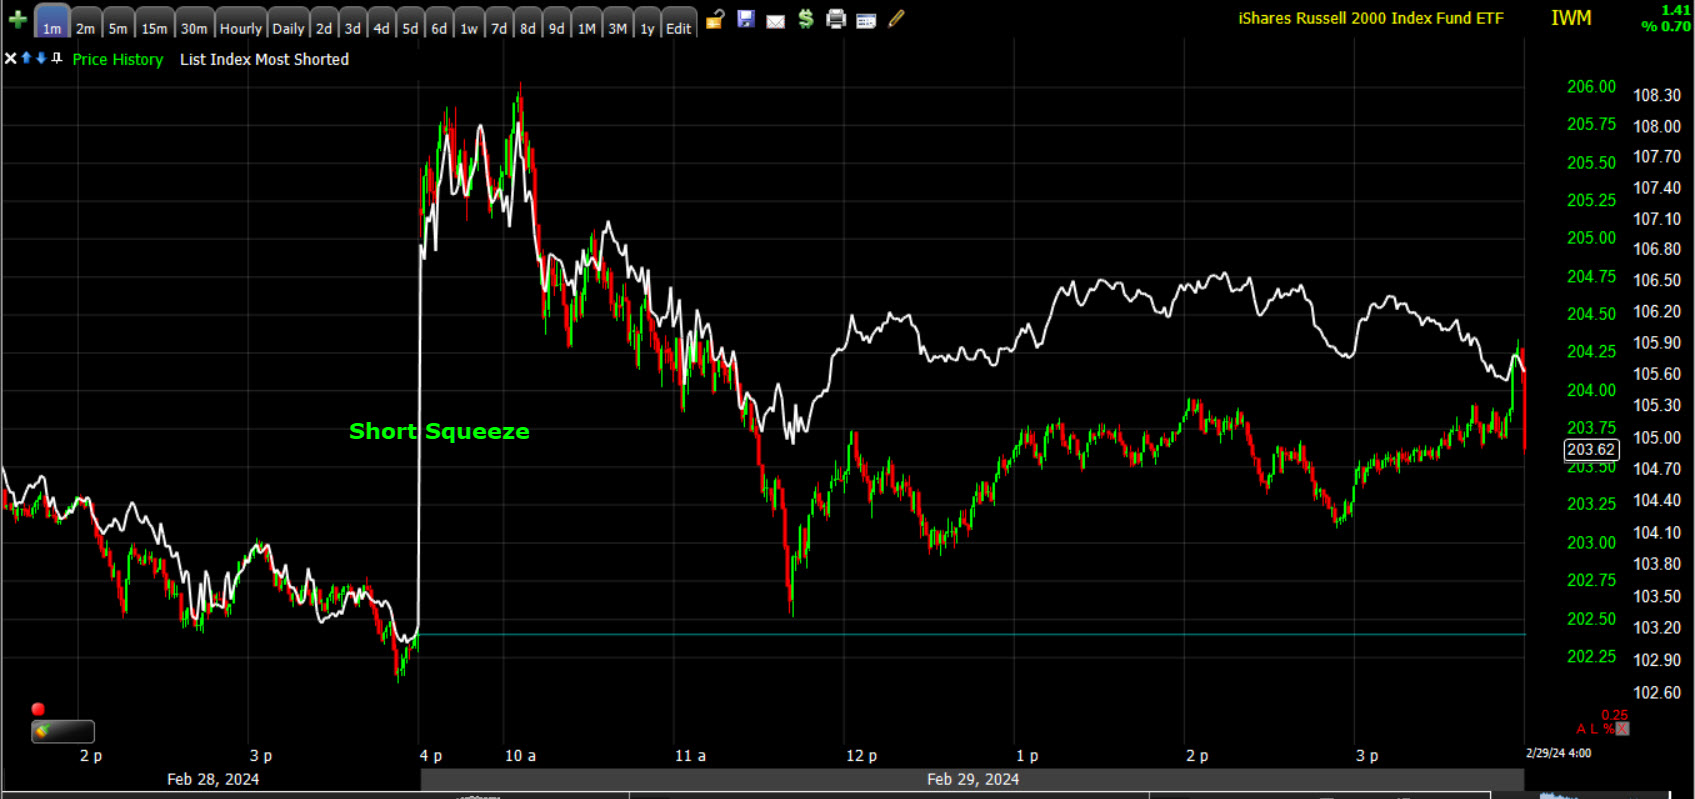 IWM (1m Today) and my Most Shorted Index. It’s pretty clear what small caps’ primary driver has been recently… short covering, or the lack of it. We got a big burst of short covering at the open, then not much else and Small Caps drifted lower.
Bigger picture…
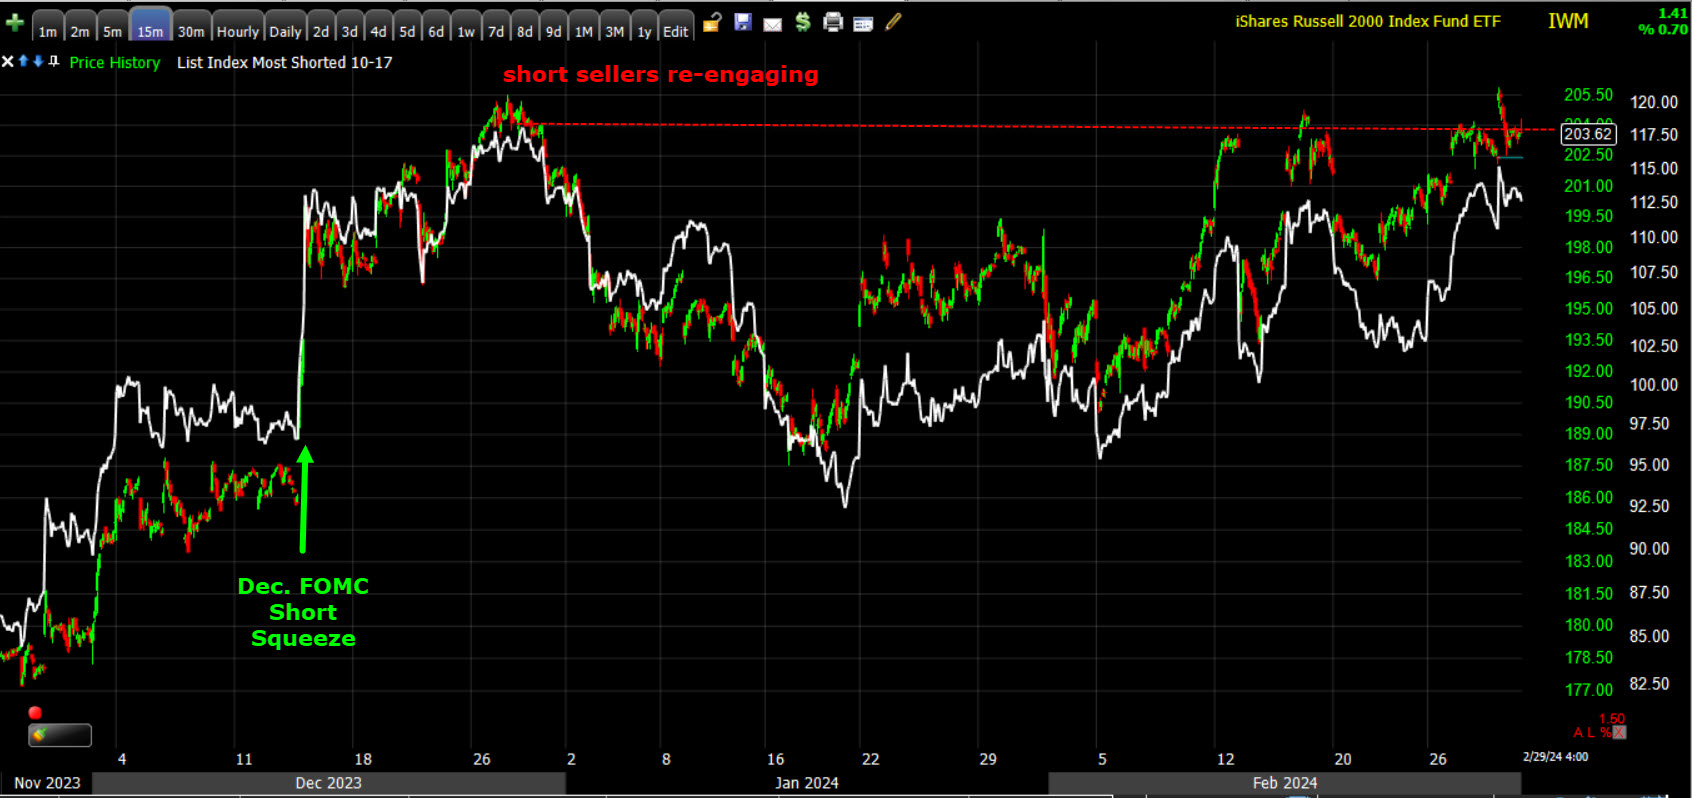 IWM and MSI (15m) – It almost amazes me to see how closely Small Caps mirror the Most Shorted Index, but for our purposes, the short sellers of late December have nearly been run out of all of their positions. After that, there’s not much gas in the tank to drive small caps higher, unless there’s a serious rotation from Tech to Cyclical sectors/stocks, Defensive sectors/stocks and Value style factors. I have expressed doubts that this happens, and if it does, it hurts the NASDAQ, and if the NASDAQ goes down, I think mass psychology shifts and most everything else goes down with it. I don’t see a high probability path for Small Caps to trade higher. Possible? Yes. Probable? No.
And tonight we have more trouble with Regional Banks that Russell 2000 has a lot of exposure to.
VIX ended the day -3.2% lower. VIX was a tad on the weak side today, but nothing that stood out as unusual for the day. The ongoing trend of relative strength and positive correlation is the more important story for volatility. After dipping (but still staying positive) the SPX/VIX 30-day positive correlation is bac on the rise.
The Absolute Breadth Index ended the day lower, in the low 17’s.
The Fear and Greed Index ticked up further into Extreme Greed today (79 from 78 yesterday). The F&G Index is acting similarly to the H&S tops of the summer (SPX $4600 to $4100) with a long, drawn out period of FOMO.
S&P-500 and Fear and Greed Index
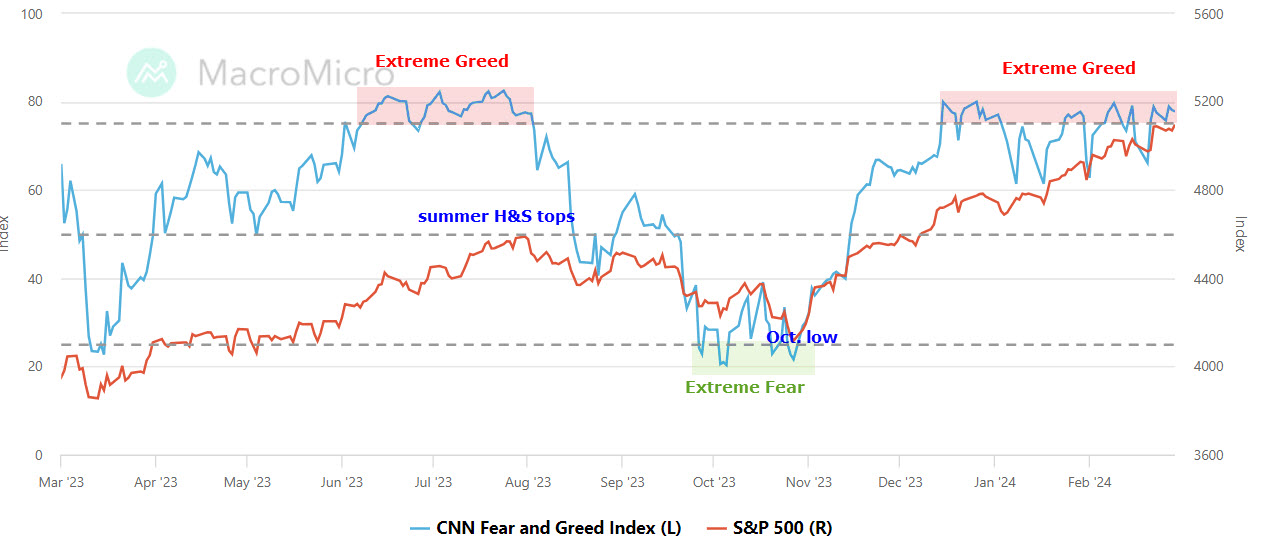
source: CNN Money/MacroMicro
On a somewhat related valuation note, according to Bank of America’s weekly Relative Value Cheat Sheet, the S&P 500 is expensive on 20 of the 20 metrics the bank uses to check on relative valuation, and is trading in the 95th percentile (based on trailing P/E’s) since 1900.
The bank’s chief equity strategist, Savita Subramanian, notes in her latest report that “the S&P 500 is egregiously expensive vs. history.” According to Subramanian, statistical valuation models matter in the long-term and suggest far lower returns over the next decade, with just a 3% annualized return in the base case.
Jim Chanos (noted bear) made some interesting observations on “X” today; noting that in late 1994 the Fed funds rate of 5.5% was similar to today, and the inflation rate in 1995 was 2.8%, also similar to today, but in 1995 the top ten US stocks represented 6% of US GDP. Today the top ten are 50% of US GDP.
Chanos also added, “In late-1994 the US stock market had a $5.0T capitalization, relative to a $7.6T GDP, or 66%. Today? A $53.0T capitalization on GDP of $27.4T, or 193%! Almost 3x.”
S&P sectors
The afternoon bid left 8 of 11 S&P 500 sectors higher. Mega cap leadership left the heavily-weighted Technology, Communications, and Consumer Discretionary sectors near the top of the leaderboard. Salesforce (CRM +3.0%) outperformed after reporting earnings, which boosted the Tech sector, as did semiconductors.
The mega-cap index (MGK +0.65%) traded pretty much in sync with the S&P Equal Weight Index (+0.5%), but were still the primary support in the last hour of trade. On the day, however, we can see that the group is not displaying the kind of outperformance/leadership it has displayed most of 2024 with just 15 basis points of outperformance.
The last hour’s gains were largely driven by Amazon.com (AMZN +2.1%), Microsoft (MSFT +1.5%), and Meta Platforms (META +1.3%). Other mega-caps in the Mag-7 group, such as Apple (-0.4%), Tesla (TSLA -0.1%) and Nvidia (NVDA +1.95%) didn’t participate much in the last hour of mega-cap led gains into the close
The diverging path of mega-caps is apparent in the month of February. The group of Magnificent 7 stocks gained +7% with a big move at the start of the month, but have done virtually nothing since then. Nvidia gained +28.75% for the month, Meta gained +25.4%, Tesla gained+7.7% (but in an apparent large bear flag), Microsoft gained +4% as it seems to be slowly decoupling with the group. Meanwhile, the only two $3 trillion stocks ended the month lower – Alphabet lost -1.5% and Apple lost -2% in February.
Semiconductors (SOX +2.7%) were a bright spot of relative performance today and as you know, have been among the market’s primary leadership for 2024. Still, that leadership in Tech and mega-caps continues to narrow.
At the bottom of the leaderboard were Financials, despite a +1.4% gain for Regional Banks – more on that below. The heavily weighted Healthcare sector was the worst performing sector. Rather than rallying into the close, Healthcare sold off into the close.
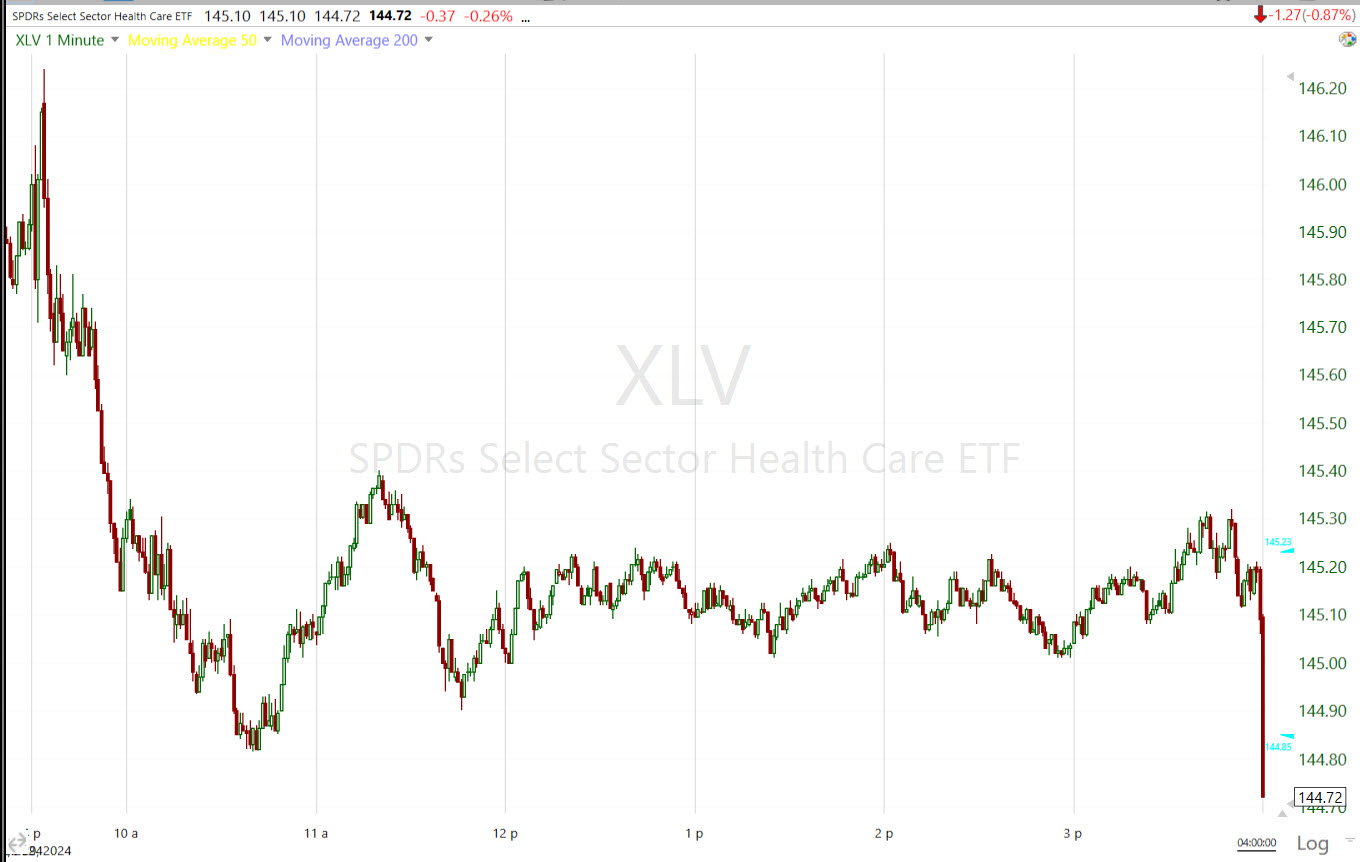 Healthcare sector (1m Today)
Materials ⇧ 0.76 %
Energy ⇧ 0.49 %
Financials ⇩ -0.05 %
Industrial ⇧ 0.31 %
Technology ⇧ 1.11 %
Consumer Staples ⇩ -0.16 %
Utilities ⇧ 0.03 %
Health Care ⇩ -0.82 %
Consumer Discretionary ⇧ 0.68 %
Real Estate ⇧ 0.80 %
Communications ⇧ 0.89 %
Regional Banks (+1.4%) were a part of today’s short squeeze, but all is not well. Remember NYCB? Just 6 days ago I wrote,
“It wasn’t long ago New York Community Bank (now Flagstar – NYCB) sent up a distress flair as it crashed to 27 year lows on heavy volume…Price action since hasn’t improved one bit since then”
Tonight NYCB is down over -17% after disclosing that it identified “material weaknesses in its internal controls related to internal loan review as part of an assessment”, and the bank will delayed annual filings as a result.
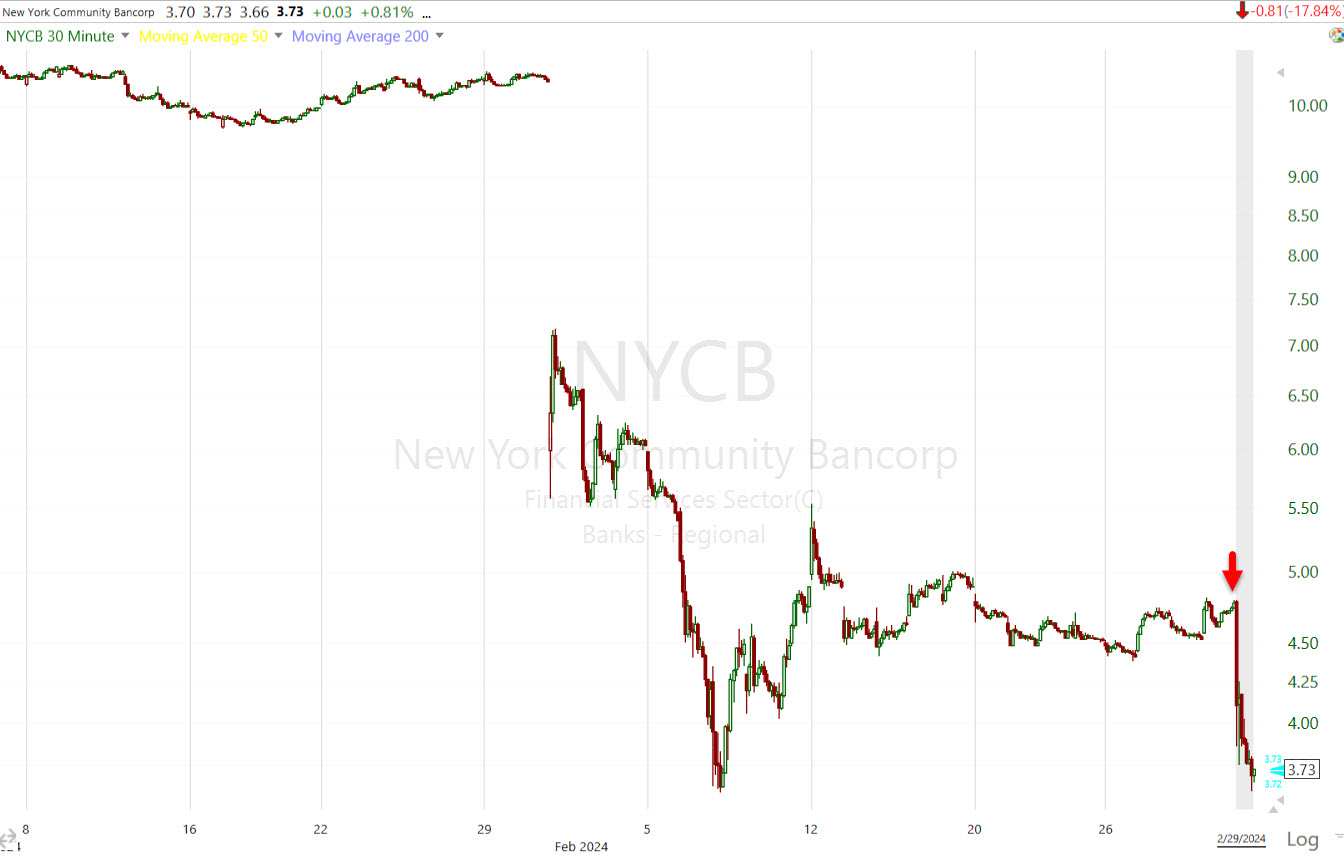 NYCB (30m w/ afterhours). This is going to be trouble for Small Caps that have a lot of exposure to the Regional Banks.
Internals
NYSE Advancers (1893) had a solid 2-to-1 edge over Decliners (831) on heavy month-end volume of 1.7 bln shares.
There is no Dominant price/volume relationship for 1-day overbought purposes, and today’s heavy month-end volume skews the relationship, especially after yesterday’s uncharacteristically light volume. S&P and NDX both came is at Close Up/Volume Up, the most bullish relationship, but you have to account for the normal last day of the month heavy volume.
What surprised me given the heavy overall heavy Volume was the Dow had a dominant theme of Close Down/Volume Up. This is the kind of relationship seen during sell-offs.
There’s no 1-day overbought/oversold internals signal.
Breadth oscillators are back to the low end of of the overbought range at 83.
There wasn’t as much participation in the final hour of trade as the mega-caps (and only a handful of them) lifted the market.
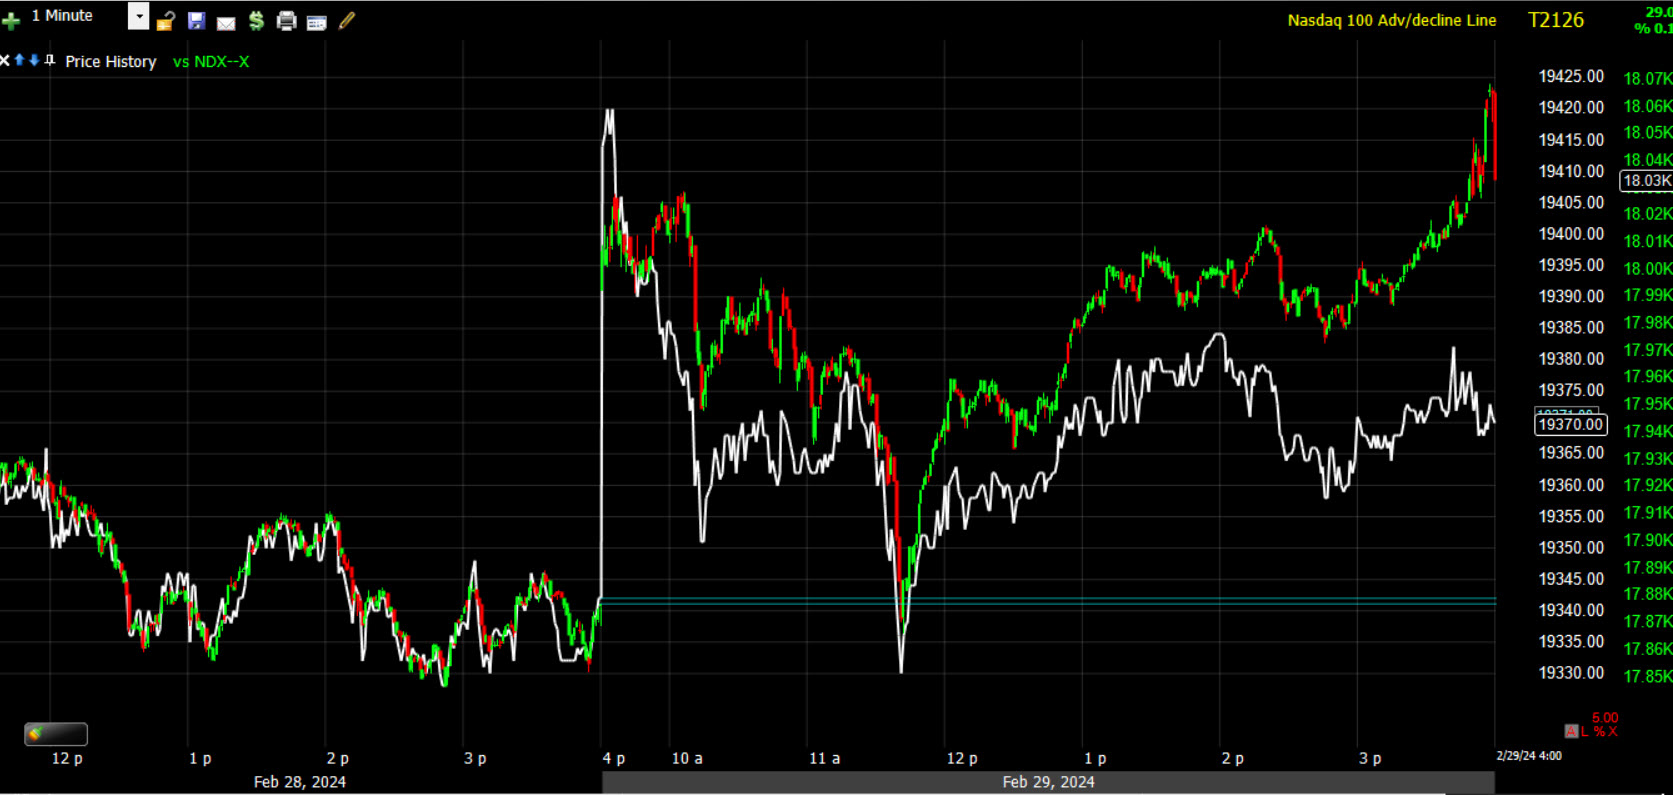 NASDAQ-100 (1m today) and it’s Advance/Decline line shows the narrow participation in the final hour of trade, well below the opening levels. Only 59% of NDX stocks closed green today.
I see the same thing in the broader NASDAQ Composite and NYSE Advance/Decline lines today. Only 14 of the 30 Dow stocks closed green, and 300 of the S&P’s 500 stocks closed green.
The same other breadth issues I’ve highlighted this month remain intact. Just barely half of stocks are above their 40-day and 200-day moving averages (53% and 57% respectively).
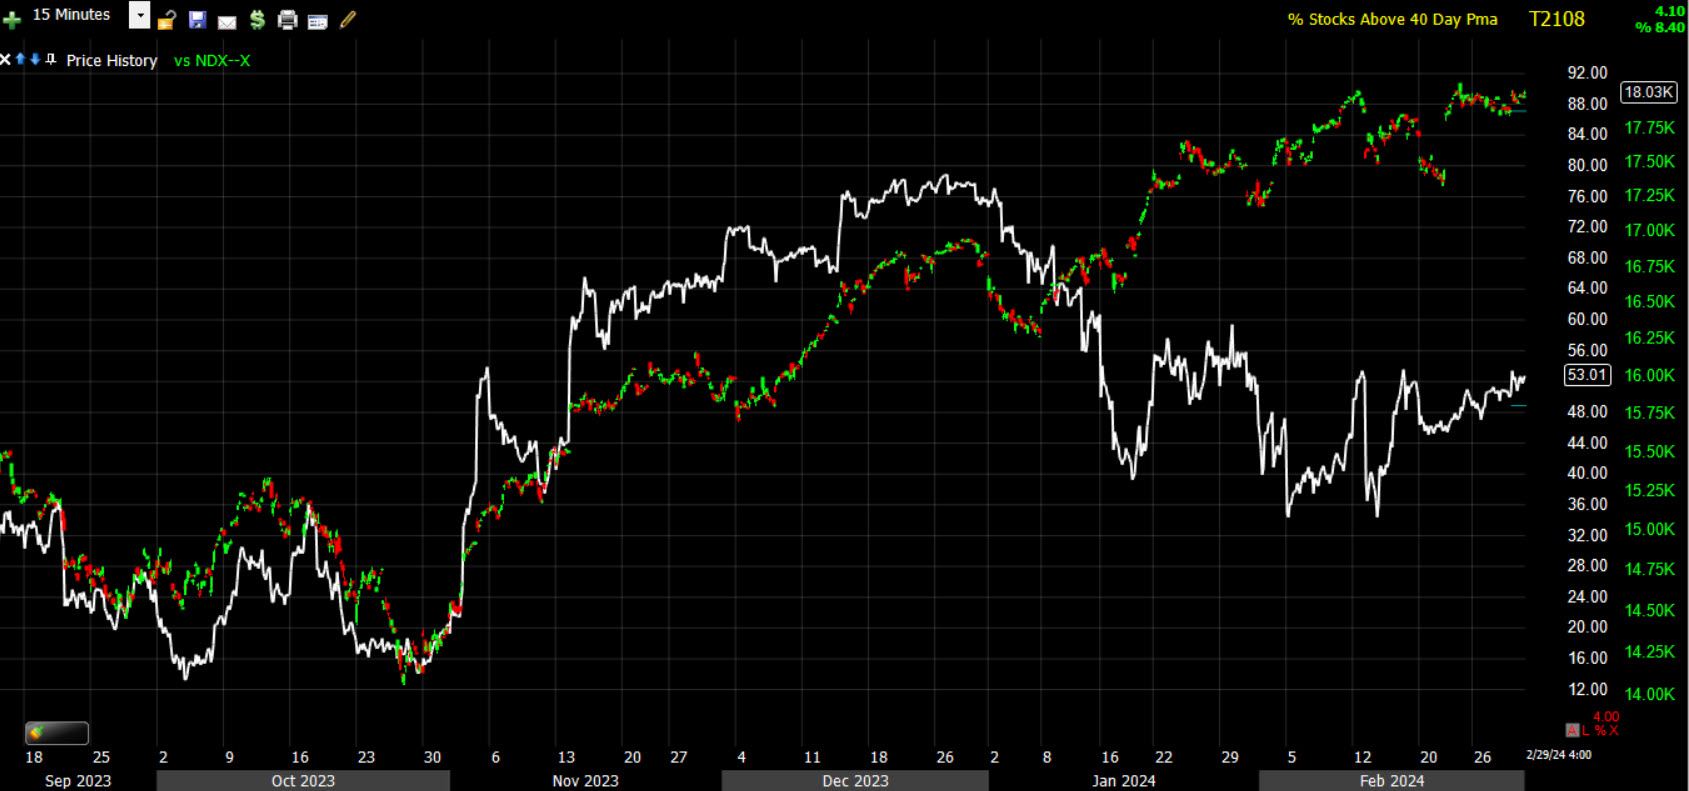 NASDAQ-100 (15m) and the percentage of NYSE stocks above their 40-day sma. Historically with an extended rally (not just a bounce) I see the percentage between 75% and 80%, not barely half.
Treasuries
The 2-yr yield fell three basis points today to 4.64% and the 10-yr yield fell two basis points to 4.25%. After the bond market close, yields continued coming off the lows of the day and the Fed-sensitive 2-year yield was near unchanged by the U.S. stock market close.
The gain in Treasuries today seems to be mostly PCE-related, including unwinding of positions that were expecting a hotter print, and there’s also month-end buying/rebalancing to consider. Overall, it wasn’t much of a reaction to the PCE data.
On the month, the Fed-sensitive short end of the curve gained 40 basis points, while the 10-year gained 30 basis points for the month, reflecting the Fed’s flip-flop messaging flip from the December to January meetings. The curve bear flattened in February as a result of the Fed’s flip-flop from signaling rate cuts in March, to , “Higher for longer”.
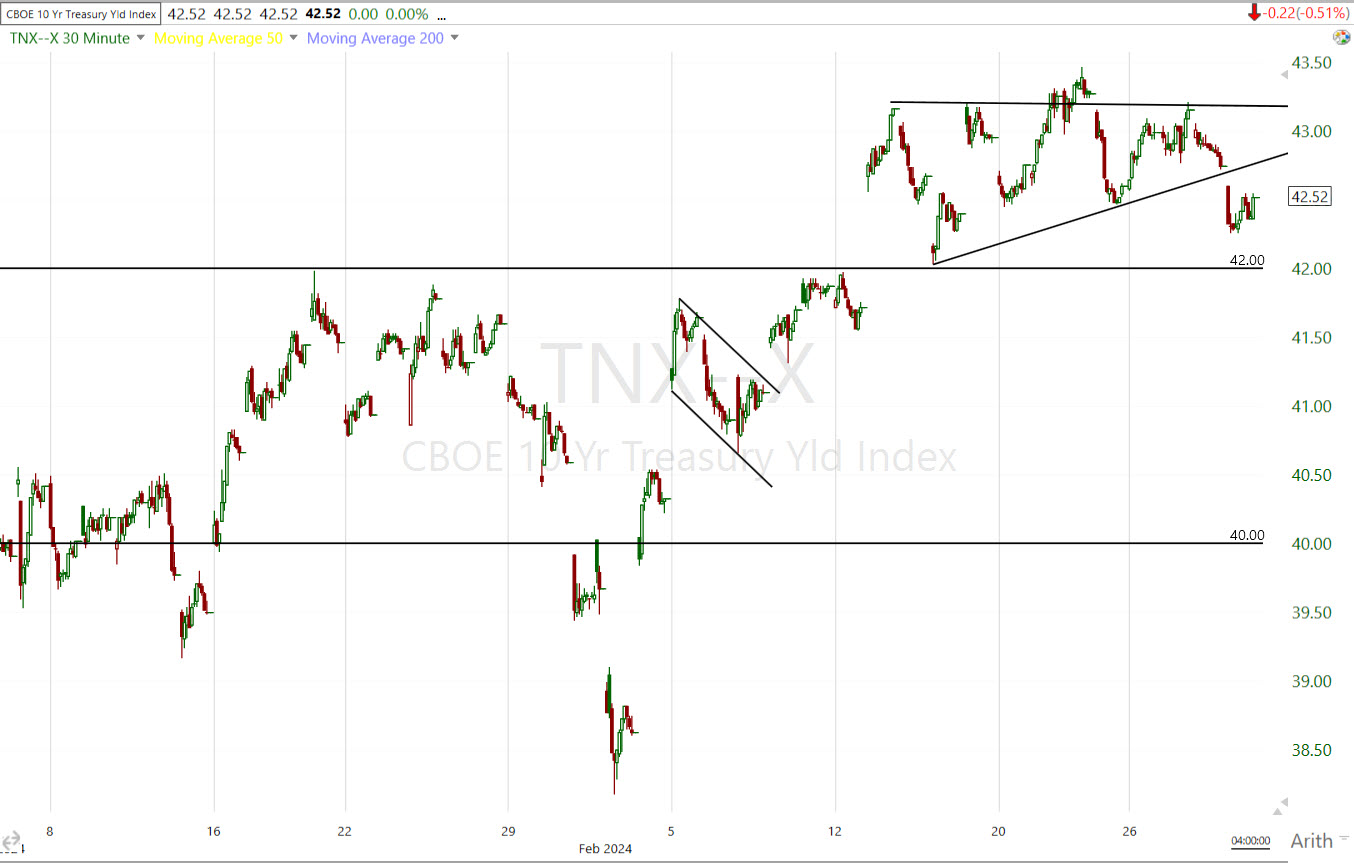 10-yr yield (30m) reflected the bond market’s expectation of a hotter than expected PCE print, and you can see the result with the yield dropping below the ascending triangle consolidation, but the consolidation has moved to a still bullish rectangle. You may recall we saw a massive breakout from a rectangle consolidation in Bitcoin at $53,000. The trend here is still bullish with higher highs/higher lows and the 10-yr remaining above 4.20%.
Of course the minor dip in the 10-yr has no bearing on the large and ongoing leading negative divgernece between yields and the averages.
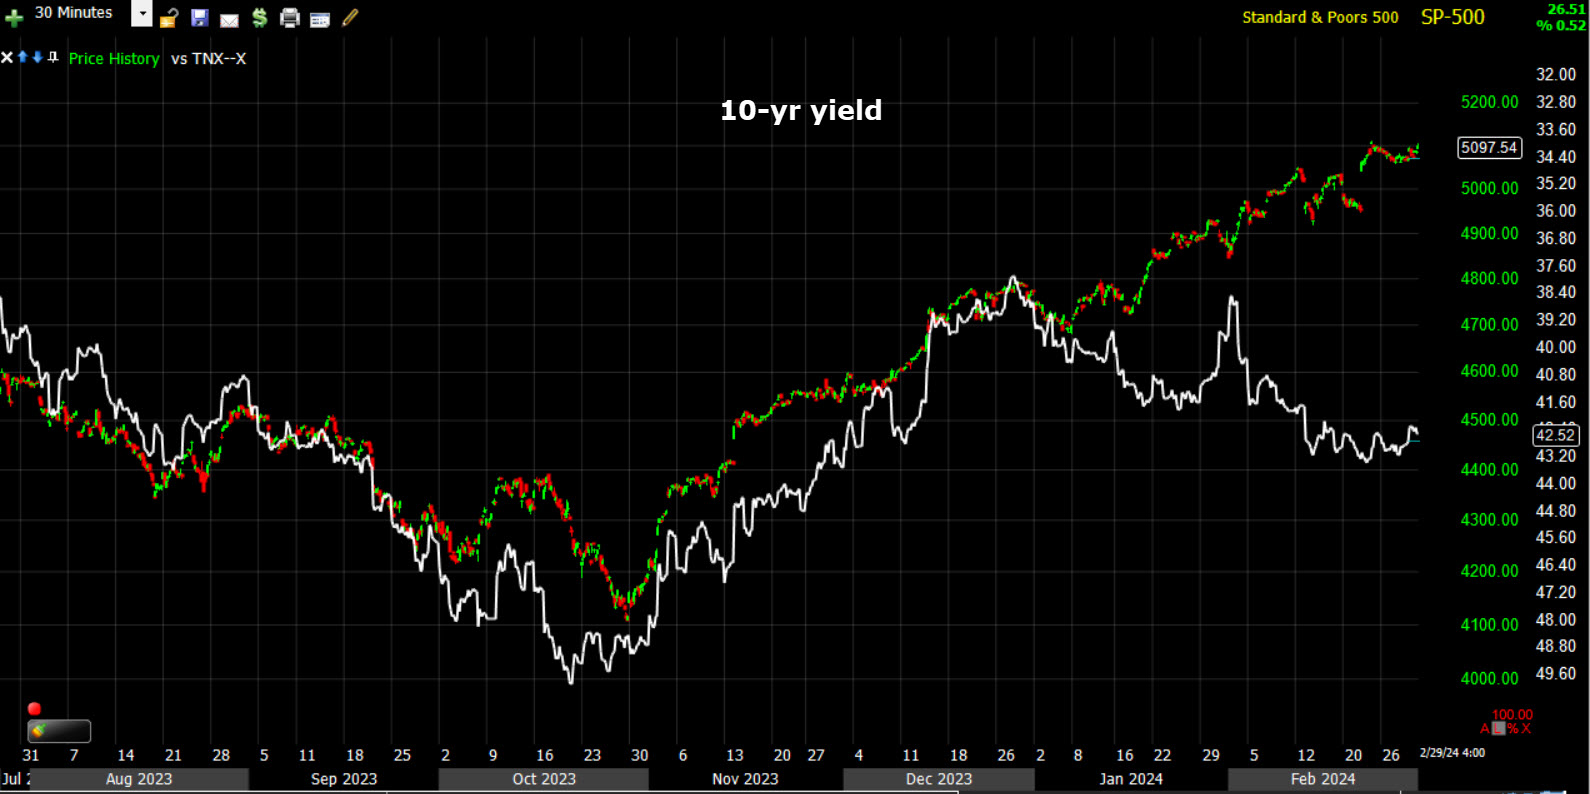 SPX & 10-yr (30m)
High Yield Credit (HYG +0.18%) was on the weaker side today, especially given most of the day yields were lower.
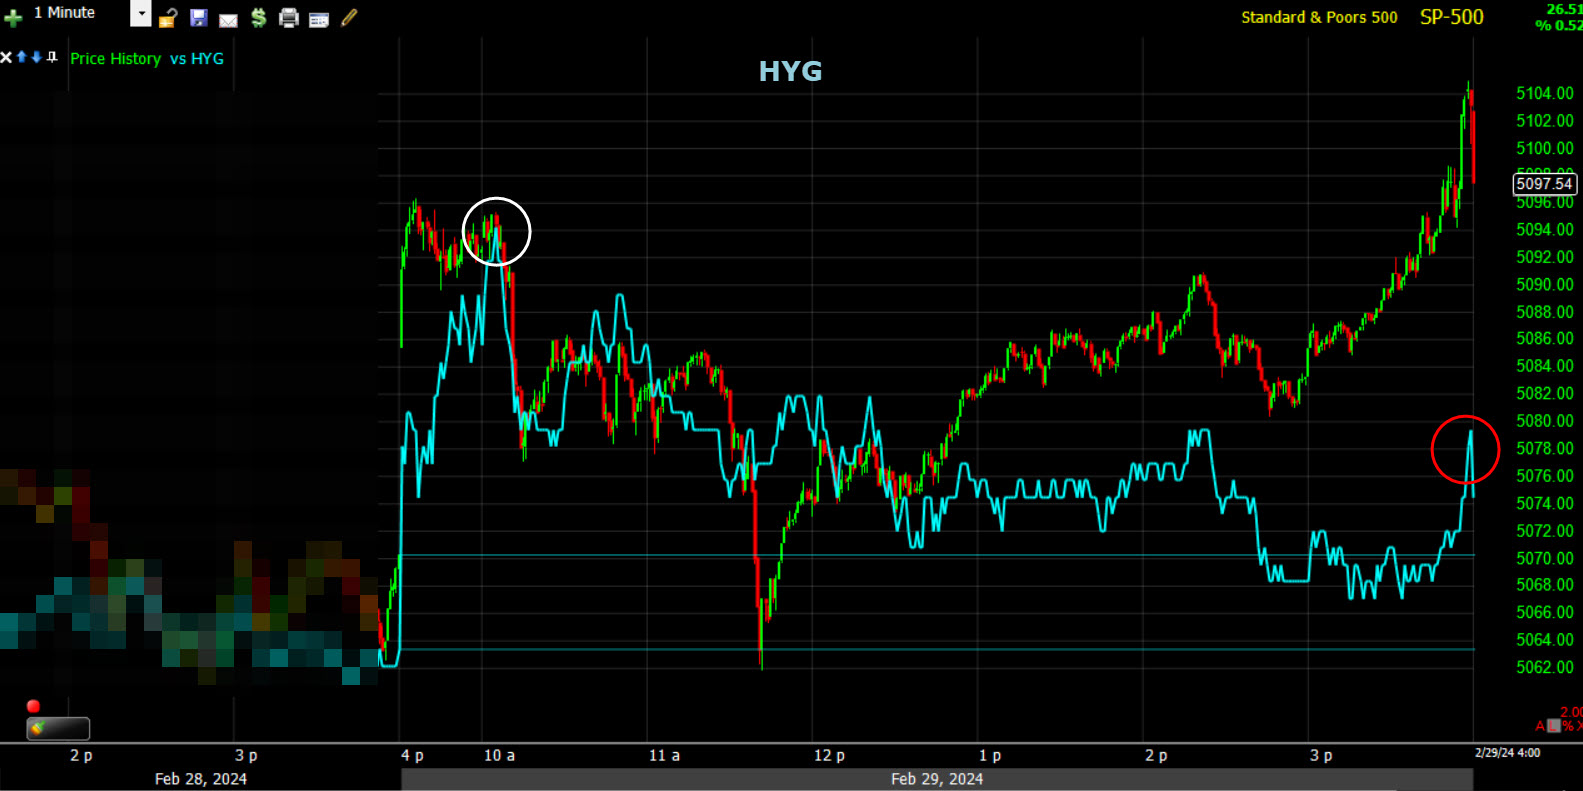 SPX/HYG (1m Today) – HYG barely participated in the closing ramp and ended the day well below morning highs. This speaks to institutional risk sentiment and their ongoing less optimistic view of markets at these levels, and more realistic view of the Fed’s policy rate path.
Currencies and Commodities
The U.S. Dollar Index initially sold off on PCE, but made a surprising sharp U-turn at 10 a.m. ET, retracing all PCE losses and closing higher by +0.15%. I suspect this was due to Fed comments that brushed off the in-line PCE report with CPI and PPI much hotter than the Fed is comfortable with.
The Dollar gained for the second month in a row, creating the notable divergence we have with stocks.
 U.S. Dollar Index (30m) – The bullish consolidation ahead of the PCE print remains intact.
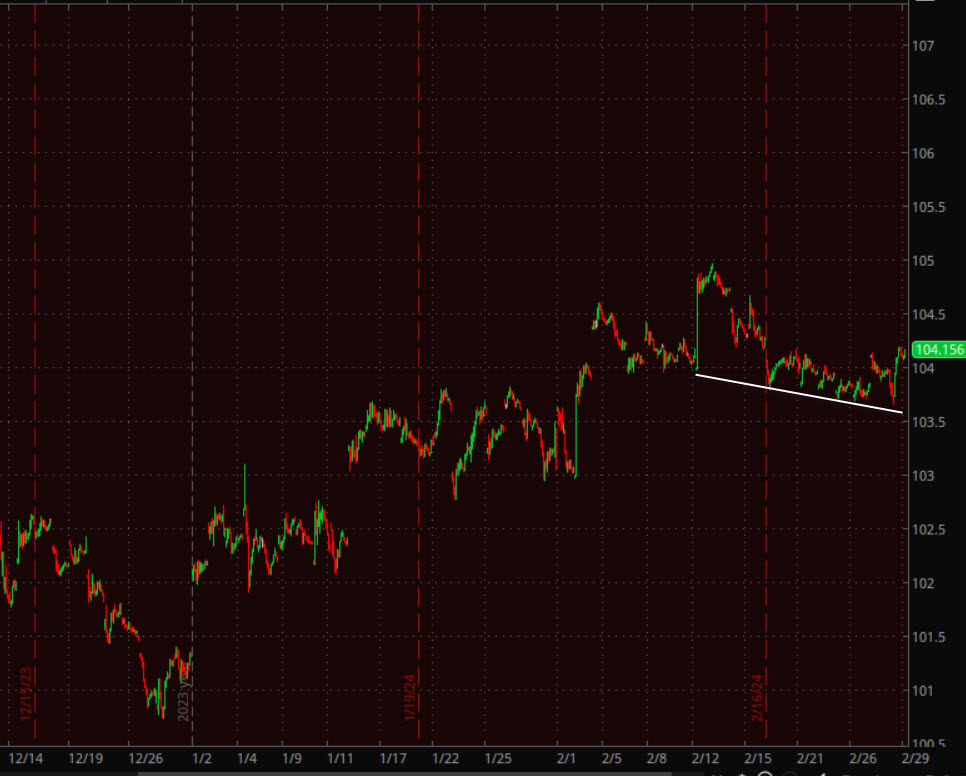
WTI Crude oil tested just above $79 again today ($79.28).
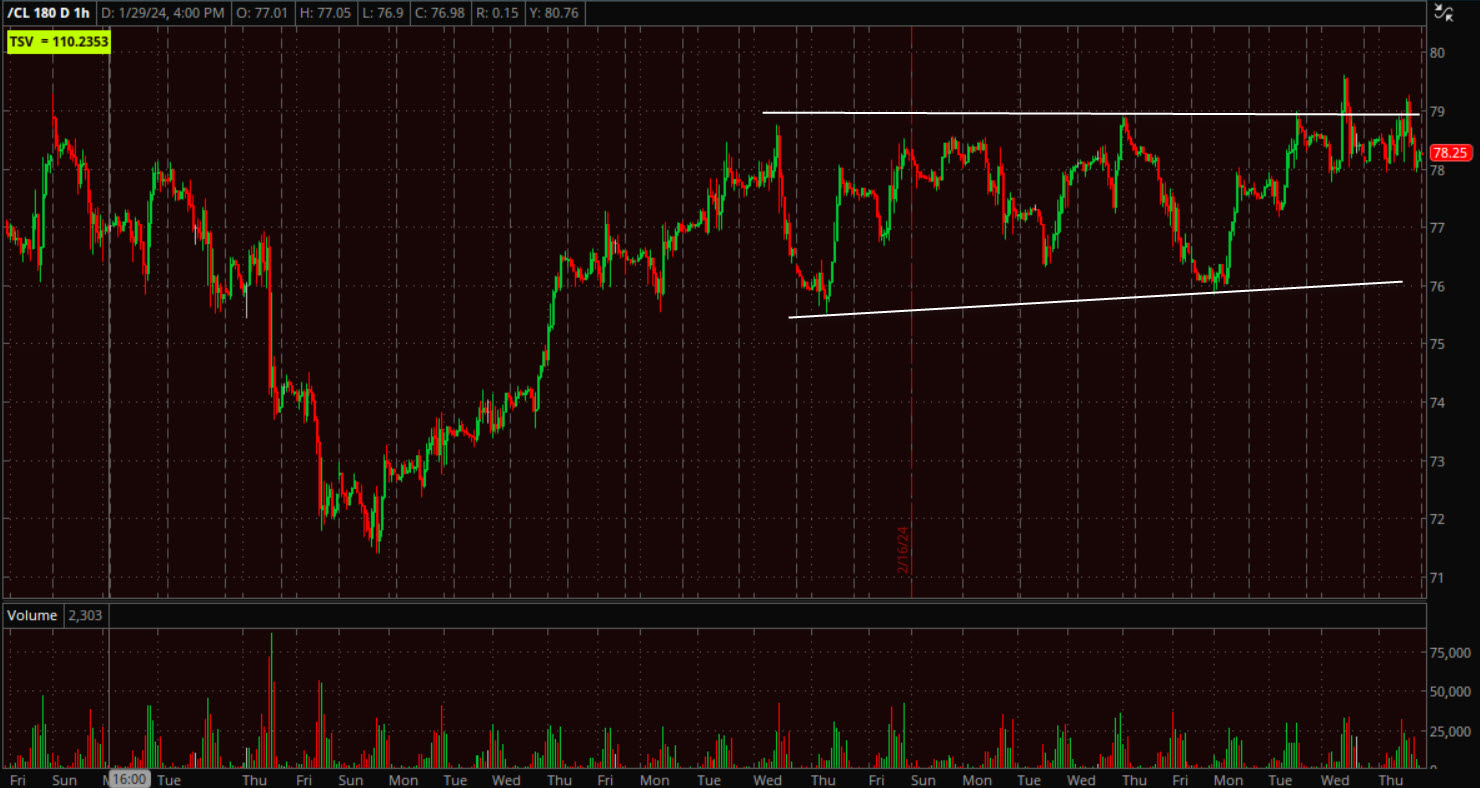
WTI Crude Oil (60m) testing just above $79 resistance again. We may see price test the lower trend line, but a breakout here is looking more and more likely. That will drag yields higher with it.
URA was only down -0.2%, but the 100-day is still acting as technical resistance.
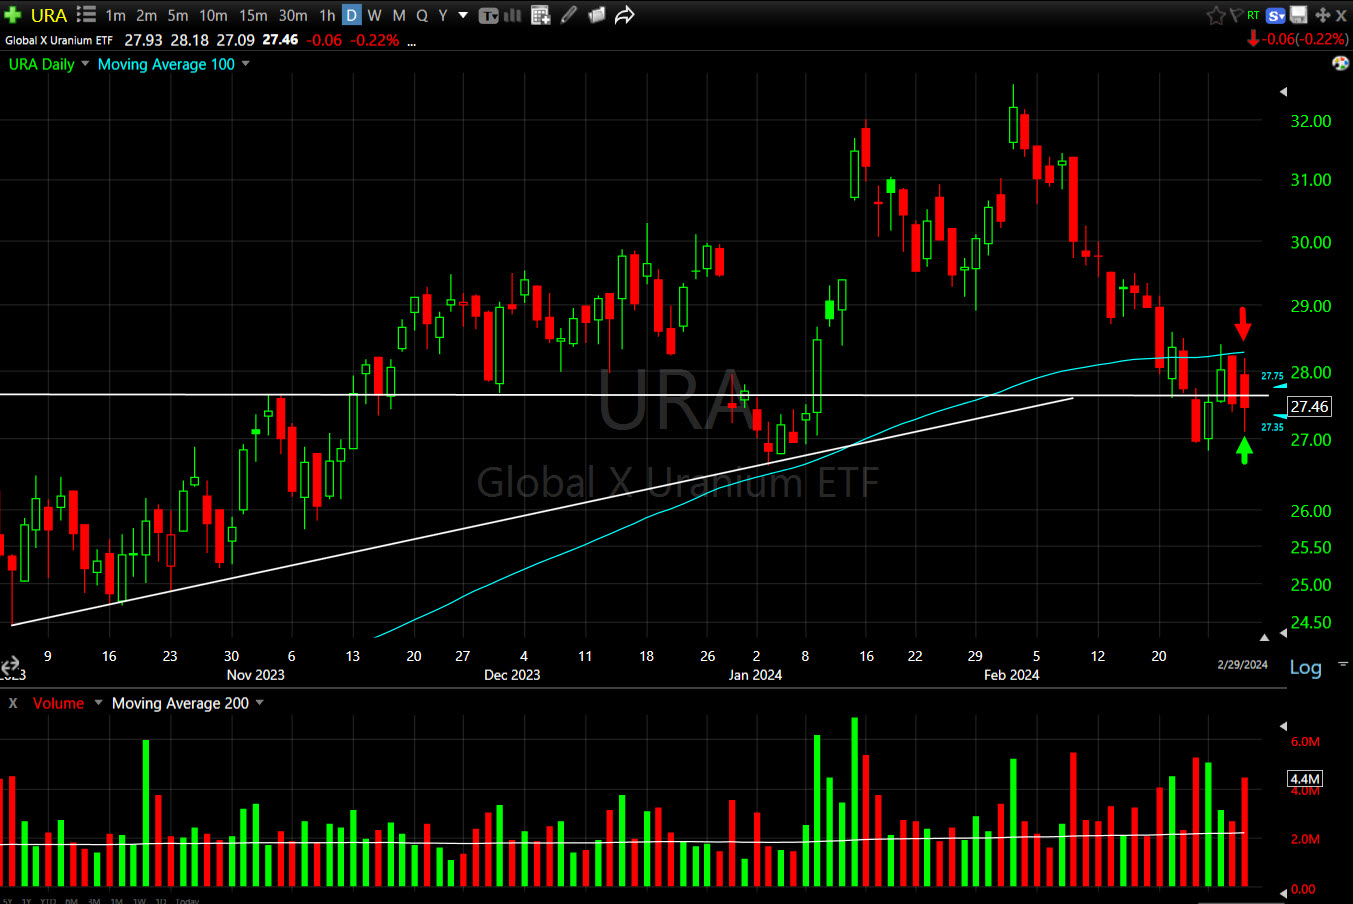 URA (daily) – However, the last bullish consolidation’s upper trend line is still acting as support.
I’m still very much on the fence with UNG (-1.15%) until price action clears up.
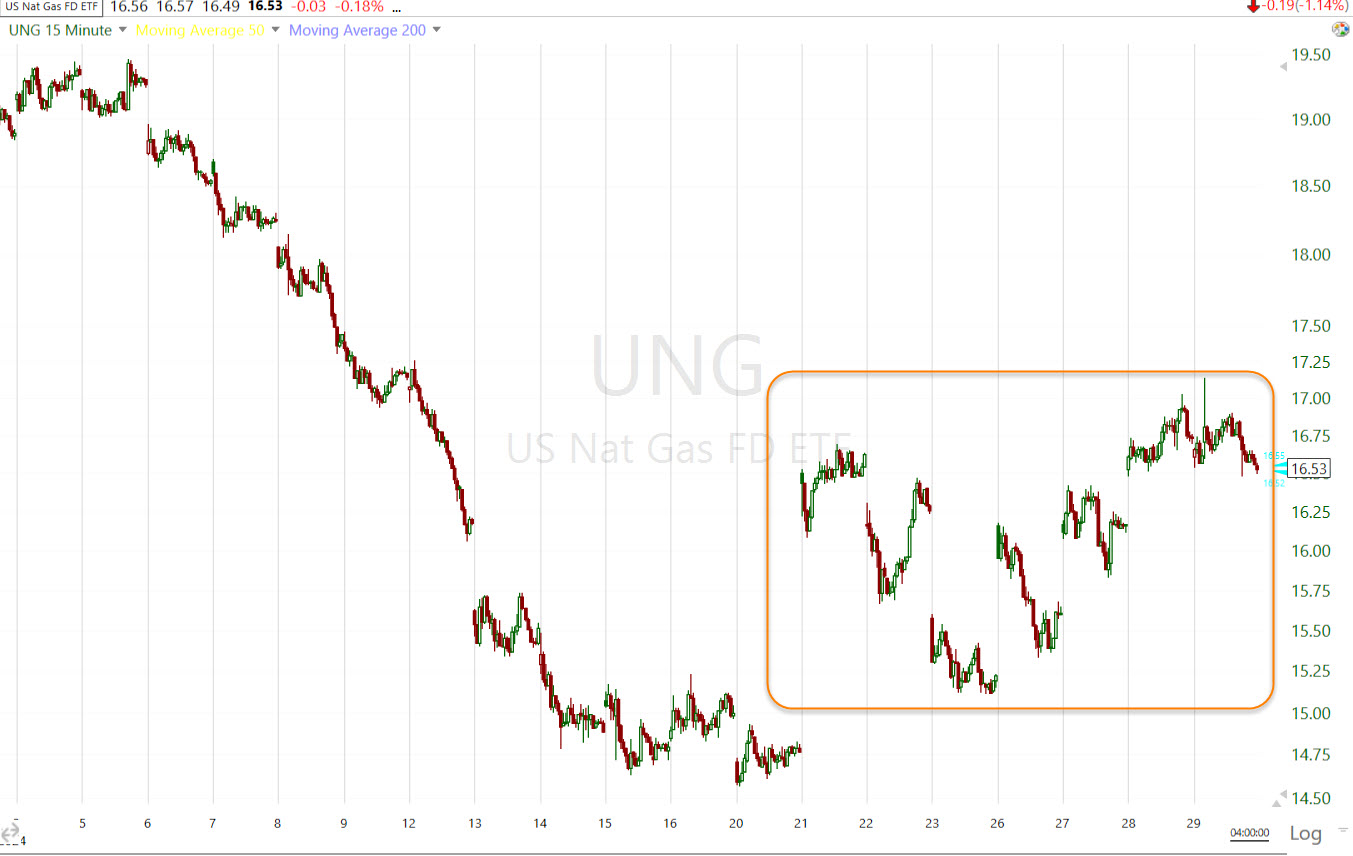 UNG (15m) – Bullish price action becomes quite clear and I’m not convinced that this is bullish price action since the big jump off the lows. It’s sloppy and looks like indecision to me.
Gold ended the month of February unchanged as price consolidates as I’ve long hoped. Gold futures settled $12 higher or +0.6% to $2,054.70/oz, producing gains despite a rebound in the dollar, but helped by modestly lower yields. I’m still feeling optimistic about gold’s prospects in 2024, but in the meantime, the larger of a base it builds, the more it is likely to rally strongly. This one is baking in the oven.
On a side note, Bitcoin ETFs have seen +$7.4bln of inflows since their recent introduction, while Gold ETFs have seen $2.9bln outflows. Just another reason to keep an eye on Bitcoin.
Bitcoin was down -1.5% today with recent resistance between $63 and $64k.
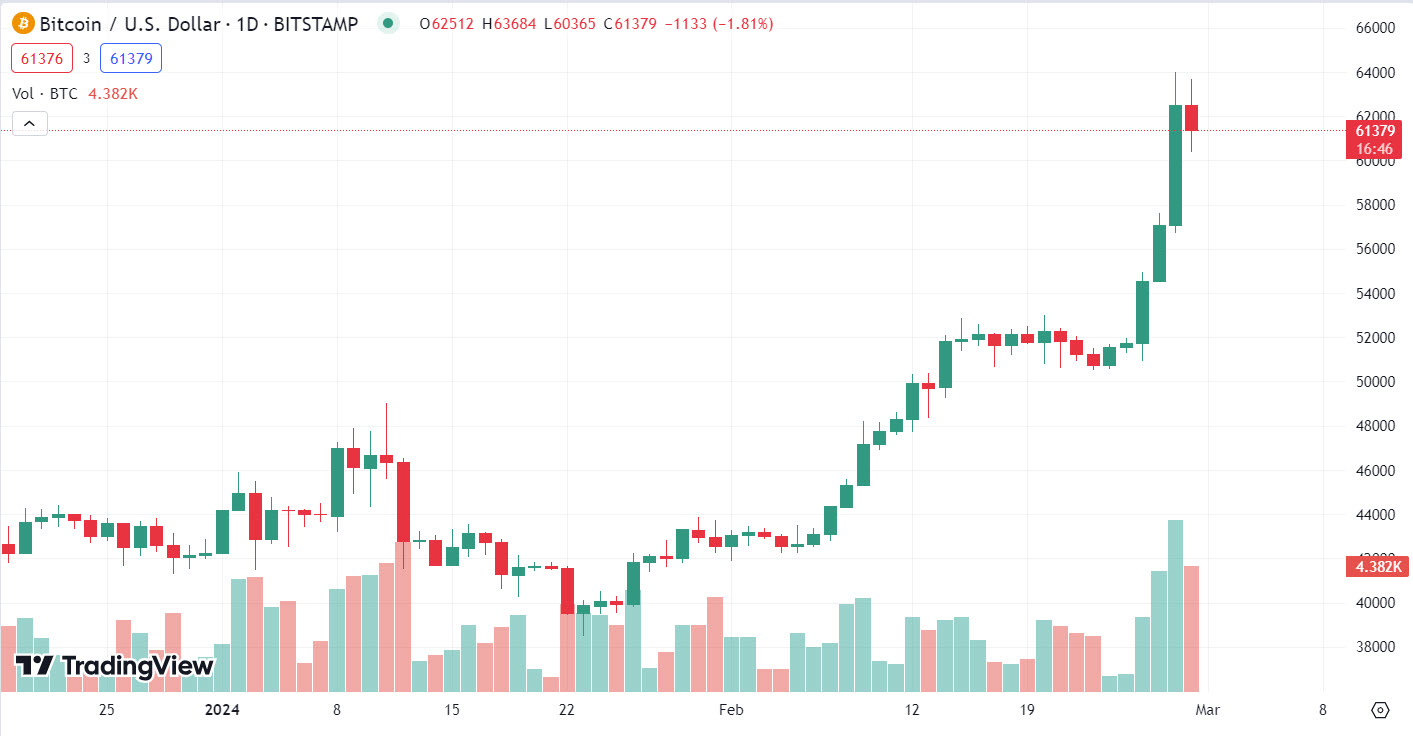 BTC/USD (daily) the big green volume yesterday is a function of price closing higher and the volume bar painted green to reflect that, but taking a closer look, there’s some bothersome volume.
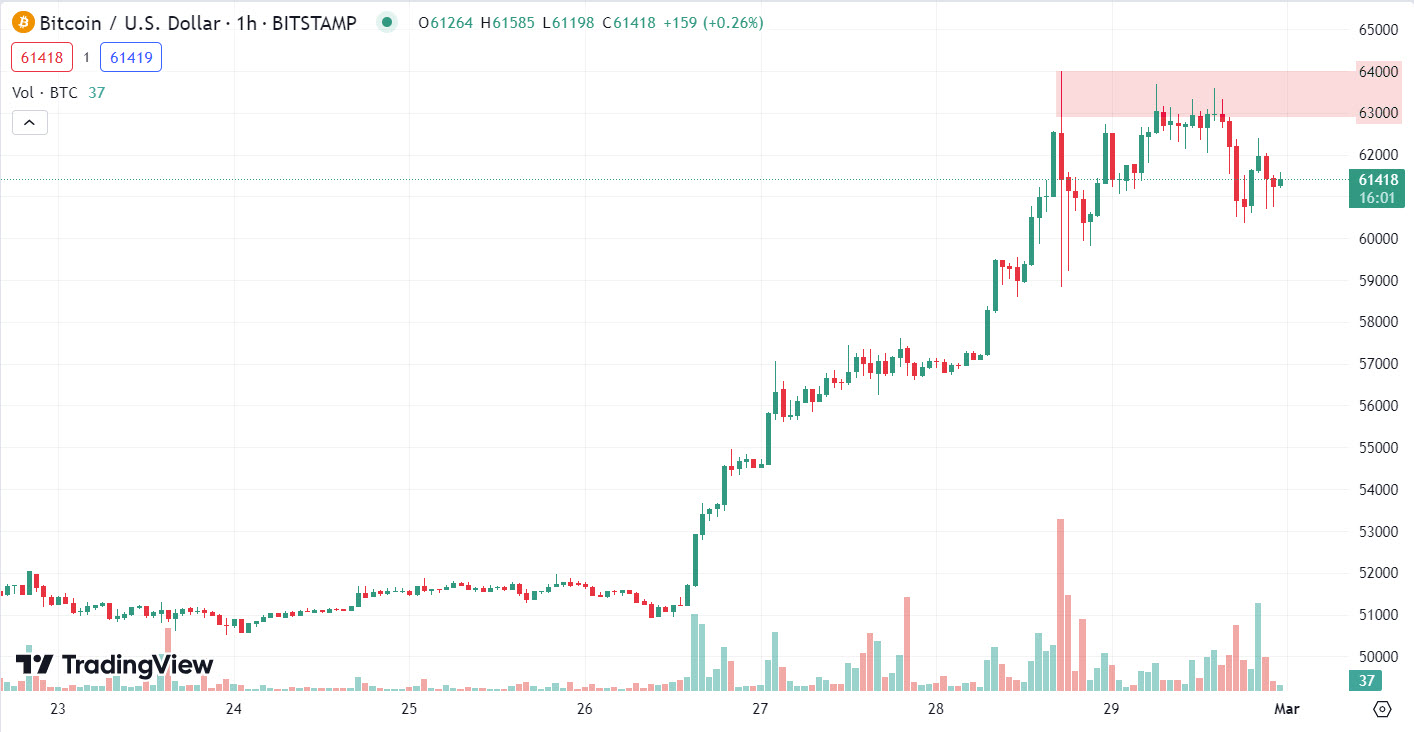 BTC/USD (60m) – The long upper wicks on recent candlesticks in the $63-$64k area depict price resistance, but also note the big red volume as price was first rejected at $64k. In fairness, this is also the same day Coinbase had issues with some clients seeing an account balance of zero. Overall price is consolidating and it should be viewed as bullish for now. The longer upper wicks on candlesticks in the area is a slight dent in that bullishly biased consolidation, but the heavier sell-side volume is more concerning. I’d still give the bulls the right of way on this chart, but it’s not a beautiful, clean bullish consolidation. I’d take that into account with new positions and risk management.
In last night’s post I featured a crypto that I liked as far as the price action, Solana,
“’I’m no crypto expert, but Solana’s price chart popped on my radar (SOL) as looking pretty darn good.
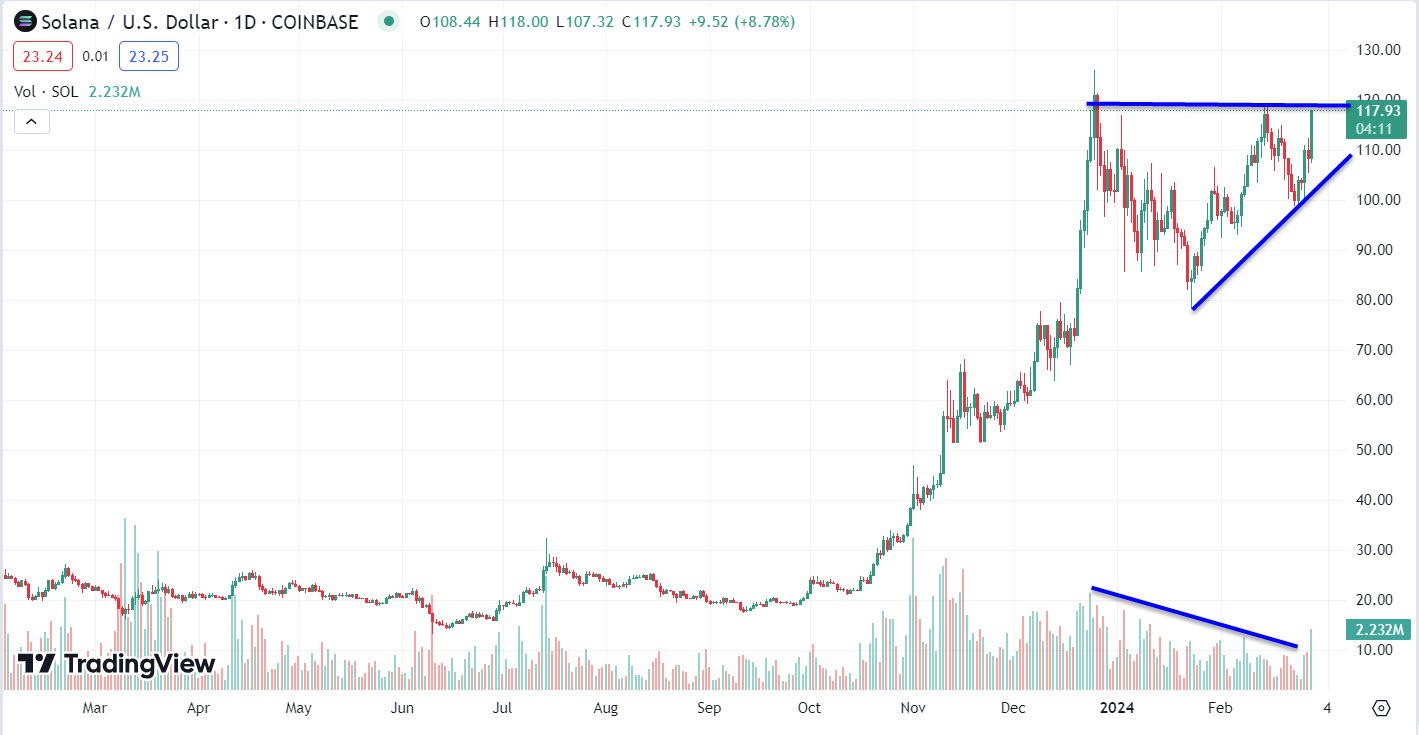 SOL/USD (daily) with a nice bullish ascending triangle and confirming volume. I’d guess that if this is going to breakout, it’s going to be sooner than later as the triangle is nearing an apex.”
And today SOL broke out…
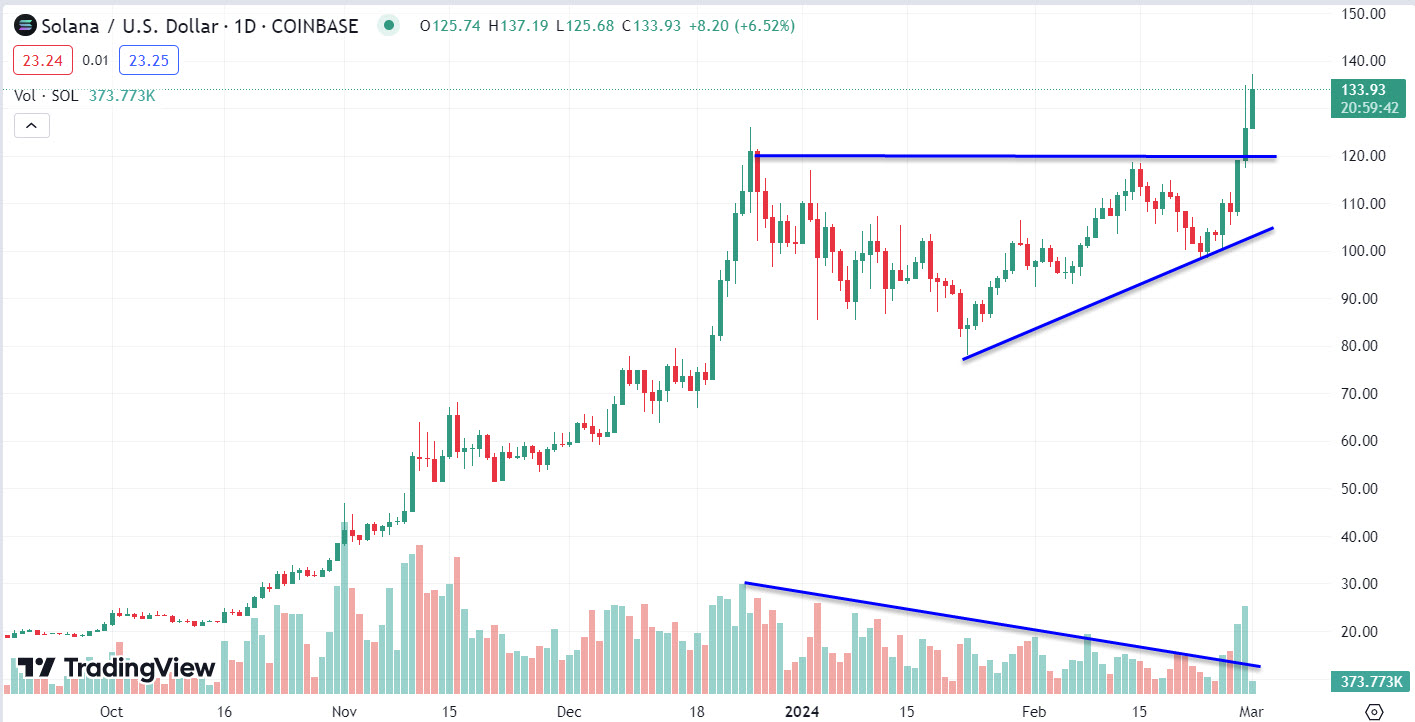
SOL/USD (daily) is up almost 10%. The price candles for the breakout are excellent, and the volume increases as it came out of the bullish consolidation is exactly what we want to see on a breakout. If you’re in the trade let me know and I’ll get into some more in depth analysis, but I definitely like this one a lot better than chasing Bitcoin.
Summary
I’m going to leave the post stand and just add that I wouldn’t be short the market averages yet, but I sure see a lot of risk. There are divergences far bigger than what turned the market up in October of 2022, the market down in August of 2023, and the market up November 2023. We don’t usually see divergences this big because price has turned well before they got this large. That’s one reason I believe we are seeing something much bigger and meaningful unfolding here. There’s just too much wrong with this market from participation/breadth, sentiment, money flow/volume and on and on. But there is very strong, borderline euphoric sentiment (which isn’t good either). This is the stuff of important turns.
It should also be noted that more often than not, price trend changes occur at the change of the month. For example, the summer H&S top started breaking down at the start of August. The current rally began at the start of November. Unless there’s some oddball event, we usually see trend changes with the start of a new month. I do think the market has more chop to go, but I’ll be interested to see what type if any, rotation there is as funds rebalance and reposition with the new month.
In March we’ll see the corporate buyback window (currently 91% open) start to blackout on March 14th and that will last until April 26th. The Fed’s BTFP bank rescue program expires March 11th and we’re already seeing more trouble tonight with NYCB.
Overnight
S&P futures are up +0.15% tonight in an extension of the mega-caps gains the last hour of the day. NASDAQ futures are up +0.25%. Dow and Russell 2000 futures are up around just 0.05%.
The U.S. Dollar index pulled back a little (-0.1%) but isn’t far off session highs after a big recovery from this morning’s PCE print.
WTI rude Oil futures are up +0.25% to $78.50, staying close to that $79-$80 resistance.
Gold futures are unchanged.
Bitcoin futures are down -1.5% at $61,148 (BTC/USD) – the consolidation zone.
The 2-yr yield is down -3 bp and 10-yr -1 bp.
Friday’s economic calendar features:
- 9:45 ET: February S&P Global U.S. Manufacturing PMI (prior 49.1%)
- 10:00 ET: February ISM Manufacturing Index (prior 49.1%), final February University of Michigan Consumer Sentiment (prior 78.8), and January Construction Spending (prior 0.9%)