The major averages all began today’s cash session with mixed price action, oscillating around yesterday’s closing levels. However, it was clear early on that mega-caps that carried the market yesterday, were out of favor, while Value and Small Cap stocks rotated in.
The afternoon saw a move higher and left the major averages near their highs of the day, but with rather modest gains and lighter volume for a second day across the board in the averages ETFs. That’s not what you want to see on a day the market advances, but it is consentient with consolidations. NASDAQ-100 currently has the clearest and earliest consolidation with a 2-day head-start on the other major averages.
In today’s economic data the highlights were wages grew faster than expected, which the Fed won’t like. And Consumer Confidence weakened, mostly related to inflation concerns.
Iranian-backed Houthi rebels in Yemen formally declared on Israel. The group has been firing missiles and sending drones into Israel. I don’t see this is a major regional escalation. Judging by gold and oil’s price action today, I don’t think the market is worried about it either.
Averages
Gains in most of the averages were modest today with Small Caps outperforming. Dow Transports were in line with the rest of the averages with a half-percent gain.
S&P-500 ⇧ 0.65 %
NASDAQ ⇧ 0.52 %
DOW JONES ⇧ 0.38 %
RUSSELL 2000 ⇧ 0.91 %
The S&P 500 approaching 4,200 today, but in a very narrow wedge consolidation on falling volume.
 SP-500 (10m) nearing $4200. I think there is a chance that the S&P’s range broadens out to something like a bear flag. I am not a big fan of large wedges because they are common, and almost like seeing animals in the clouds. I don’t have much confidence in wedges as a reliable and predictable pattern, but these small wedges like this one tend to be fragile. I’d say more fragile than a bear flag, especially in such a narrow range and coming to an apex. The rule of thumb for a wedge is that when they break down, they retrace their base, which would mean back to Friday’s low or the $4100 area where it would be close to meeting its H&S downside measured move ($4085-$4100).
I also mentioned in the Afternoon Update,
“My guess, or perhaps my preference at this point would be for the S&P to back down, tag at least the $4100 area and fulfil the measured move, and then I think we can look for something in the way of more durable support, because once again, buyers’ conviction is just not showing up on the 3C charts. “
The Dow bounced up to the $33,000 area (its H&S downside target is around $32,000), and again, on light volume through the 2-day advance.
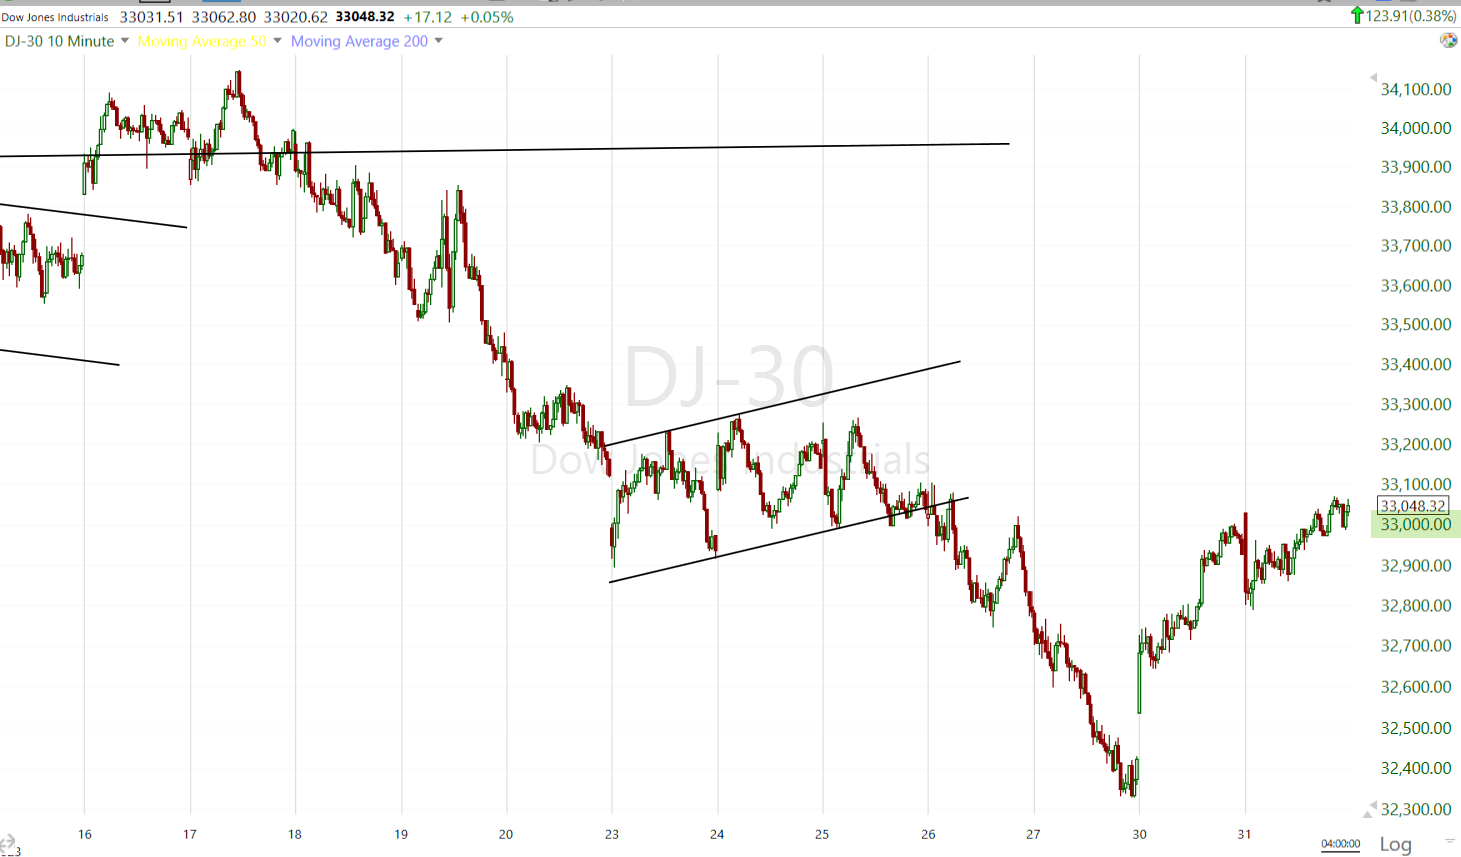 Dow (10m) at $33k.
NASDAQ-100 had the most improved 3C chart last week, but it wasn’t any more than what we typically see before a consolidation starts. NASDAQ-100 had a 2-day head start on the other averages in forming its consolidation…
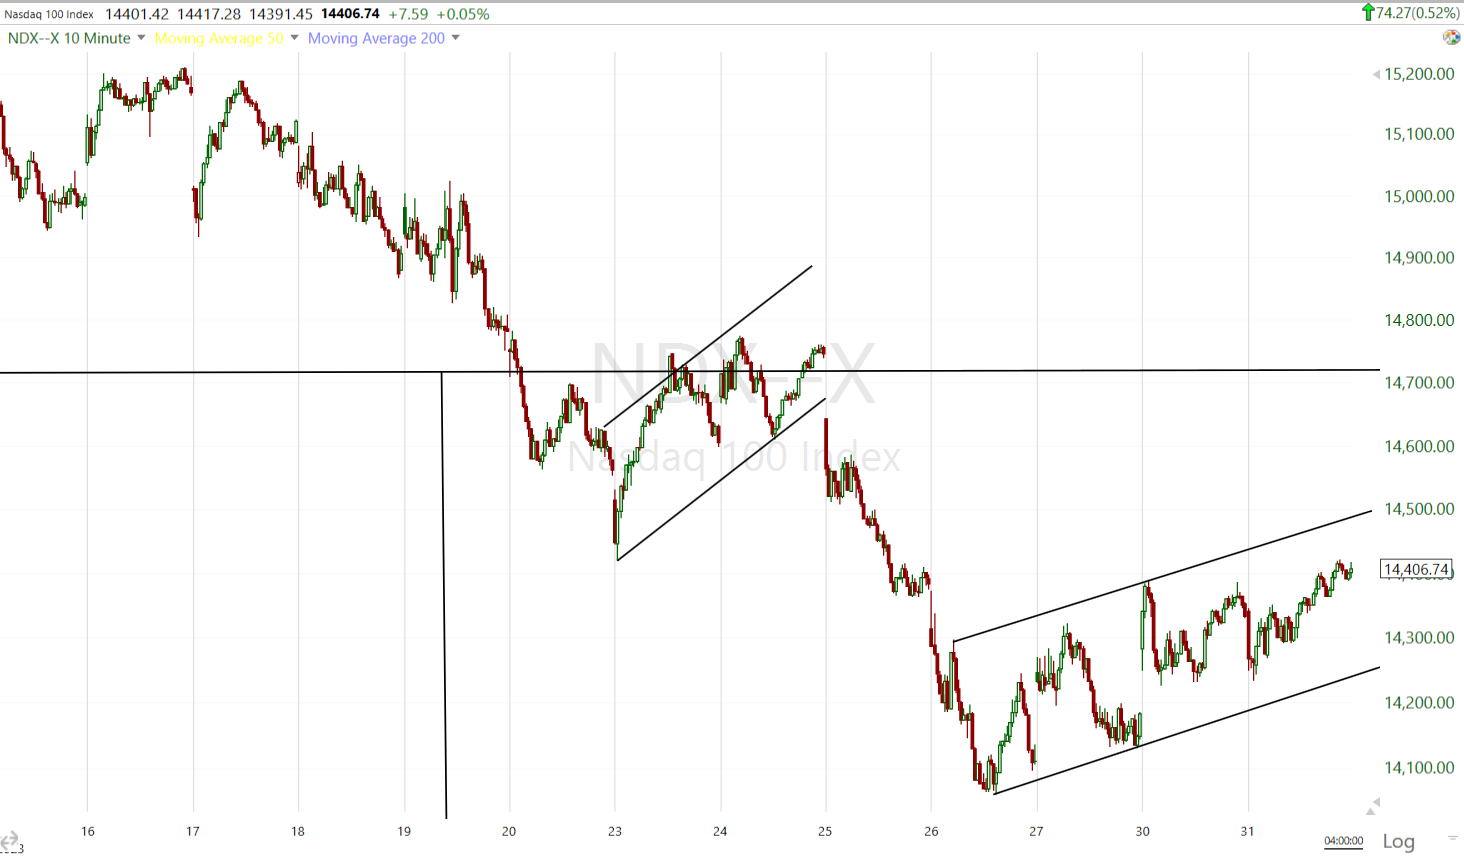 NASDAQ-100 (10m) while I’ve kept the trend lines as a bear flag as initial price action indicated, recent trade has been in a very narrow range and has a “wedgey” feel as well, and on declining volume.
Small Caps are tricky here…
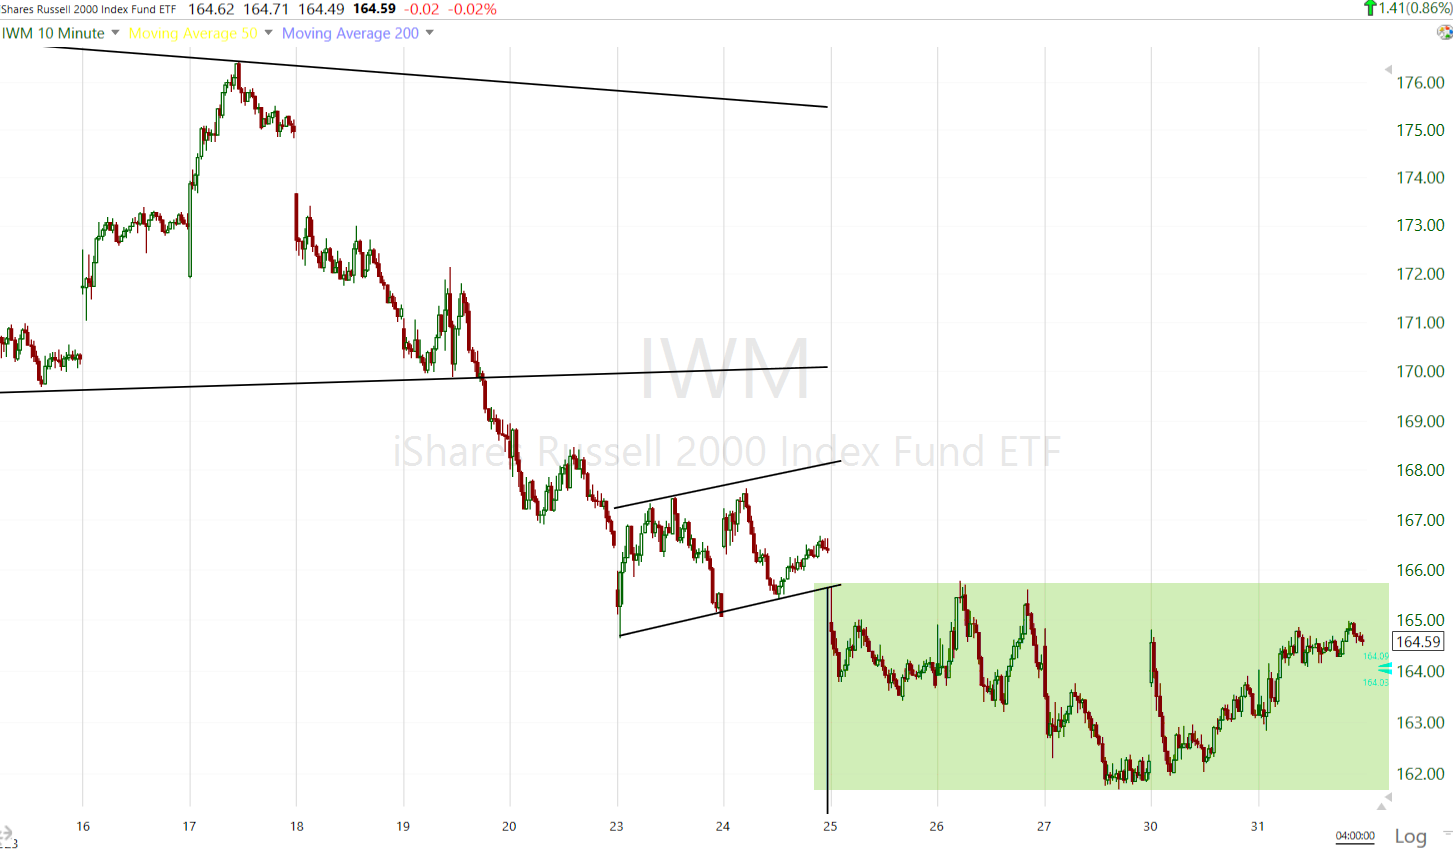 IWM (10m) since breaking down from a bear flag last week I’ve noted numerus times how small caps are trading more sideways. A decline from a bear flag should be impulsive and a fairly clear vertical decline. Since IWM already met its downside measured move from its H&S top, I suspect it’s trying to consolidate around that target level ($166). The bear flag still carries a downside measured move to $159 or about -3.4% lower from here, but price is not acting like a second leg down out of a bear flag and its 3C chart, while not overly impressive, is consistent with this more choppy, lateral feel with weak support in the area.
As also noted in the Afternoon Update stock index futures have caught up to the recent positive divergence with Treasury futures in a mean reverting move…
” I think we’re pretty close to the reversion point with the averages’ bounce , or consolidation would be a better description, the last 2 days.
 S&P futures (15m) and 10-year UST futures.”
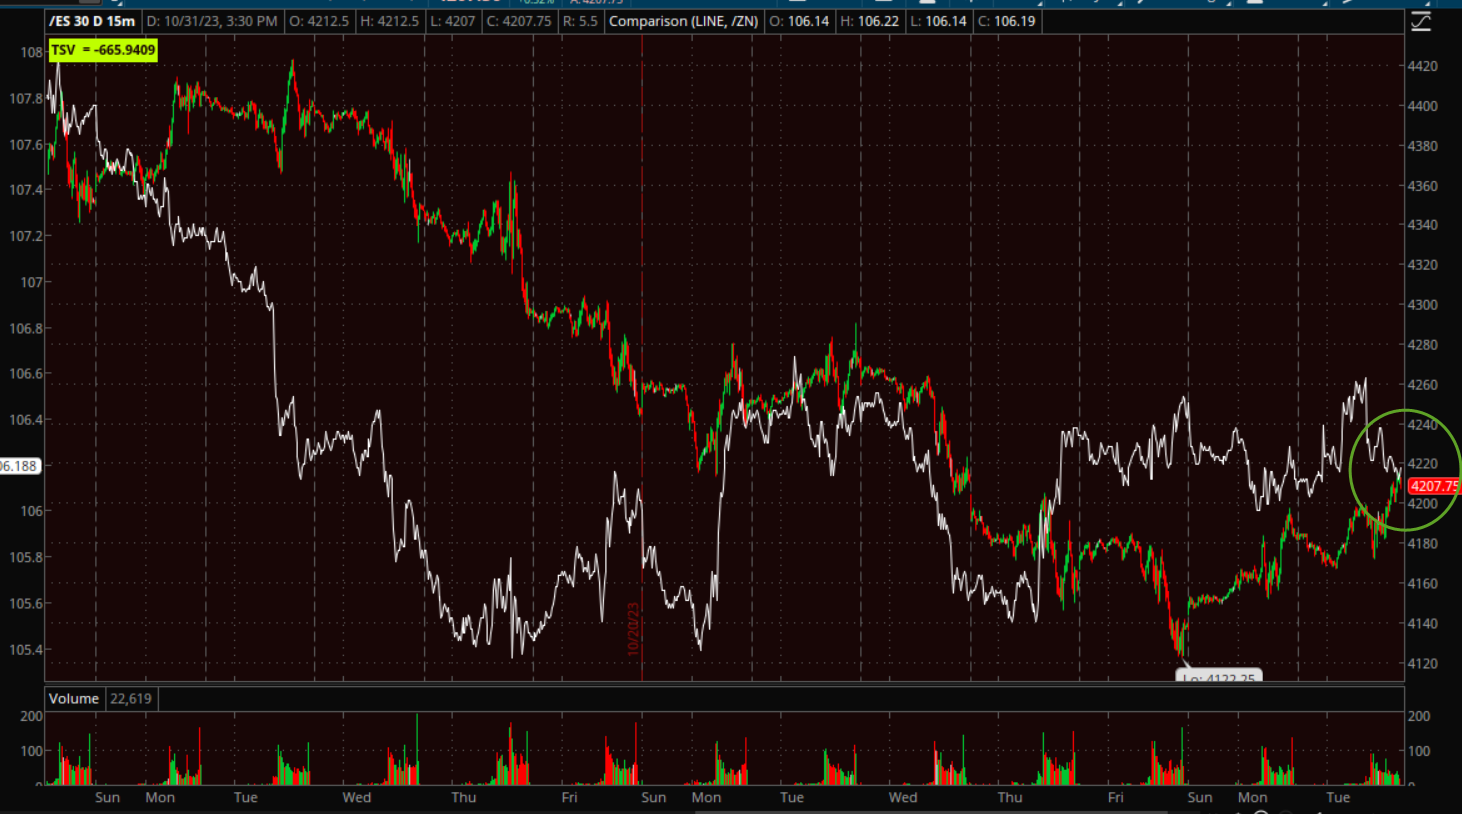
However, late this afternoon the short term divergence today between stock index futures and rates (or Treasury futures) widened even more…
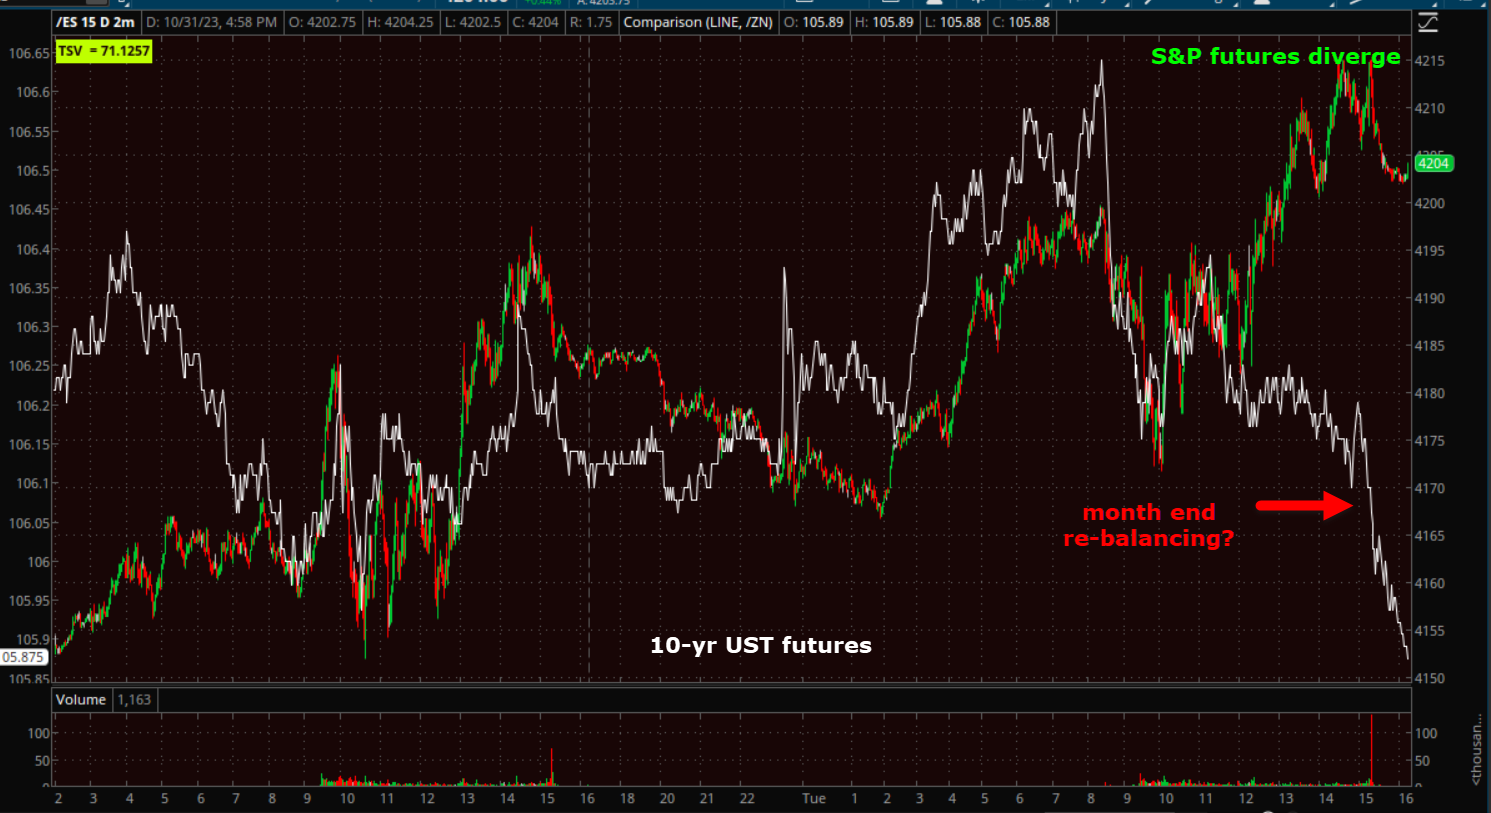 S&P futures (2m) and 10-year UST futures diverge today. This afternoon there was a big move lower in UST futures (yields higher) on huge volume in the 10-yr UST futures, which must be month-end fund (pension?) rebalancing, but it drove the divergence even wider.
VIX (-8.15% to $18.01) saw the typical pre-FOMC relative weakness and the relative weakness that VVIX (-7.65%) has been forecasting.
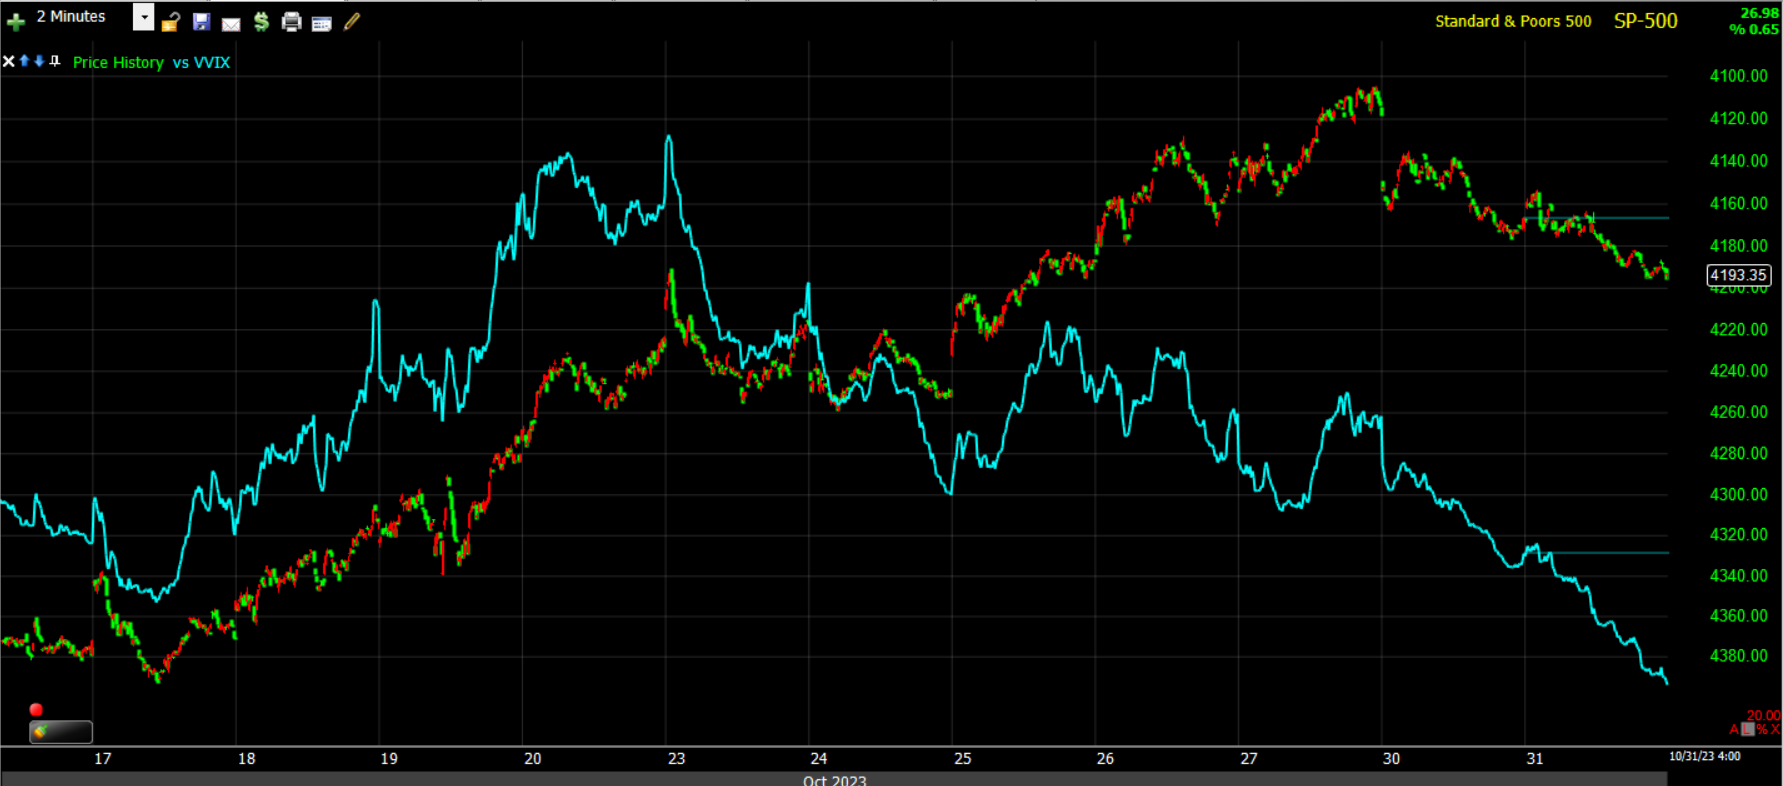 SP-500 (2m) w/ price inverted and VIX.
As discussed last night, the weakness in volatility suggests the market is near to finding a more durable short term bottom after most of the averages have met their measured moves or are close, but I don’t think we’re there yet.
The Absolute Breadth Index fell to 31.
S&P sectors
All 11 S&P 500 sectors closed with a gain led by Real Estate and Financials. The mega-cap heavy Communication sector that saw a dead cat bounce yesterday, saw the slimmest gain today.
Value style factors (+0.9%) easily outperformed Growth (+0.4%), which also means mega-caps (MGK +0.5%), which are trading in a bear flag, underperformed the S&P Equal Weight Index (+0.85%).
Apple (AAPL +0.3%), which reports quarterly results after Thursday’s close, was down as much as -1.4%, but closed with a gain. Microsoft (MSFT +0.2%) also recovered from a loss, having been down as much as -0.8%.
Utilities were the only sector to end October with a gain, while Energy and Consumer Discretionary ended up as the biggest losers.
Materials ⇧ 0.45 %
Energy ⇧ 0.33 %
Financials ⇧ 1.09 %
Industrial ⇧ 0.74 %
Technology ⇧ 0.71 %
Consumer Staples ⇧ 0.35 %
Utilities ⇧ 0.86 %
Health Care ⇧ 0.57 %
Consumer Discretionary ⇧ 0.76 %
Real Estate ⇧ 2.00 %
Communications ⇧ 0.51 %
A big batch of earnings news since yesterday’s close was met with mixed reactions. Dow components Caterpillar (CAT -6.7%) and Amgen (AMGN -2.9%) were losing standouts following their earnings reports while Pinterest (PINS +19.0%) and Arista Networks (ANET +14.0%) registered outsized gains after their quarterly earnings results.
Internals
NYSE Advancers (2012) outpaced Decliners by better than a 2-to-1 margin, on heavier typical month end volume of 1.1 bln shares, although volume is falling for the averages’ ETFs.
There was no Dominant price/volume relationship due to the month end volume, but I suspect if it weren’t for that, it would have come in at Close up/Volume Down. There is no 1-day overbought conditions.
Treasuries
The 2-yr yield settled three basis points higher at 5.08% and the 10-yr yield was unchanged from yesterday at 4.88%. I don’t think the short end liked this morning hot wage gains.
I’m going to post a few charts of the 10-year yield since it has been about a month since my, “I’m concerned” post, which was dealing specifically with what the price action in the 10-year (and 30-year) yields suggest, which is much tighter financial conditions, which probably keeps the Fed on the sidelines, but hurts the equity market, and more importantly, may be too much for the economy that was used to operating at an average 10-year yield of about 2.5% over the last decade.
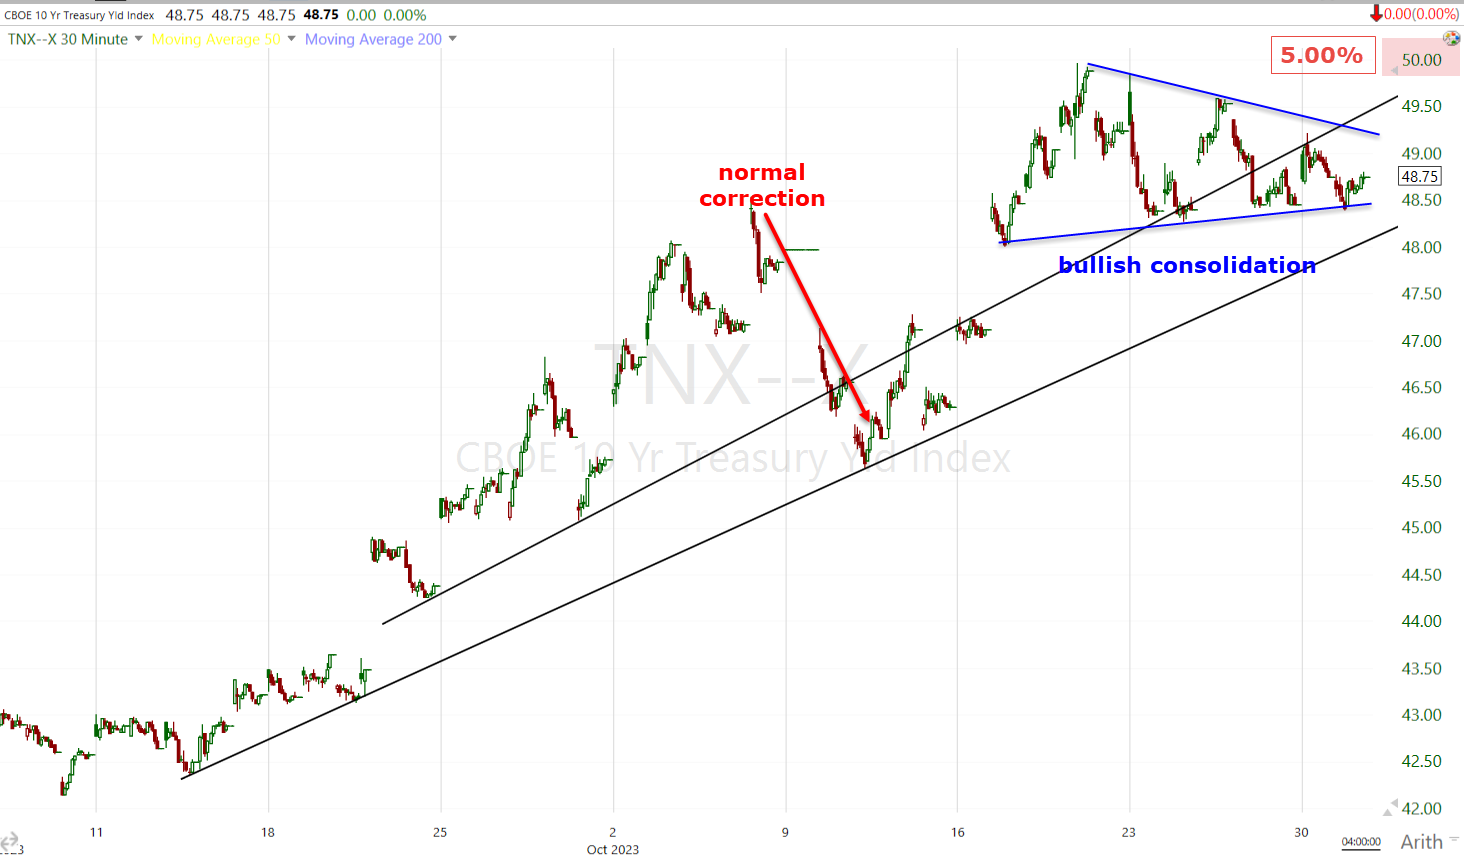 10-year yield (30m) – A suspected last week, we’re getting a bullish consolidation in the 10-year yield right under 5.00%. Think of it as the bond market (or rates) stopping and catching its breath, getting ready to take on the psychological and technically important 5.00% level.
As I’ve been noting the last several days, the last time we had a decent month-long consolidation in 10-year yields was mid-August to mid-September and the breakout from that consolidation led to a much steeper rate of assent in longer term yields.
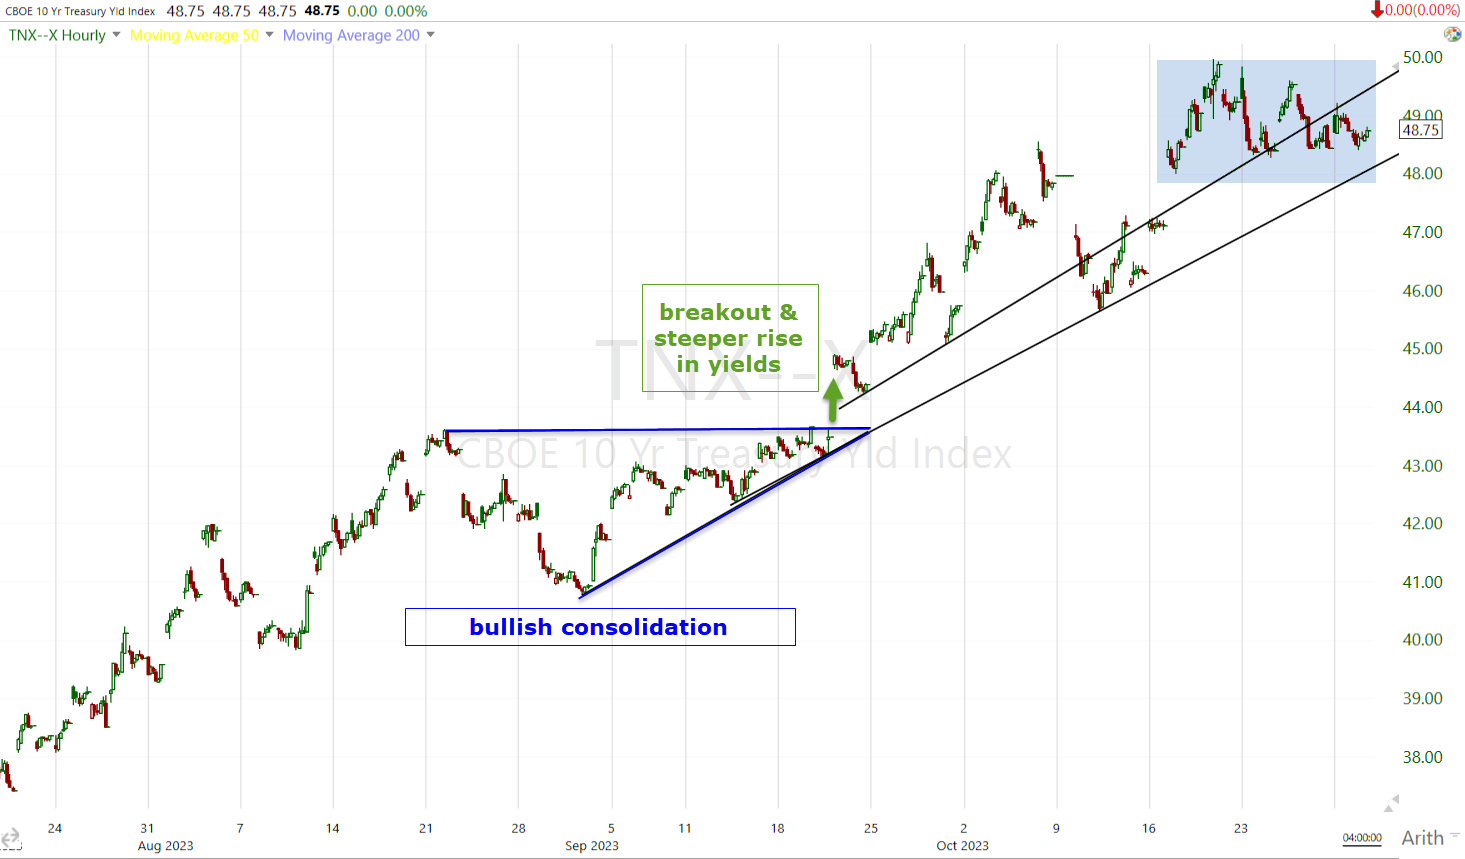 10-year yield (60m) this chart shows that consolidation, a bullish ascending triangle. The consolidation should look familiar, it’s what we’ve been watching on UNG’s (Nat gas ETF) price chart as a large base.
And here’s an even broader view which led to the “I’m concerned” post. My concern wasn’t for the market as I’ll trade an up or down market, it was for the economy, my friends and family.
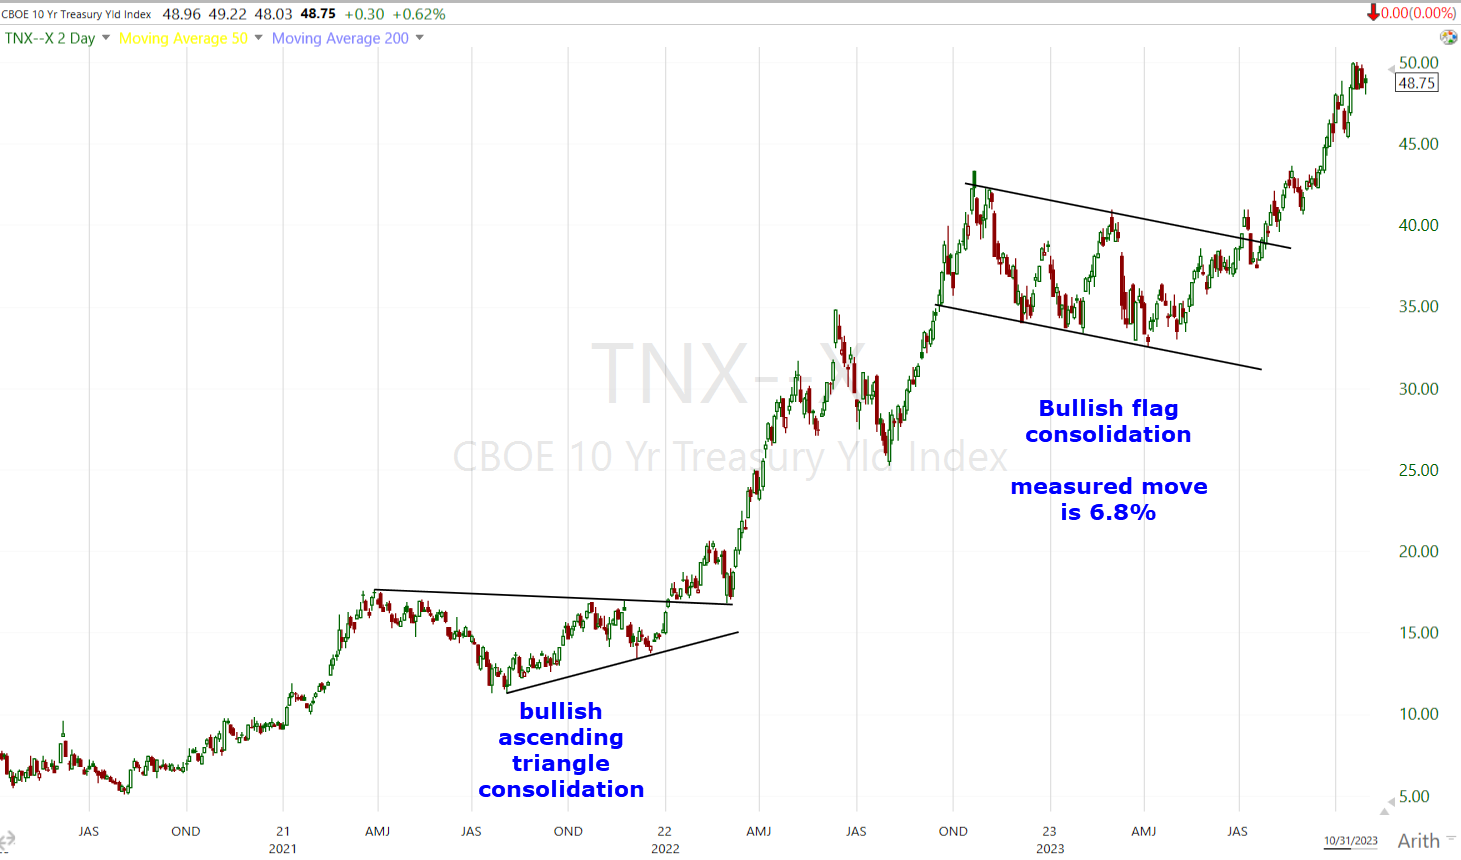 10-year yield (2-day) – Again, the bullish ascending triangle to the left should look familiar, although this one was huge, leading to a huge advance in long term yields before a huge bull flag. That bull flag has a measured move of around 6.7% to 6.8%. You may recall that the next morning after I posted this analysis, JPMorgan Chase CEO, Jamie Dimon echoed similar sentiment and said he didn’t think the world (or the market, I can’t recall) was ready for 7% long term yields.
Nothing on any of these charts changes the probability that long term yields are headed higher, to levels I doubt the economy can withstand. with today being the end of month, real 10-year yields rose for the 6th month of the last 7 to their highest since Lehman Brothers collapsed and the Great Financial Crisis began(Oct 2008).
Currencies and Commodities
The U.S. Dollar Index gained +0.6%, which makes the equity market’s resilience today surprising. The Dollar rallied for the 3rd straight month to its highest monthly close since November 2022.
We can’t move on from currencies without mentioning USD/JPY as it was a big part of today’s Dollar strength and may have implications for the equity market. USD/JPY was up 1.7%, in response to the BOJ decision.
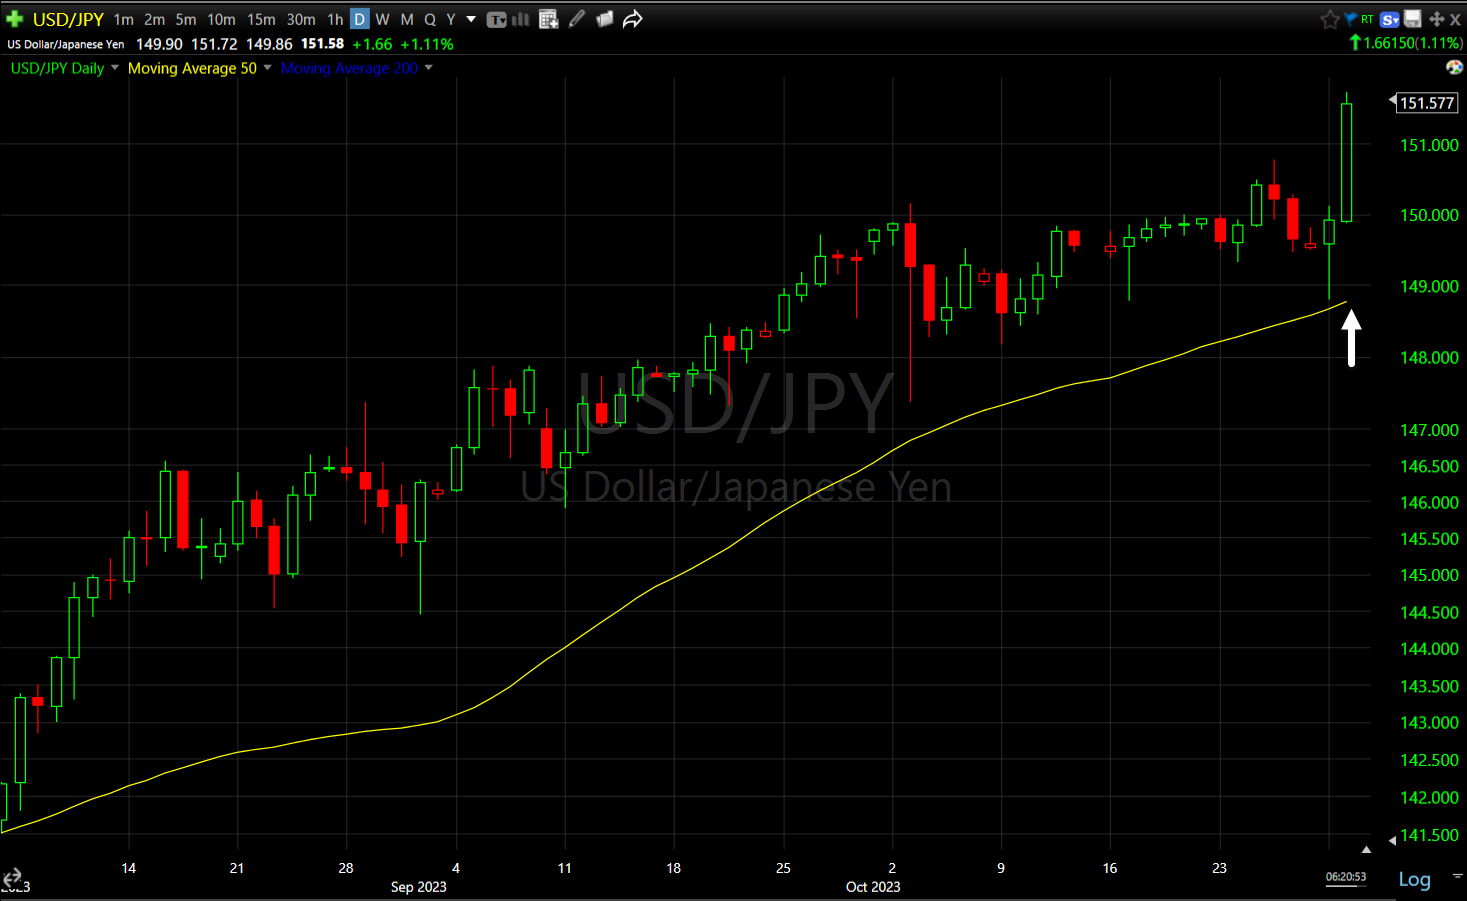 USD/JPY (daily) soared (weaker JPY vs USD) after the Bank of Japan adjusted its Yield Curve Control (YCC).
The Bank of Japan announced it will now use the 1.00% level in the 10-yr JGB as a refence point rather than a limit, while making no headline changes to its policy stance. The policy move has been viewed as less hawkish than feared, which has tempered some concerns about an unwinding of carry trades. In recent weeks I’ve seen a lot of traders, including investment banks, expecting the Yen to jump and encouraging long Yen positions, so I suspect some of today’s jump was those positions being caught off sides and closed at a loss. The Yen is at its weakest since its spike in October of 2022. The decline from that peak correlates with the start of the U.S. equity rally from October of 2022. So this recent Yen strength does pose a downside risk to equities.
The Yen is not my main concern for the market, but there is a loose correlation (tighter vs. the Dollar inversely).
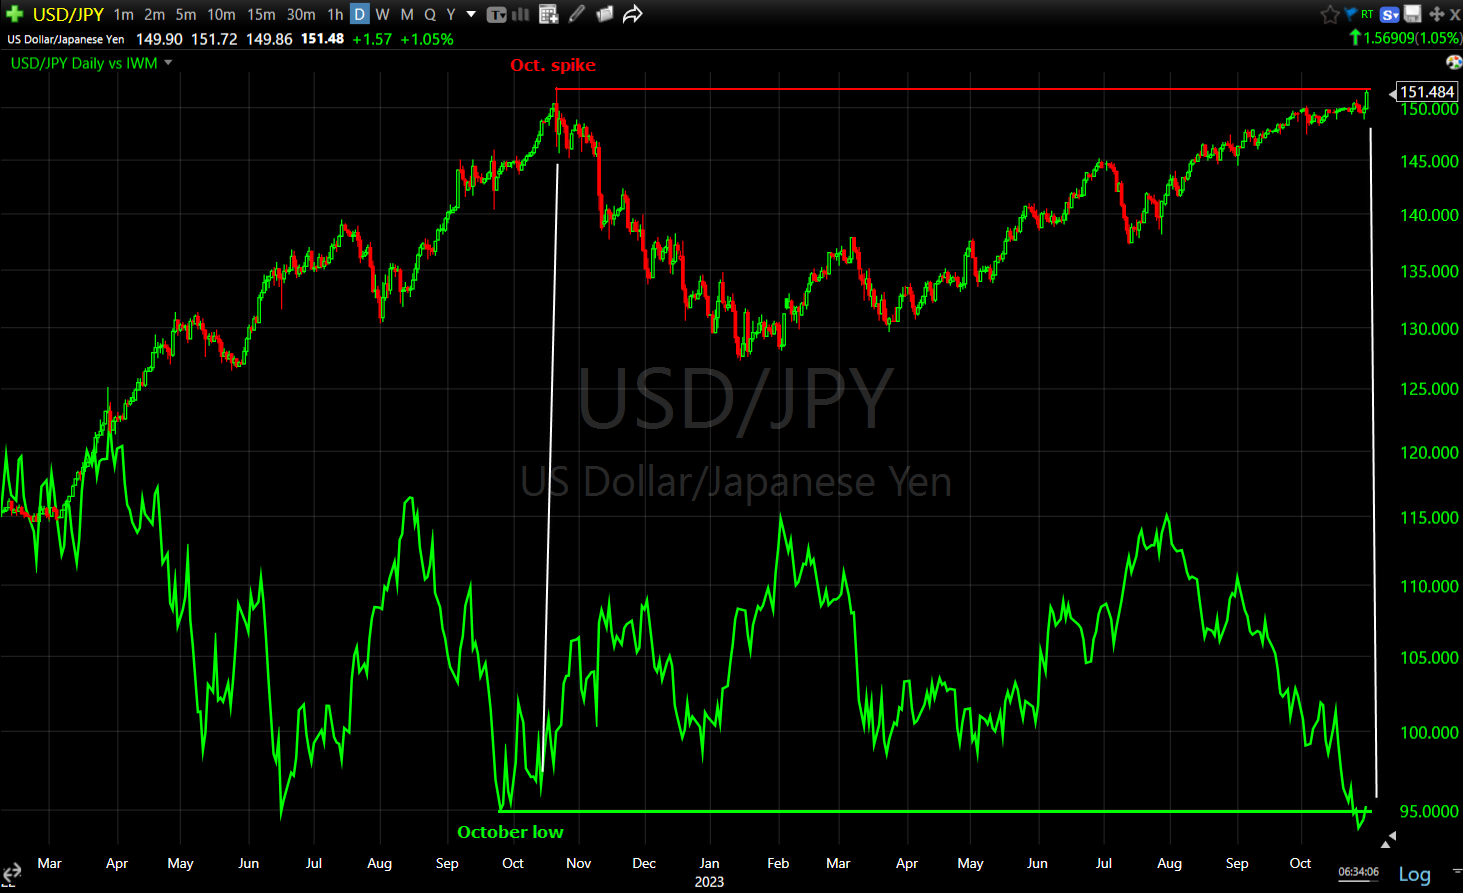
USD/JPY (daily) and Small Cap IWM (green). I’m using small Caps because they and the Dow were the first to put in the strongest bases in October of 2022 as USD/JPY peaked and rolled over. Notice that as USD/JPY is at the same levels as October 2022, Small Caps are near the same level as October 2022. Further losses in the Yen/gains in the USD are a downside risk to equities.
WTI crude oil futures fell -1.7% to $80.87/bbl.
Oddly, Crude Oil has not acted well considering the geopolitical risk. True that Iran has not closed or threatened to close the Strait of Hormuz, but still, oil has not been acting well considering the geopolitical risk.
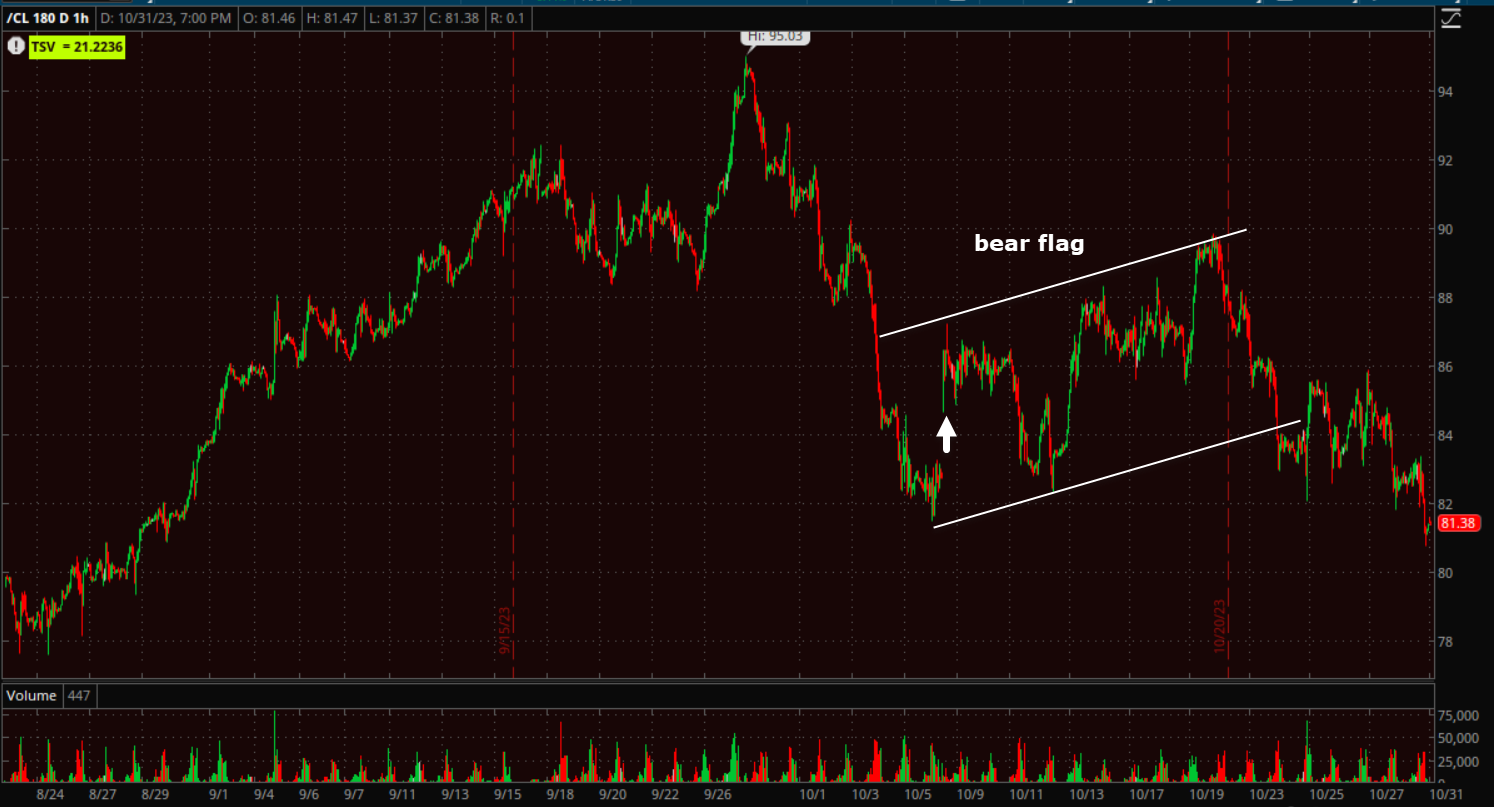 WTI Crude Oil (60m) – The white arrow is the risk-premium bid as futures opened Sunday night, the weekend of Hama’s attack inside Israel. Since then… A bear flag, and it’s broken down and erased all gains since the attack. This is one of the most puzzling charts considering the conflict in the middle east. All things considered, I think this is saying something bad for the economy.
While oil hasn’t acted well, Natural Gas gained over 23% on the month – its biggest monthly gain since July 2022. And that brings us to UNG, which gained +7.9% today, and on heavy volume (constructive).
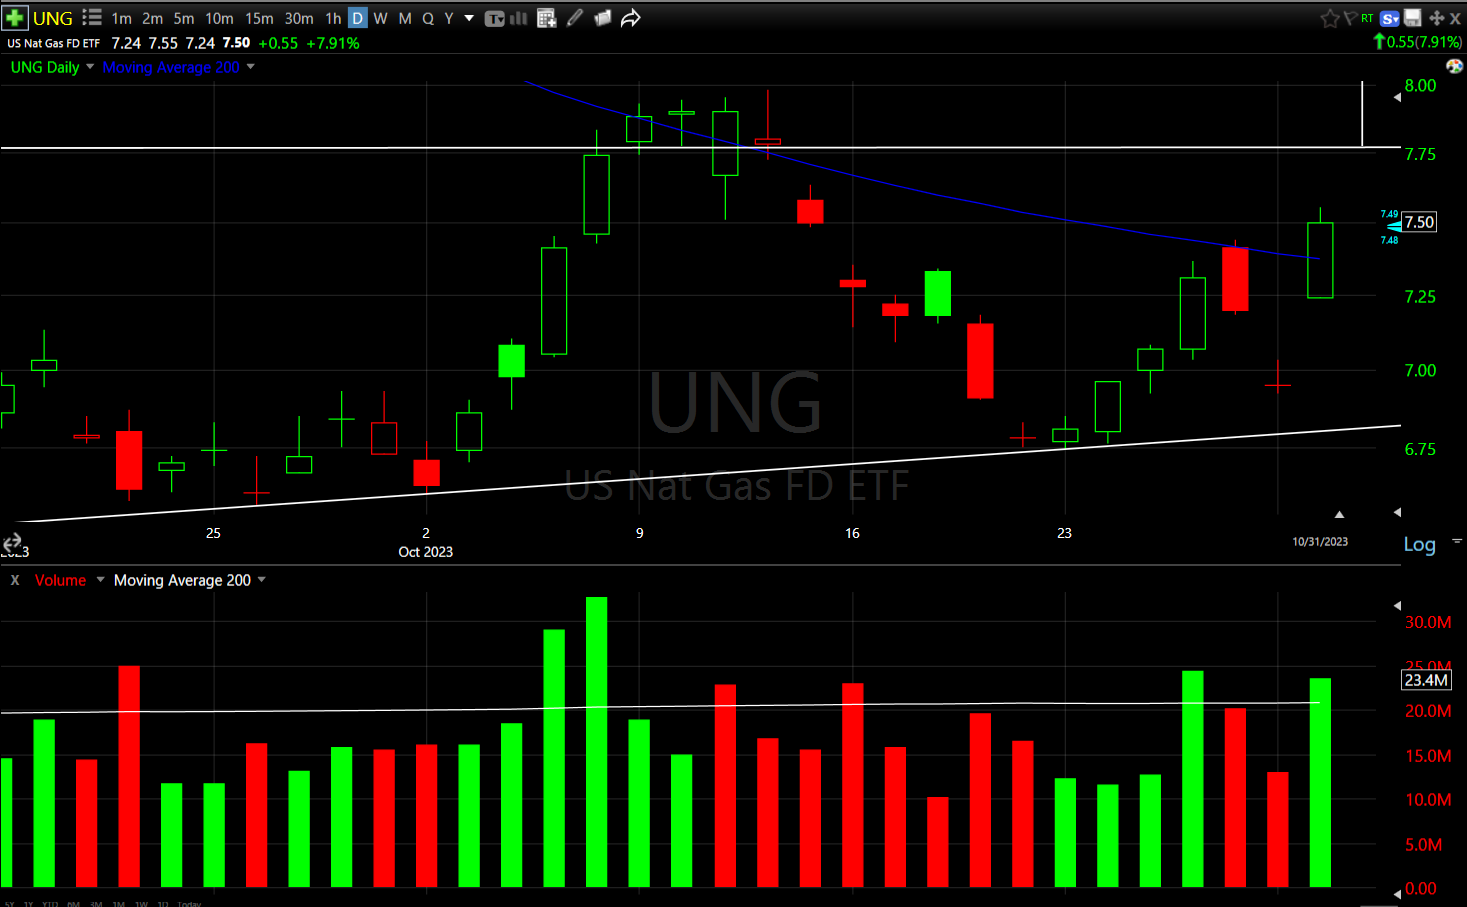 UNG (daily) – And it broke out above the 200-day sma that’s been acting as technical resistance!
UNG’s 3C chart tracking the larger trend of the ascending triangle base, has also been quite constructive and improving as the base matures and comes to an apex.
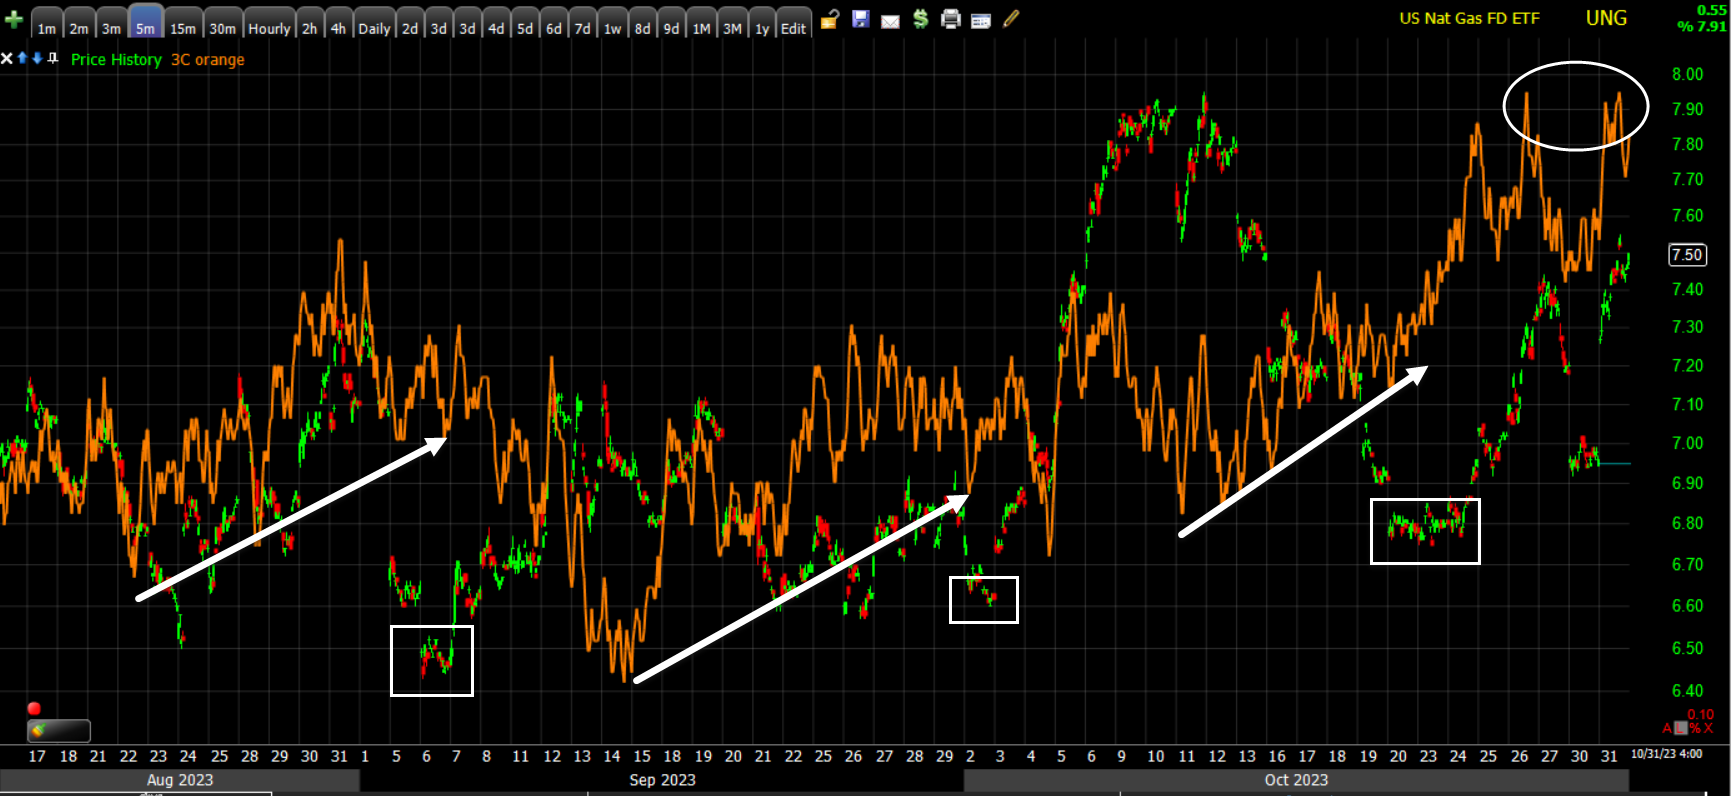 UNG (5m) with positive 3C divergences every time price came down to the lower support trend line of the base, and is at its highest level since the base began (leading positive).
And the other ETF on our radar, URA (Uranium) gained +4.9%, coming off its 50-day sma and breaking out of a bullish triangle today on heavier volume.
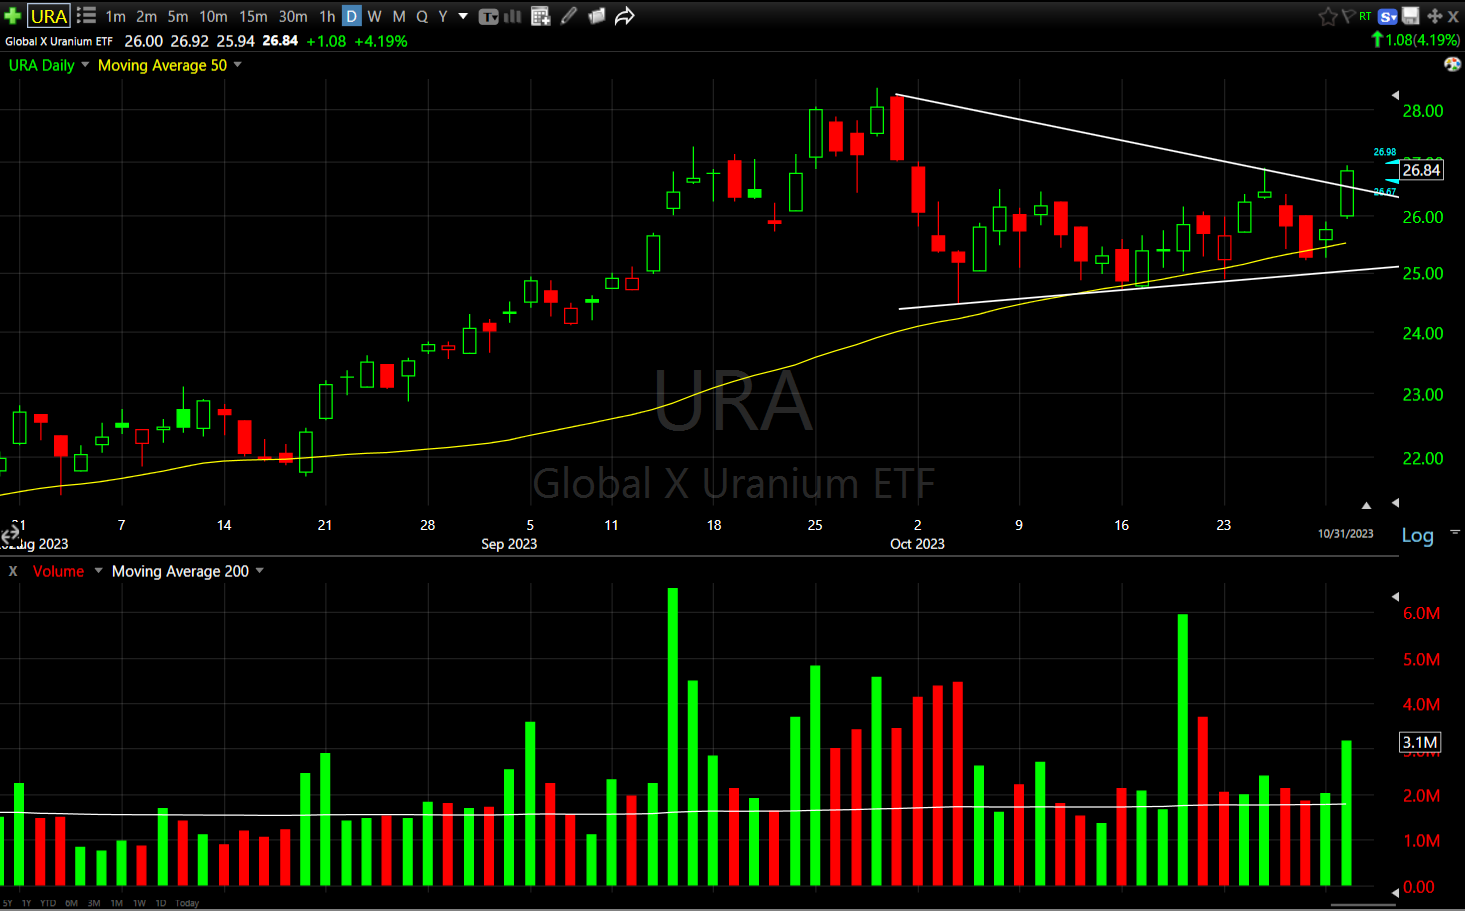 URA (daily) with its 50-day (yellow). URA has a nice positive short term (1m) 3C divergence as it tested its 50-day and found buyers there.
From a longer term perspective, URA is coming out of a huge consolidation.
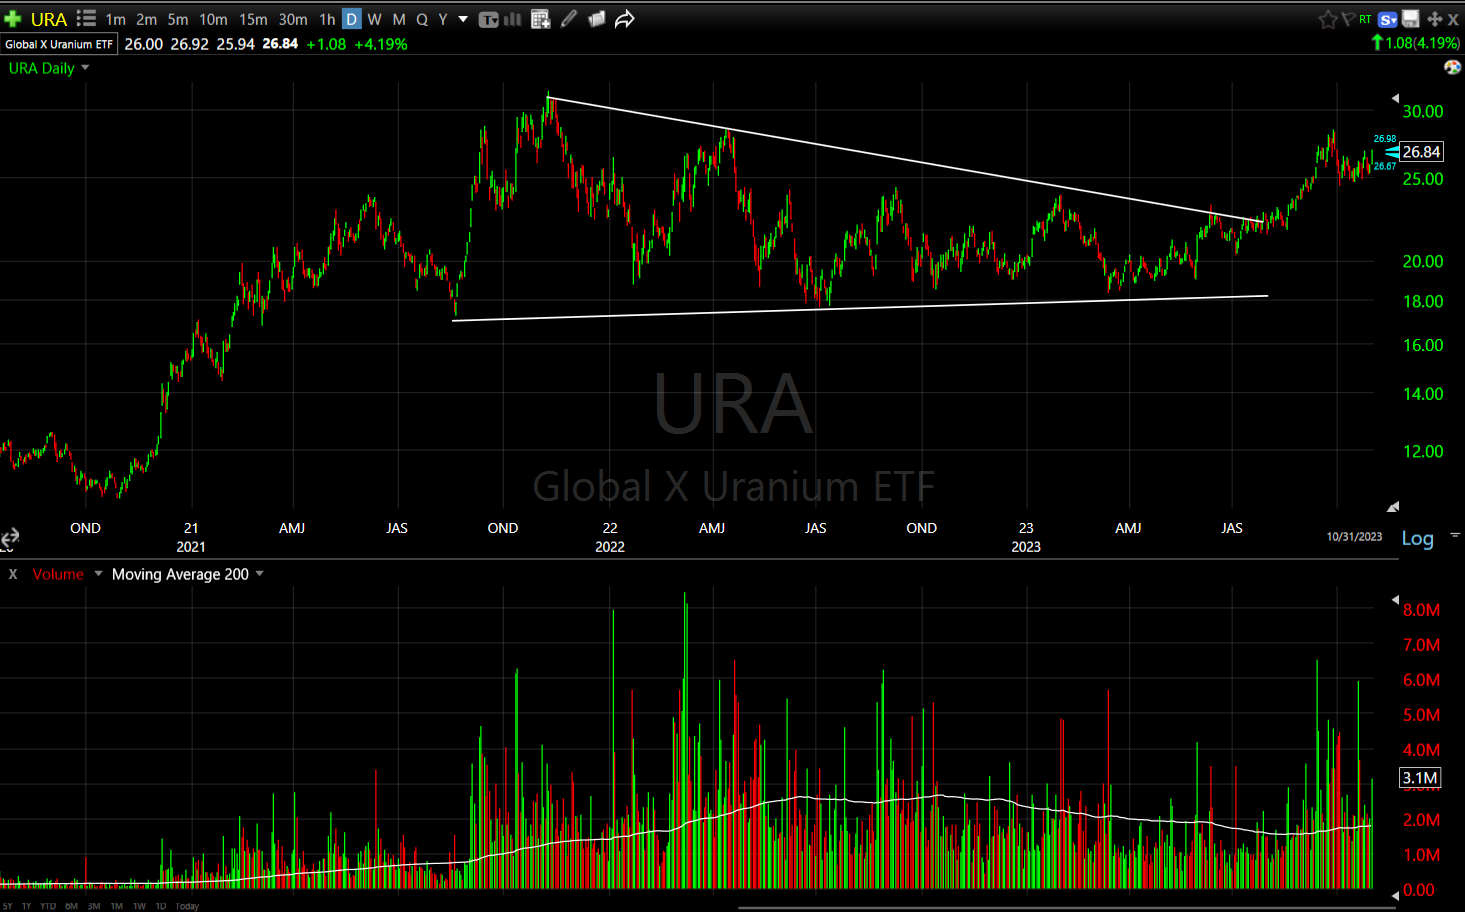 URA (daily) – The advance preceding the large consolidation was +200%. This is not a “normal” consolidation being nearly 2 years in duration, but price action has a strong fractal tendency. The volume during the consolidation (declining) looks as it should for a bullish consolidation. The breakout from the consolidation is on heavy and rising volume, again, it looks exactly as it should for a bullish pattern. Could URA have a 200% measured move from the breakout of this consolidation? It could.
I initially designed and coded 3C for daily charts, but over the years I’ve found short term timeframes to be more useful and more informative in forecasting the market, however, looking at the daily timeframe for a consolidation of this size in URA is appropriate and what I find is a VERY constructive 3C chart…
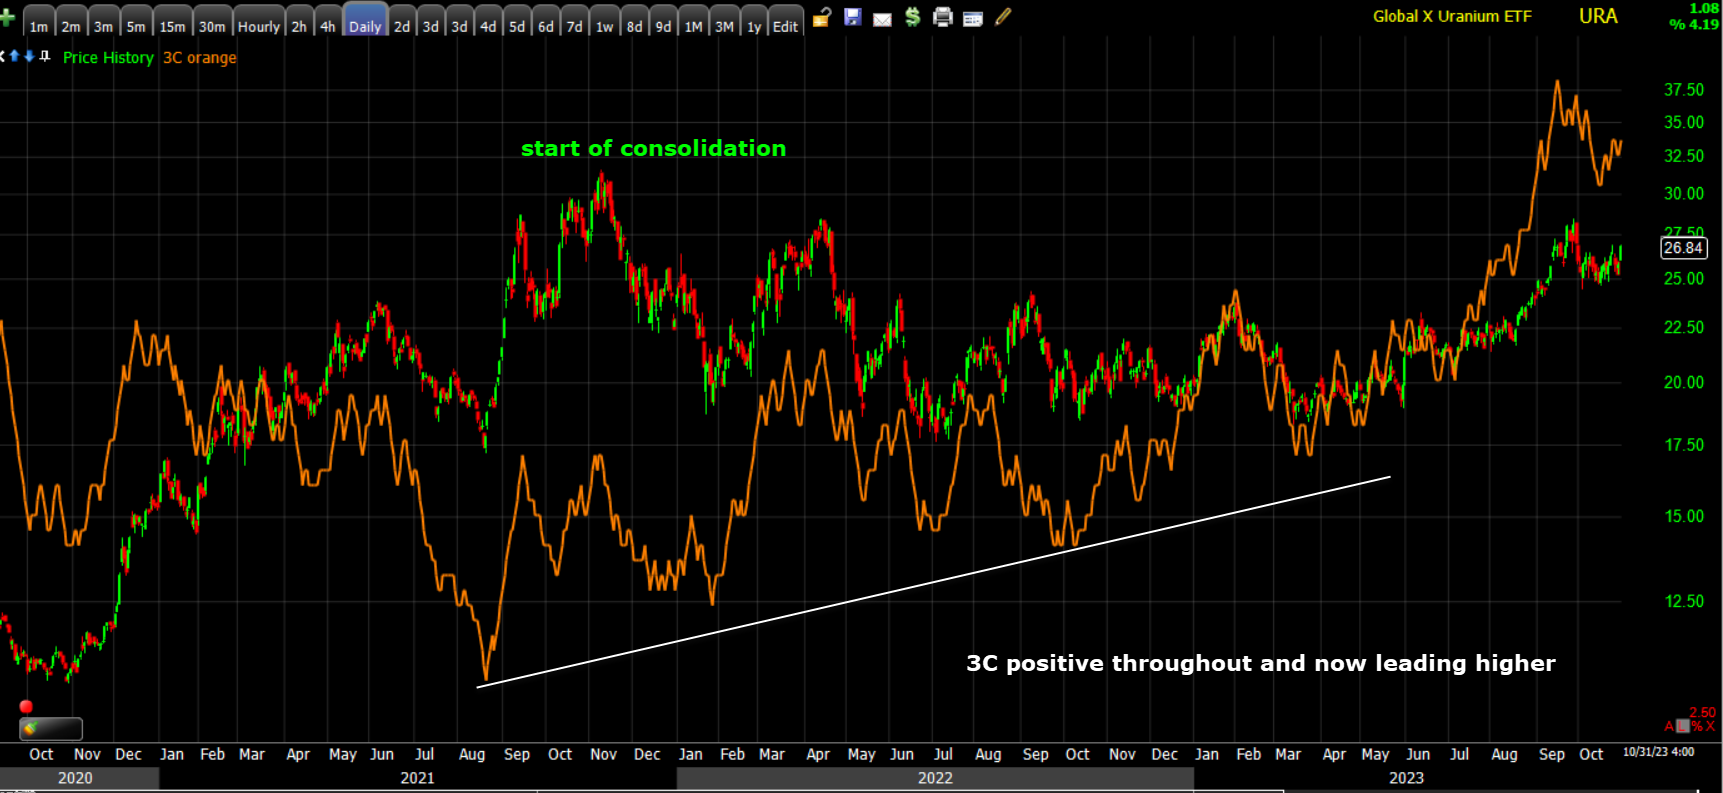 URA (daily) 3C acts perfectly and bullishly during this large consolidation, and as price breaks out, it’s leading higher.
Gold futures lost -0.6% and $2,000, closing at $1,994.30/oz, dropping off their morning highs quickly as the Dollar and yields gained. Gold posted gains of +6.9% in October, pushing YTD gains to +9.2%.
In a vacuum with no other considerations, I do like how gold has been trading. It’s breakout above $2,000 Friday on a flight to safety trade ahead of weekend uncertainty could have been stronger. However, Gold is not trading in a vacuum, or immune to other market forces such as rising yields and rising real yields, and a rising Dollar. There is risk of a downside move for gold, reverting down to its inverse correlation with the Dollar and yields that it has held to fairly faithfully – more so than index futures.
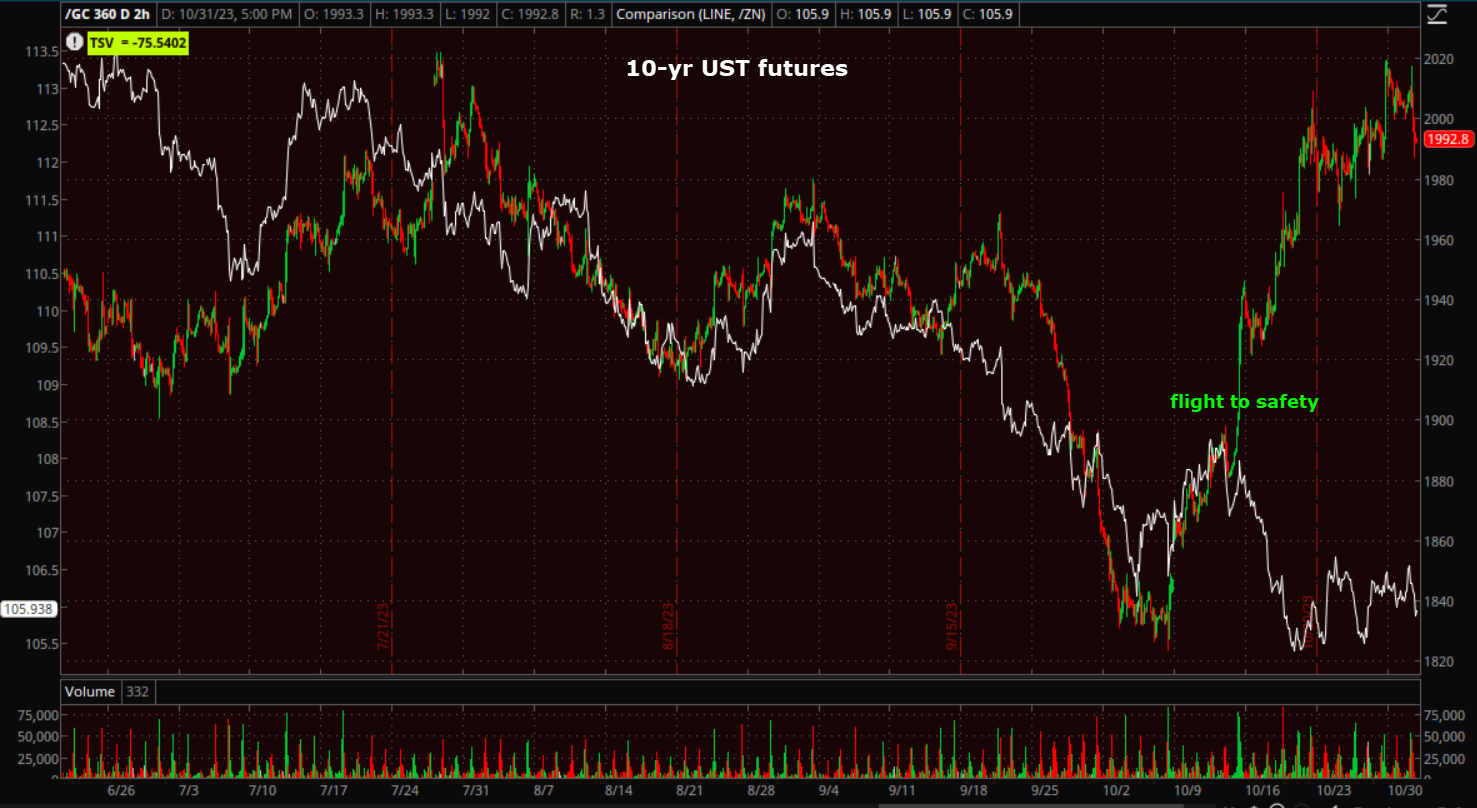 Gold futures and 10-year Treasury futures (2H) – The massive Israel/Hamas war flight to safety puts gold probably $20o above its correlation with yields. This flight to safety was responsible for gold futures’ best month since July 2020.
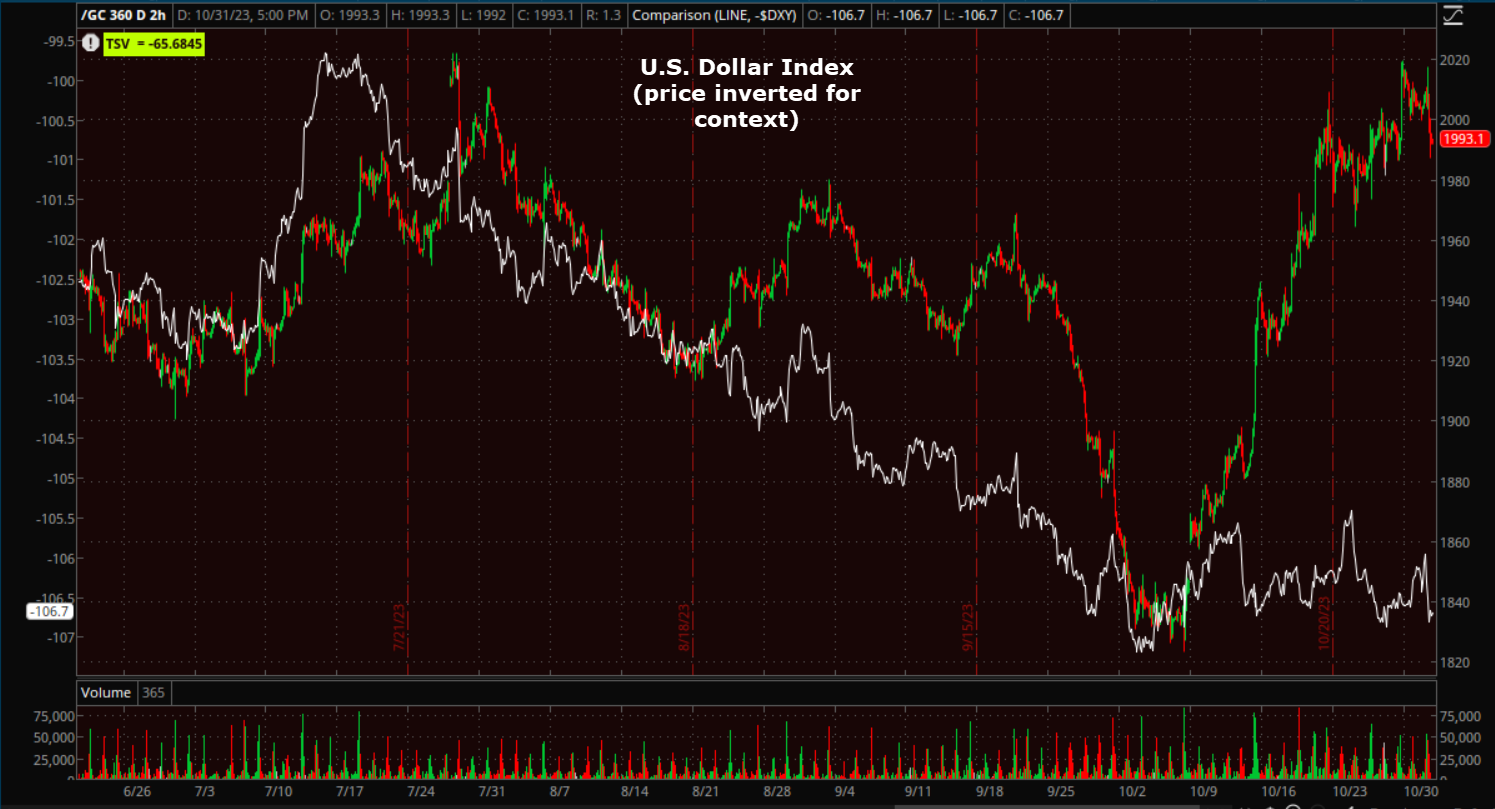 And the same is true for its correlation with the U.S. Dollar Index (inverted here for context) on a 2 hour price chart. This is a fairly large risk for gold with probably something like $200 of downside risk ($1800 area). If uncertainty stays high with regard to the Israel/Hamas war and the risk of a broader regional conflict remains intact or increases, gold should hold a safe-haven bid, but should the war not prove to be anything bigger than what it is, or come to a reasonably swift conclusion, gold faces significant downside risk. If I had a large “long gold” position [because price has acted very well since the flight to safety bid] I’d definitely give serious thought to hedging downside risk, maybe with some out of the money puts ($1800?).
I haven’t covered Bitcoin in a few days. It’s still consolidating (bullishly) in an ascending triangle just below $35,000.
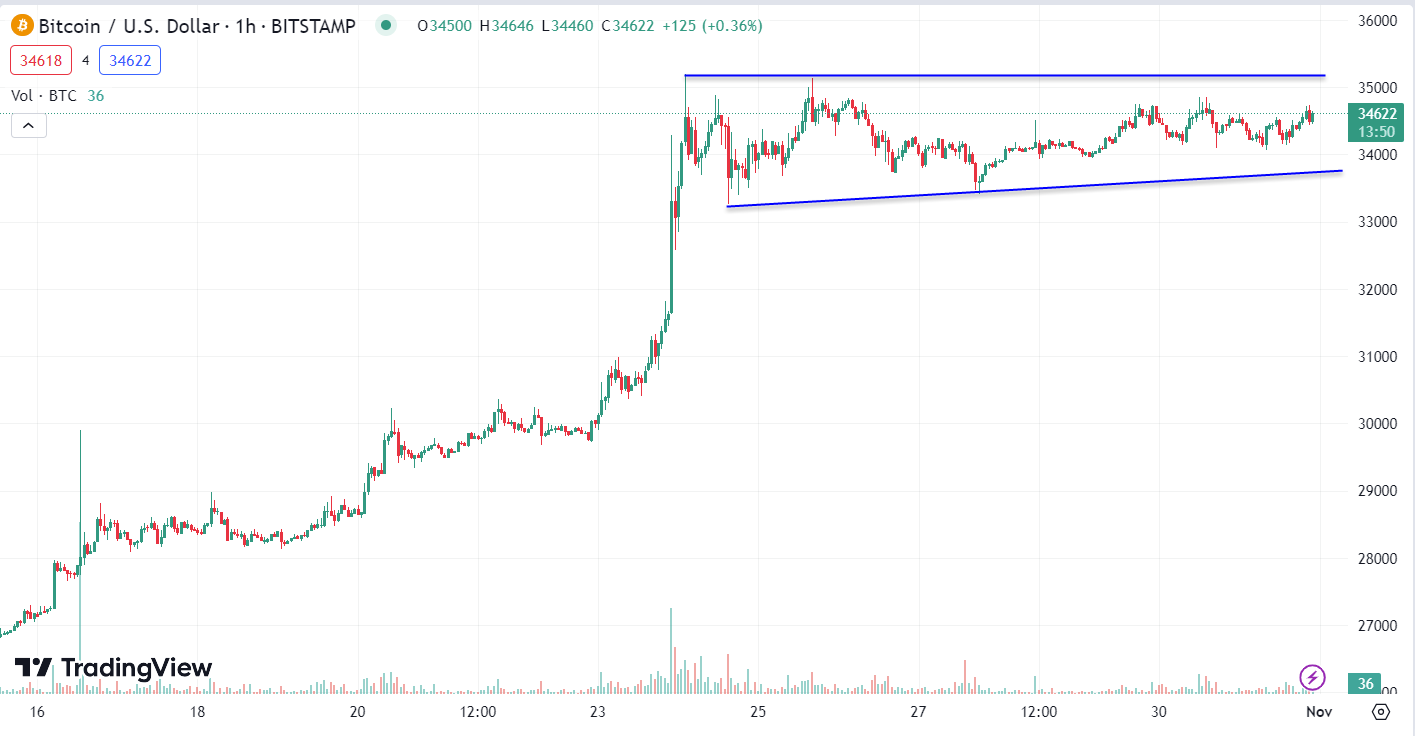 BTC/USD (60m) – just had its best month since January 2023, pushing a above $35,000 for the first time since May 2022 before entering this consolidation just under $35k.
As I’ve mentioned numerous times, Bitcoin’s gains appear to me to be another flight to safety trade…
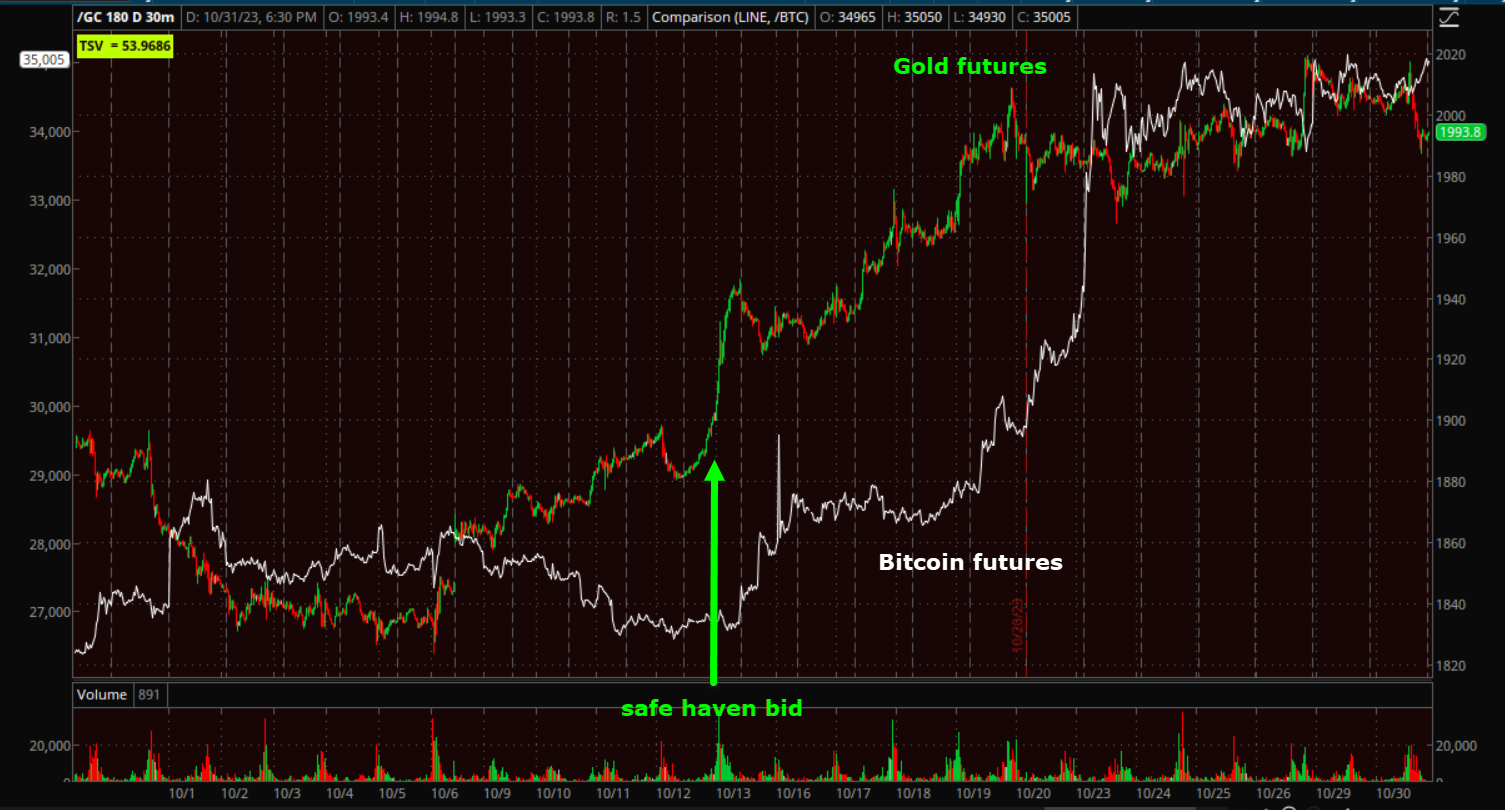 Here we can see gold futures were bid first as Hamas attacked Israel over the weekend, and Gold was bid as soon as futures opened that Sunday night. Bitcoin started catching a similar safe haven bid and is even in a similar consolidation area at a similar key level ($2000 for gold/$35,000 for Bitcoin). While Bitcoin doesn’t seem to have as tight of a correlation with yields and the dollar, it does do much better in loose monetary policy environments, and since the Fed has been hiking and reducing their balance sheet, Bitcoin suffered in a tight monetary policy environment. I suspect there’s similar downside risk for BTC for the same reasons as gold, if the flight to safety trade is unwound.
Summary
In short, I think the averages are probably close to a more durable low in which they an put in a larger consolidation, a decent dead-cat bounce, or perhaps even an end of year rally, but I don’t expect any of that to change the fact that the rally from October 2022 has topped and turned and we’re headed for lower prices over the next 6 months to a year. And I do not think we’re there yet.
The market will be looking ahead to the remainder of this week’s market-moving events. Those events include the FOMC decision tomorrow, followed by Apple’s earnings reports and the Bank of England’s policy decision on Thursday.
Overnight
S&P futures are down -0.3%. Small Cap Russell 2000 futures are down -0.4%.
The U.S. Dollar Index is only up +0.1%, but has a very bullish consolidation tonight suggesting higher prices coming (a headwind for stocks).
WTI Crude Oil futures are down up +0.2%, but have a bearish consolidation tonight of today’s losses and don’t look good heading in to tomorrow.
Gold futures are down -0.3% to $1988.90/oz.
Bitcoin futures are up +0.25%.
The 2-year yield is up +1 b, but the 10-yr yield is up +5 bp, which explains the weakness in index futures tonight.
Wednesday’s economic calendar features:
- 7:00 ET: Weekly MBA Mortgage Index (prior -1.0%)
- 8:15 ET: October ADP Employment Change (prior 89K)
- 9:45 ET: Final October S&P Global US Manufacturing PMI (prior 49.8)
- 10:00 ET: September Construction Spending (prior 0.5%), October ISM Manufacturing Index (prior 49.0), and September job openings (prior 9.610 mln)
- 10:30 ET: Weekly crude oil inventories (prior +1.37 mln)
- 14:00 ET: November FOMC Rate Decision (prior 5.25-5.50%)