After Tuesday’s gap down open I outlined 2 probabilities and two expectations that are a big part of listening to and confirming the message of the market.
“Gaps love to be filled. It’s a rare situations in which they are not filled, resulting at times in a breakaway gap. I think there’s a high probability this gap gets filled.”
“Assuming price’s trajectory remains similar [bear flag] (although the consolidation itself will almost certainly widen out), the averages could fill the gap by Friday morning’s Payrolls report.”
First, most of the averages filled Tuesday’s gap down at the open. Second, was the way price got there, which I forecasted as a high probability of a bear flag Tuesday afternoon. It’s not just the destination that’s important, but the journey, or price how gets there.
Both expectations and questions were answered today. Most of the averages filled the gap from Tuesday’s open, which fulfills the “destination” aspect and timing (before tomorrow morning’s Payrolls). It looked very much like we would see a bearish flag consolidation as the path, however this morning’s strong open cast that assessment in doubt.
The day started with all major averages higher and all 11 S&P sectors higher. Most averages, with the exception of the DJIA, broke apart with a stronger open and invalidated the 2-day bear flag this morning. Given a few hours of patience, however, things cleared up and the path to the destination ended up being uglier than I anticipated. See the Dow Jones Industrial Averages’ price chart below.
EVERYHING changed this afternoon with all major averages and all 11 S&P sectors ending in the red after another afternoon of heavy selling in equities.
Being aware of price (and volume) trends is a prerequisite of successful speculation. Being aware of the market’s tone is “next-level” analysis.. a subtle, but powerful skill that most investors will never appreciate or even recognize beyond a trend line or moving average. Today was a great example of this, and the virtue of patience. What looked one way this morning, looked completely different a few hours later given a little patience to let things develop. With days like today you can really understand how inexperienced traders/investors lose money chasing prices, rather than being aware of the market’s tone and having a little patience for the trend’s tone to reassert itself, and wisely choose your battles – in every way a successful planner can — when to be extra vigilante, when and where to take action, and when to sit on the sidelines as the battles you don’t fight can be more important to your success than the battles you do fight.
While yesterday was the highlight of this week’s heavy calendar of Fed speakers with Powell center stage, today featured a cornucopia of Fed-speakers including the Fed’s: Barr, Kashkari, Kugler, Harker, Barkin, Goolsbee, and Mester. The orchestra of Fed speakers were all reading from the same sheet music as every other Fed speaker this week. The takeaway from today’s speakers was…
- Inflation is still “too high”
- Likely appropriate to lower rates later this year
- Fed needs more time to gain clarity before lowering rates due to the recent reflation.
- Ongoing concerns related to banks’ exposure to Commercial Real Estate (CRE)
- And the power of Fed forward guidance and staying on top of the narrative, which is currently that reflation is not a major concern for the Fed amid a strong jobs market.
A newer Fed concern at odds with forward guidance was voiced by the Fed’s Goolsbee, noting that it’s “worth staying attuned to detioration in the Jobs market.”
I don’t think Goolsbee’s concern was voiced over this morning’s moderately higher than expected Initial Jobless Claims, but rather the Fed’s awareness that the Federal Government (Bureau of Labor Statistics, or BLS) is cooking books with regard to Jobs data. Just this week the Philly Fed admitted that BLS overstated job gains by 800,000 for the period of June through September 2023. This has been an ongoing and increasingly more ludicrous trend out of the BLS since 2022, and increasingly divergent with just about every other metric of the labor market that isn’t from the BLS or DOL.
From the Philly Fed’s analysis…
“Our estimates incorporate more comprehensive, accurate job estimates released by the BLS as part of its Quarterly Census of Employment and Wages (QCEW) program to augment the sample data from the BLS’s CES that are issued monthly on a timely basis. All percentage change calculations are expressed as annualized rates.” -Philly Fed
“In the aggregate, 10,500 net new jobs were added during the period rather than the 1,121,500 jobs estimated by the sum of the states“ -Philly Fed
The Philly Fed study confirmed what I’ve pointed out just about every month when the Jobs report (and the subsequent revisions lower) is released along with subsequent revisions lower nearly every month, and in many cases, massively so.
The Philly Fed found that most states’ labor data would be revised lower, in many substantially so.
I’ll pick up and continue my thoughts on this theme in the Summary section below being we’ll get the key BLS Payrolls report tomorrow morning before the open (8:30 a.m. ET).
Averages
The stock market started the day in rally-mode, but finished the day with sharp losses. It’s pretty amazing to see every average down more than 1% after this morning’s stronger start. The Tech-heavy NASDQ-100 was the worst on the day, while Small Caps and the Dow are down over -3% on the week.
S&P-500 ⇩ -1.23 %
NASDAQ ⇩ -1.55 %
DOW JONES ⇩ -1.35 %
RUSSELL 2000 ⇩ -1.08 %
What started as a decent day for stocks — but nothing that was going to change anything — ended up being one of the ugliest days of intraday trade in recent memory.
At 8 a.m. ET this morning S&P futures were up +0.3% and set to continue the bear flag trajectory since Tuesday morning’s gap down low. The weaker than expected Initial jobless Claims report sent yields lower and got equity investors thinking that the data might move the needle and allow the Fed to cut rates sooner than later. Initial Claims produced further pre-market gains (from 8:30 a.m. ET) that caused most of the averages to gap up above the bear flag’s trend lines.
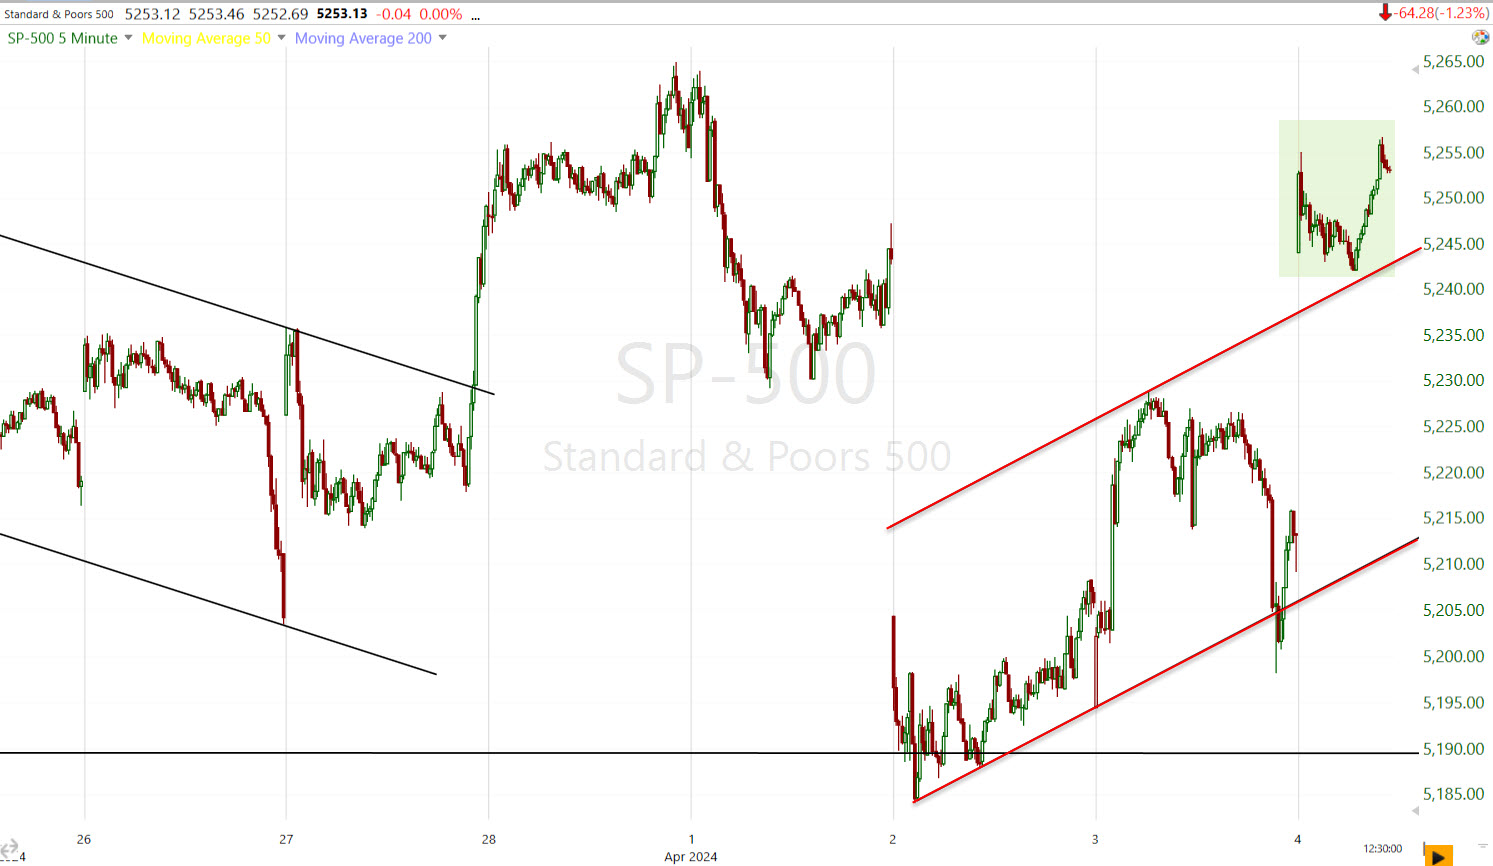 SPX (5m) as of 12:30 p.m. ET it looed like the bear flags would be invalidated.
Then the Fed’s Kashkari commented that the Fed may not cut rates at all this year if progress on inflation stalls, which contradicted the market’s “weak initial jobless claims = earlier rate cuts” narrative. Here’s what Kashkari said,
“In March I had jotted down two rate cuts this year if inflation continues to fall back towards our 2% target,”
“If we continue to see inflation moving sideways, then that would make me question whether we needed to do those rate cuts at all.” – Kashkari
The market sank quickly leaving something worse than just a bear flag.
The market went from every average green and all 11 S&P sectors green with advancers nearly 5-to-1 over decliners, to every average red and down at least -1% with all 11 S&P sectors red, and decliners edging out advancers.
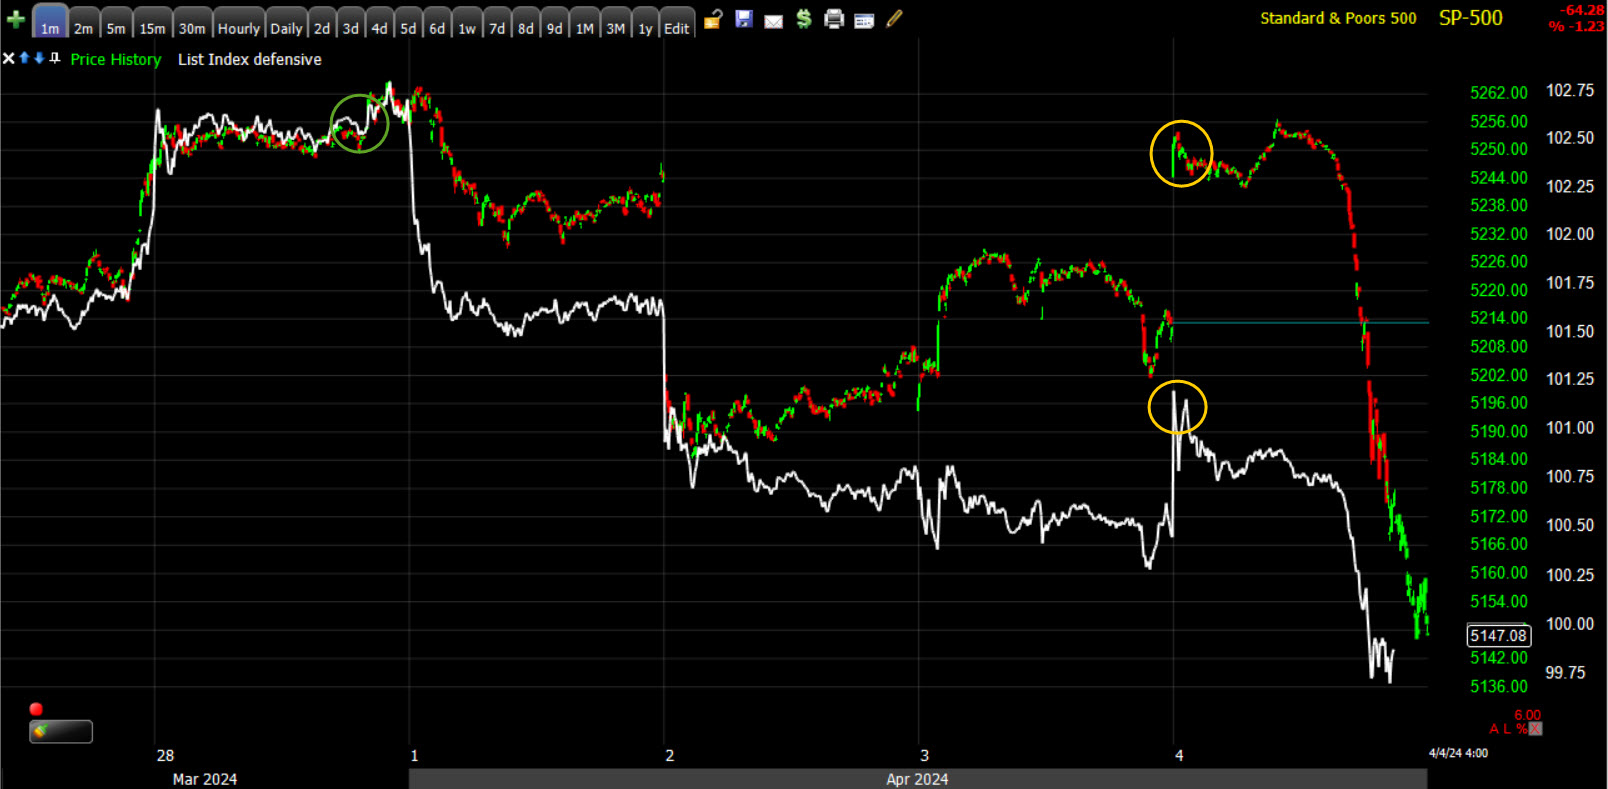
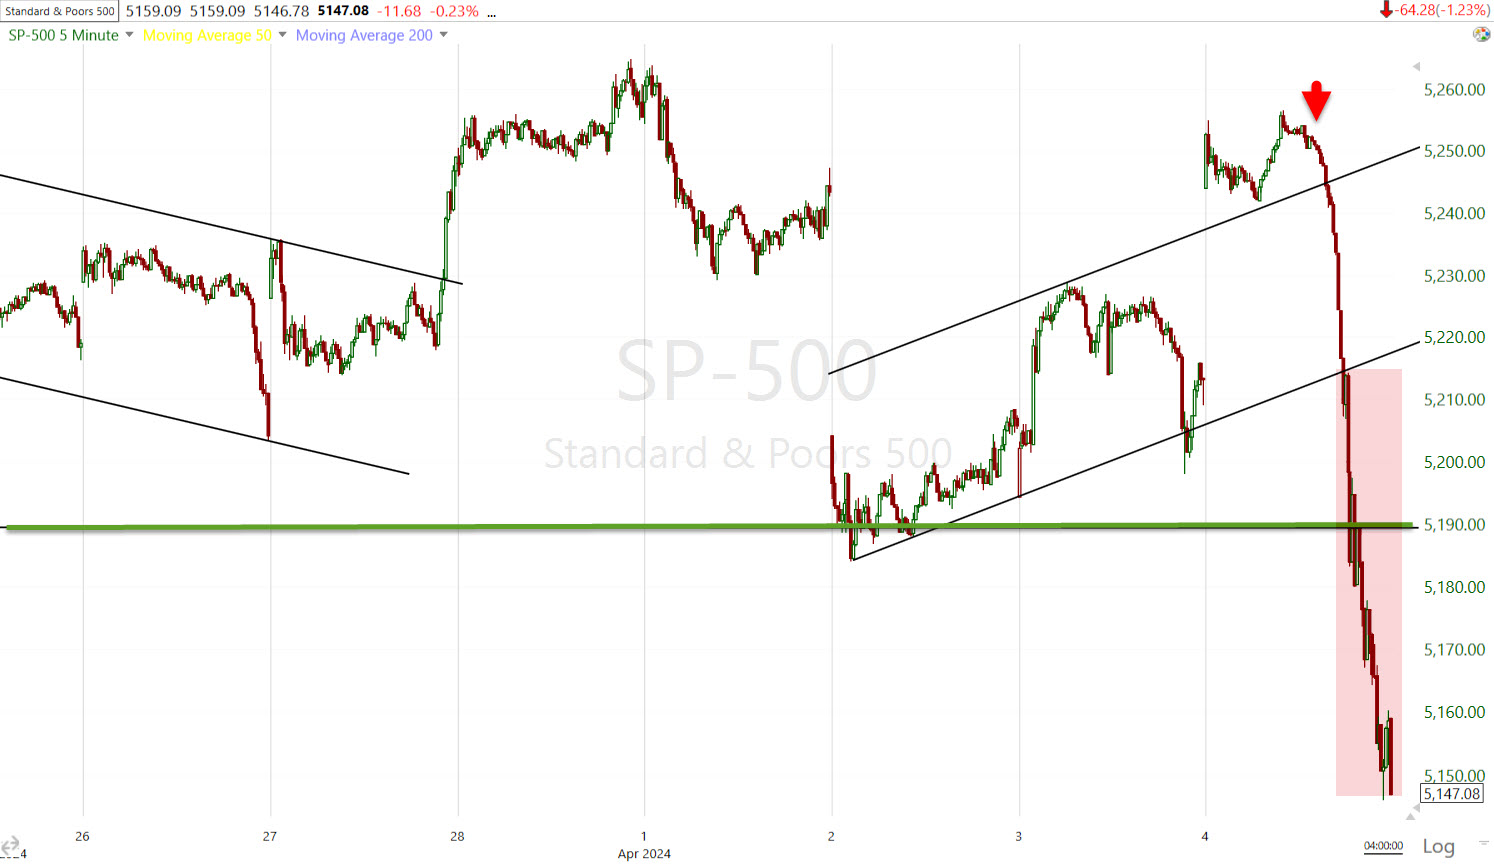 SPX (5m at the close). First, the SPX filled Tuesday’s gap at the open. Then, not only did price fall back into the bear flag, but broke below it, broke below local support which happened to coincided with SPX 2024 trend support at $5190-$5200, and closed at the low of the day.
Heck… The DJIA never left the bear flag this morning, and by the close had nearly completed a second leg down from the same bear flag.
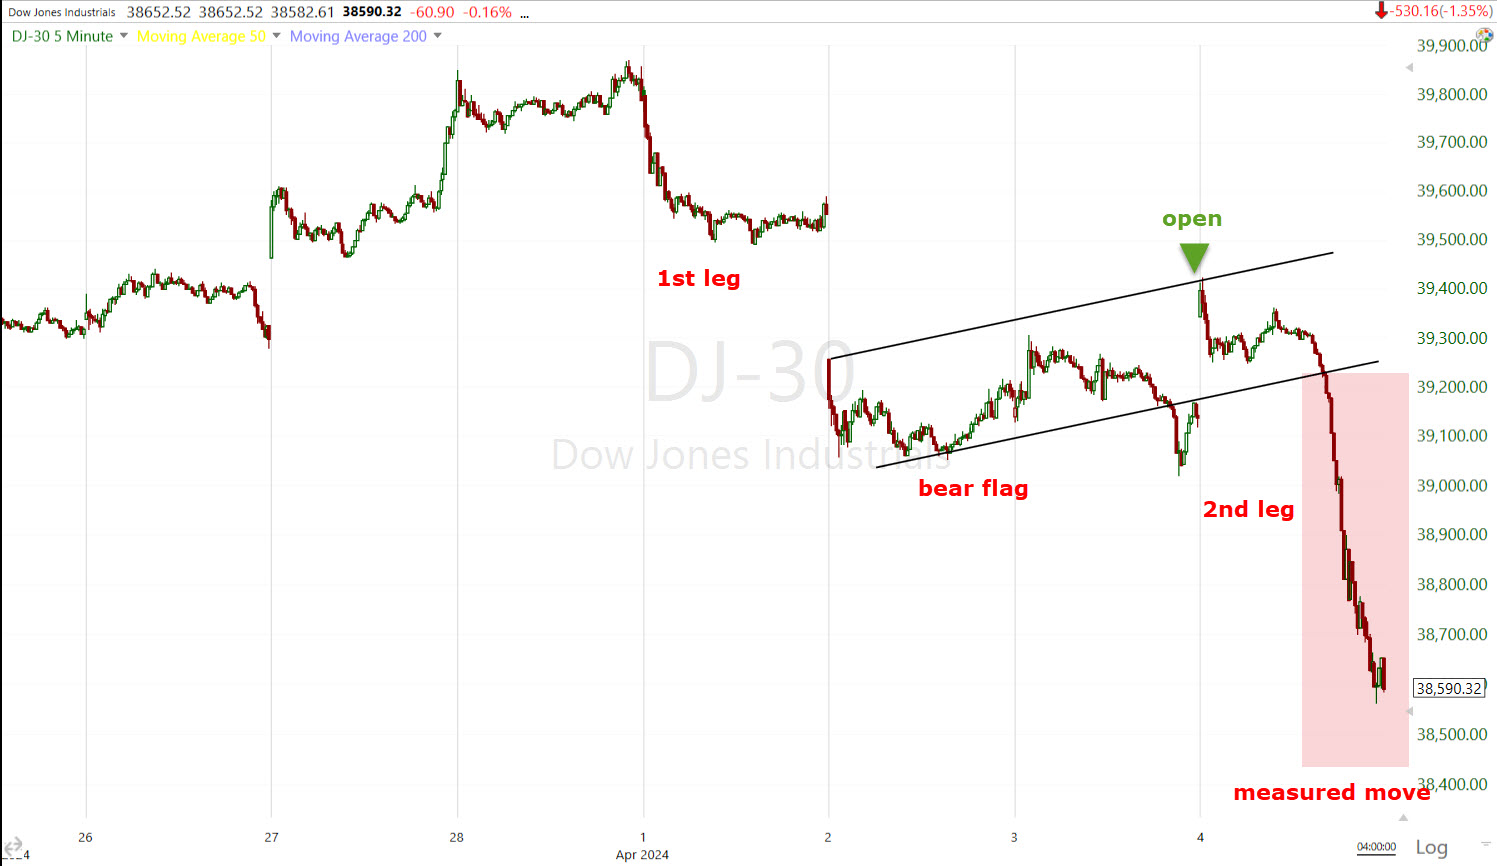
DJIA (5m) falling just shy of a second leg down measured move this afternoon.
While timing suggests that Kashkari was the catalyst for the selling, there was also a big surge in crude oil prices at the same time (more inflation)…
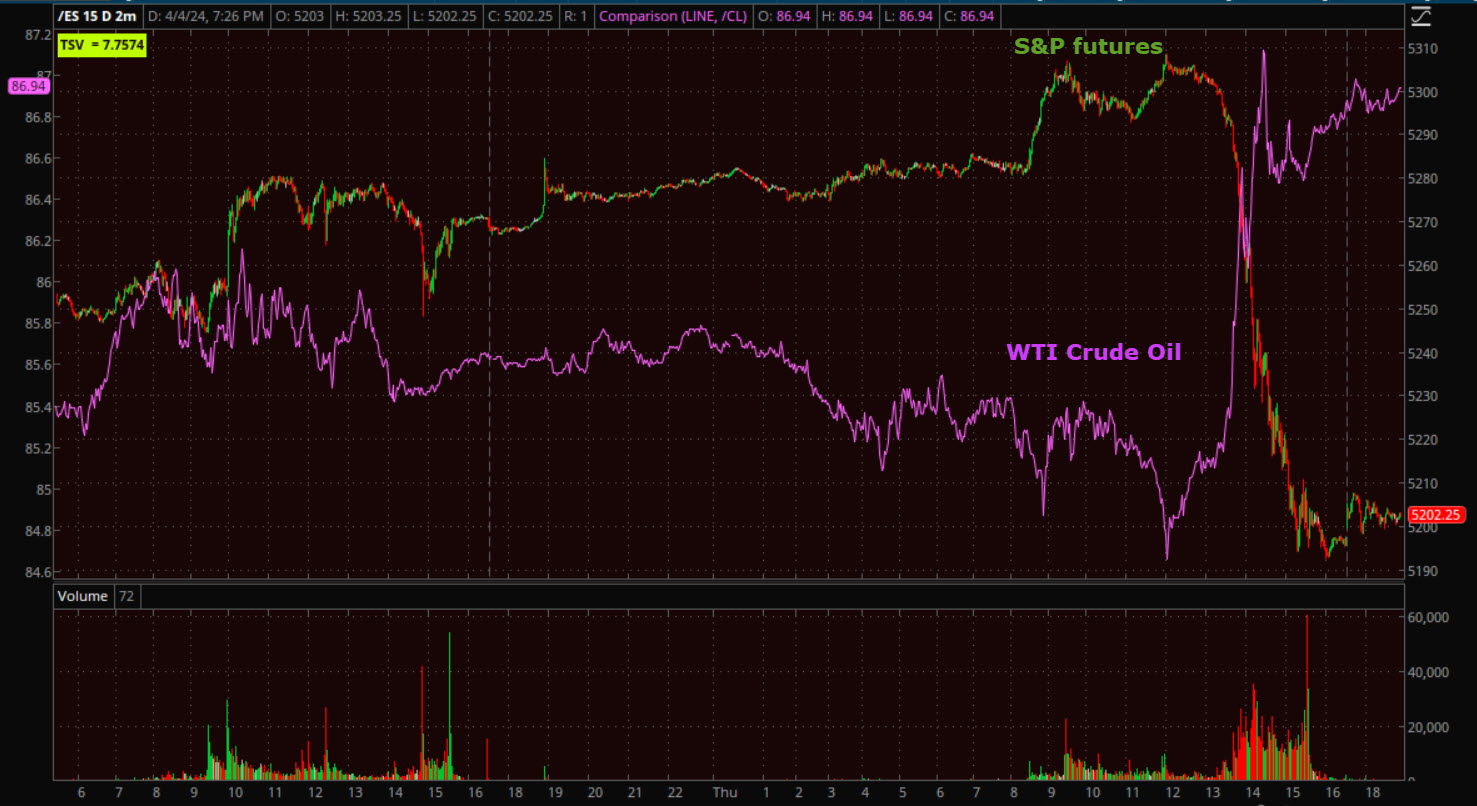 S&P futures (2m) and WTI Crude Oil futures – The sell-off in S&P futures also correlated with the rally in oil this afternoon. Note how heavy S&P futures sell-side volume was this afternoon!
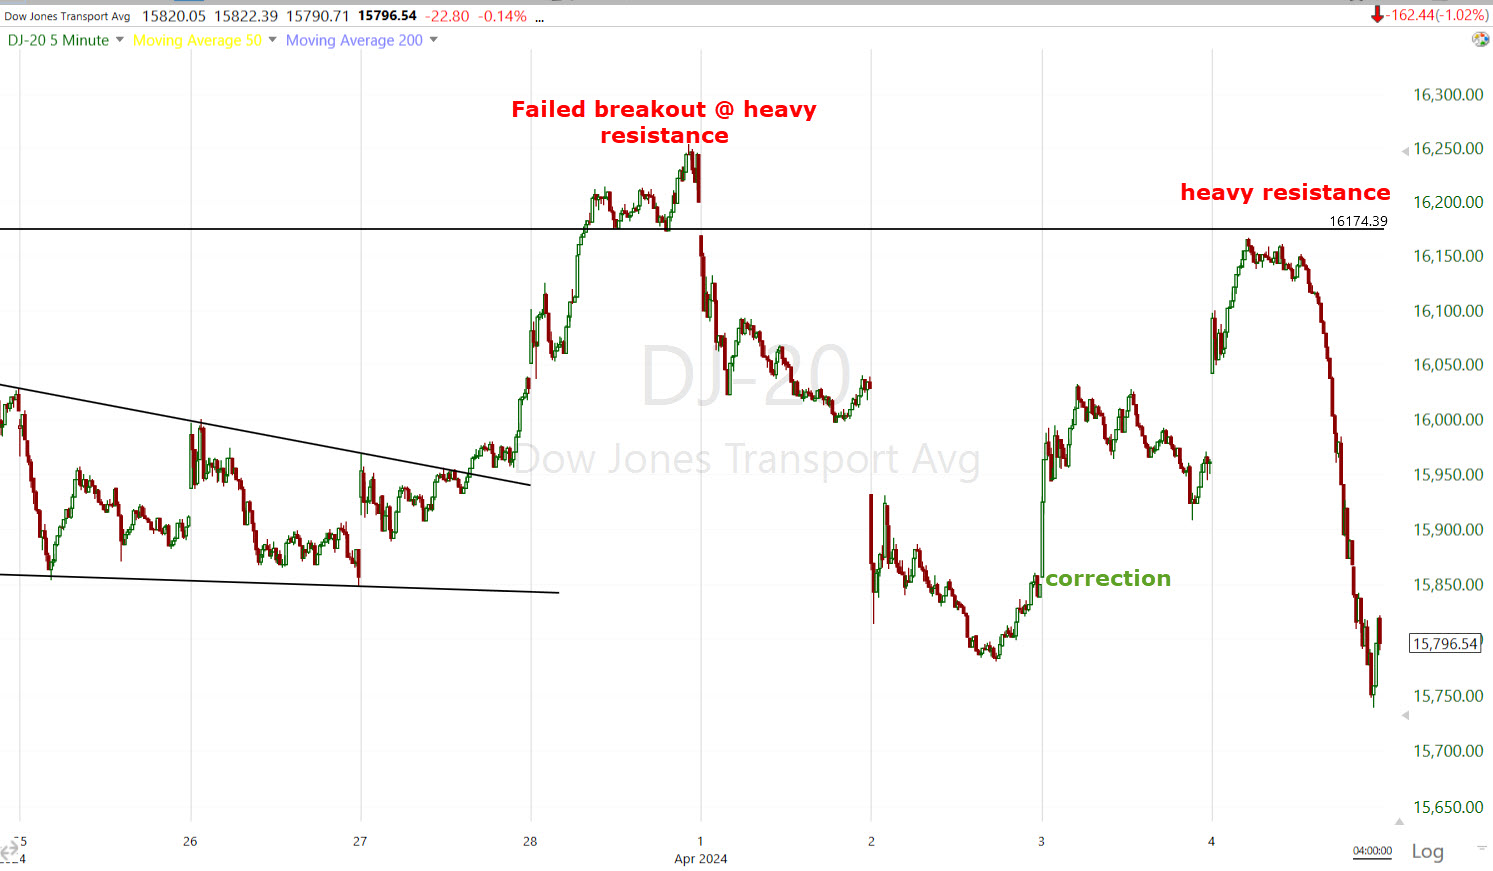 Dow Transports (5m) – The price chart and annotations say all that needs to be said.
As mentioned last night, SPX $5200 is a very interesting level….
“If the breakouts from bullish consolidations remain failed breakouts, even though they’re not that big, the consequences could be outsized for the S&P.
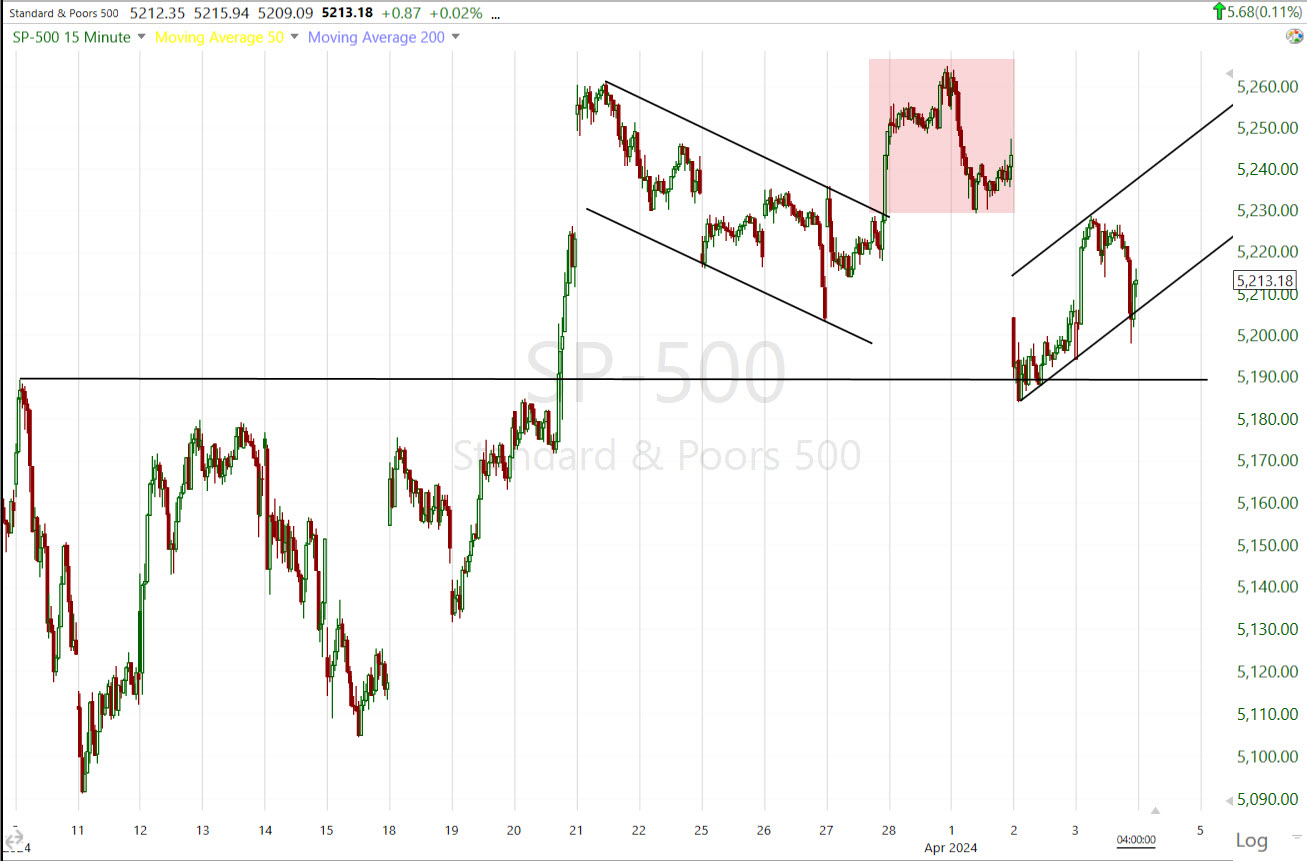 SPX (30m) – Thus far a failed breakout, at risk for a fast price reversal (down). You may notice the trend line just below $5200 where price found support Monday and started the apparent bear flag consolidations. If that “fast reversal” breaks below that trend line, and more specifically SPX $5200, we’ll have a break of the 2024 SPX up trend.
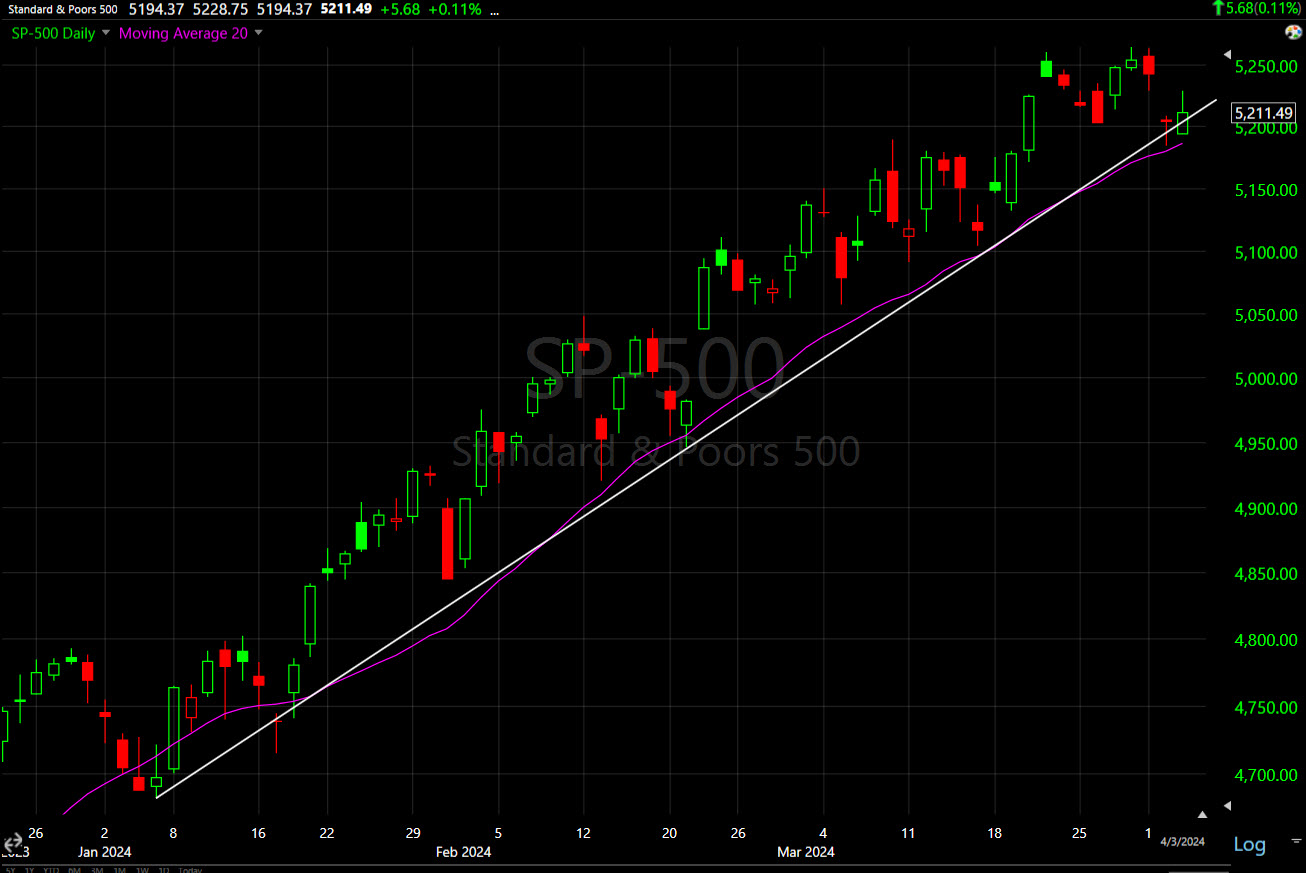 SPX (daily) with the 2024 up trend and 20-day moving average, both right around $5200 and the local support trend line on the chart above this one at $5190. Key leadership stocks of 2024 are already starting to break similar trends, like Nvidia. Trend followers like CTAs will take notice.”
The S&P 500 closed at $5147, breaking the intermediate trend line and 20-day SMA.
Here’s a different, longer term trend view of the SPX and $5200…
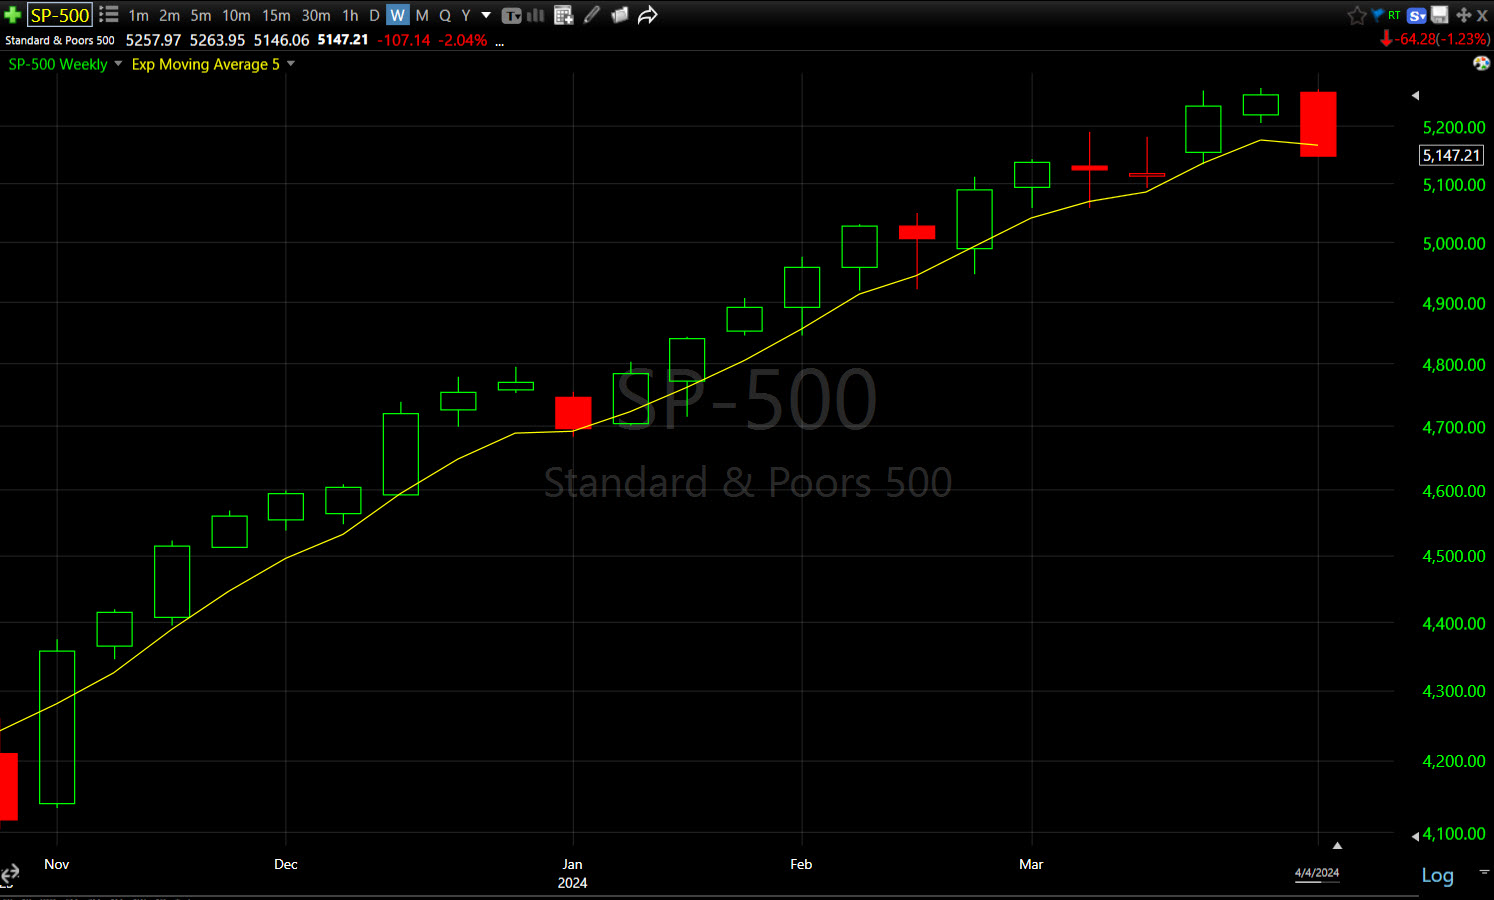 SPX (weekly) with a 5-week EMA (yellow). The S&P’s weekly candle is setting up to be a bearish engulfing candle with a break of $5200, and a close below the 5 week EMA for the first time since the rally began in late October.
Meanwhile, my forecast for a right hand turn to a lateral price trend with increasing price volatility as the lateral trend develops, is alive and well in the most important index of 2024, the NASDAQ-100.
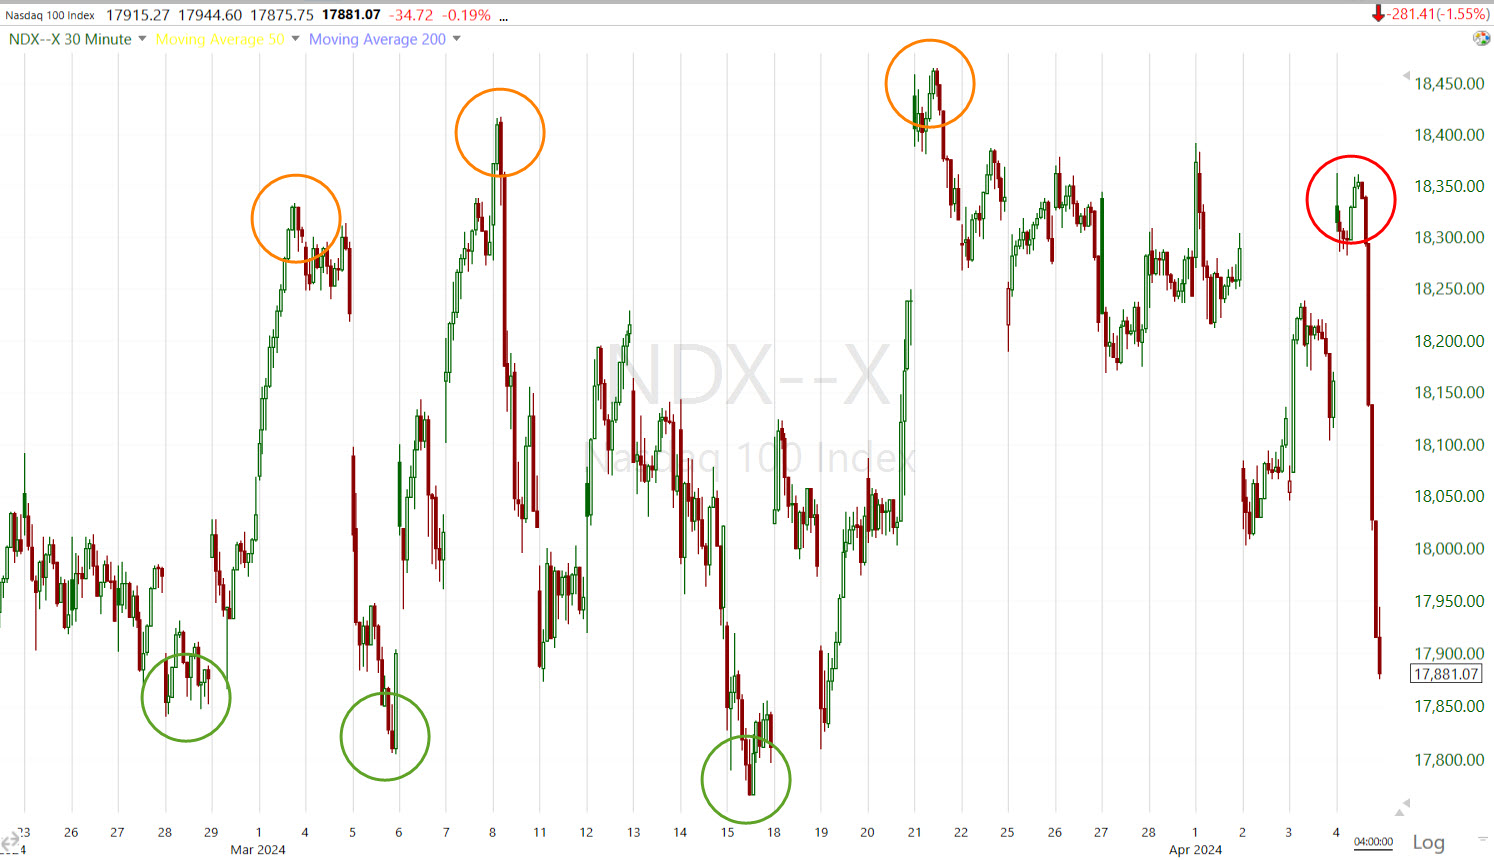 NDX (30m) – The price volatility aspect really picked up today, but over the last 6 weeks we have seen a lateral trend with increasing price volatility (slop) as price made higher highs (orange) and lower lows (green). The only difference now compared to the last 6 weeks is the increasing price volatility, but more importantly we have a recent bull flag failure (didn’t even attempt to breakout) and the first lower high of the lateral trend (red).
My Most Shorted Index ended the day lower, but the more insightful development was this morning. As noted in the Early Update,
“My Most Shorted Index is higher, but not keeping pace with the broader market, suggesting that recent shorts are more resilient.”
 SPX (1m) and MSI with the SPX filling Tuesday’s gap and trading at similar levels to Thursday/Monday, while the MSI barely budged higher at the open.
VIX started the day with some relative weakness, but relative strength over te last week. VIX went from being down more than -4% to cloing up +14.1%! Talk about volatility!
The Absolute Breadth Index ended at 24.
S&P sectors
In early morning trade all 11 S&P sectors were green. By the close all 11 S&P sectors ended red with six sectors losing more than -1%. The 3 mega-cap heavy sectors and the influentially weighted Heath Care sector were the worst performing, while the Energy and defensive Utilities sectors lost the least.
Even at the best market levels this morning Mega-Caps (MGK -1.4%) and Semiconductors (SOX -3%) displayed ZERO leadership. By the close mega-caps underperformed the benchmark and equal weighted S&P, and Semis were notably weak. The takeaway is that there’s still no sign of Q1’s leadership stocks extending their leadership into Q2.
To illustrate the point, the mega-caps went from a failure to breakout of a bullish flag consolidation, to an even worse failed breakout today.
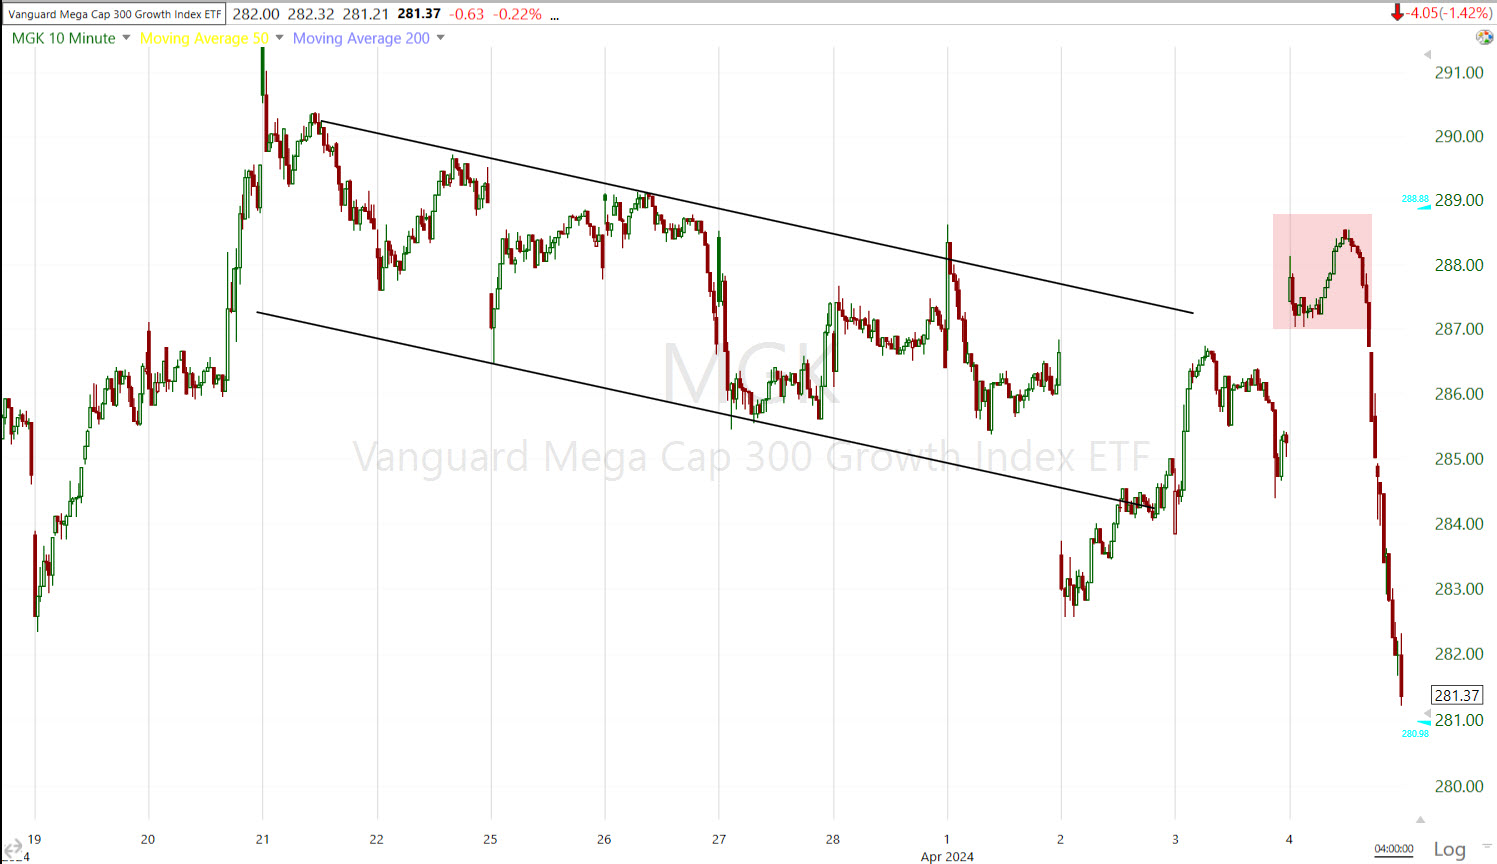 MGK (10m) with a failed breakout in just 1 day.
And the Semis…
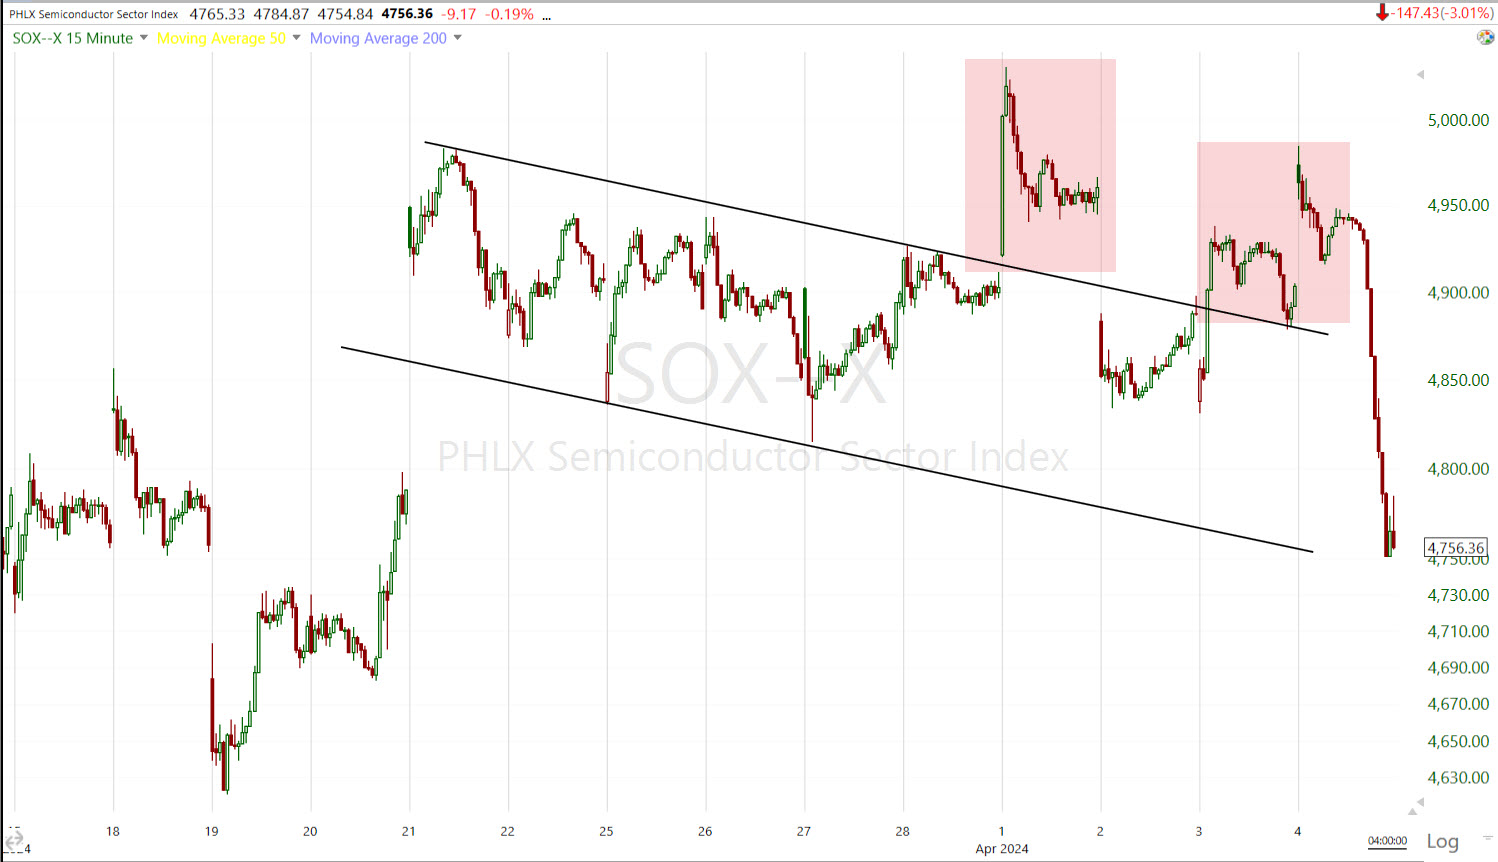 SOX (15m) isn’t quite a failed breakout from a bull flag yet, but we do have two attempts to breakout and both rebuffed by sellers.
Both developments in mega-caps and semis point to a failure of leadership in the stocks that drove 2024’s gains thus far.
The defensive, cyclical and value style factor leadership we saw hints of 2 or 3 days last week, have mostly vanished since. The only trace that remains is in the reflationary, commodity-linked cyclicals such as the Energy and Materials sectors.
Materials ⇩ -1.01 %
Energy ⇩ -0.06 %
Financials ⇩ -1.13 %
Industrial ⇩ -0.88 %
Technology ⇩ -1.58 %
Consumer Staples ⇩ -0.43 %
Utilities ⇩ -0.20 %
Health Care ⇩ -1.44 %
Consumer Discretionary ⇩ -1.17 %
Real Estate ⇩ -0.78 %
Communications ⇩ -1.35 %
The fact that some defense stocks like Lockheed Martin (LMT +1.4%) and RTX (RTX +1.8%) were winning standouts, suggests the market’s weakness in the face of rising oil and bond prices was more geopolitically related than Kashkari’s comments about possibly no rate cuts this year due to stalled progress on inflation.
Internals
This morning NYSE Advancers (945) had a near 5-to-1 lead over Decliners (1783). By the close, decliners edged out advancers. Volume was heavier today at 954 mln shares.
The Price/Volume Relationship was extremely Dominant at Close Down/Volume Up. The fact that decliners did not hold at least a 2-to-1 edge over advancers rules out 1-day oversold internals, but otherwise it would have been a strong 1-day oversold event. As it stands tonight, it’s just ugly, heavy selling that has some more room to go as there are no 1-day oversold internals.
Breadth Oscillators were a roller coaster today. First they relieved short-term oversold internals as the major averages filled Tuesday’s gap with an overbought print as high as 99 this morning, but finished lower at 56 with the afternoon selling.
Treasuries
The bond market was volatile today, reacting dovishly to Initial Claims this morning, and reacting defensively with a hint of recession worry to crude oil’s rise this afternoon. The 10-yr yield fell five basis points to 4.31% and the 2-yr yield declined four basis points to 4.64%. The up trend in yields for 2024 remains well intact.
Another interesting facet of today’s trade was that stocks sank this afternoon WITH bond yields, despite the inflationary jump in oil prices and the Fed’s Kashari’s hawkish comments. I have, and continue to forecast that at some point, the equity market’s strong inverse correlation with yields since March 2022 (inflation and rate hikes) will flip back to the historical norm of equity prices and bond yields having a more historically typical positive correlation. The inverse correlation since March of 2022 is an inflation dynamic. Stocks falling with yields is a recessionary dynamic, which seems to imply that this afternoon’s equity/rates positive correlation is proof of equity market fears of an oil-price induced recession with geopolitical concerns overlaid.
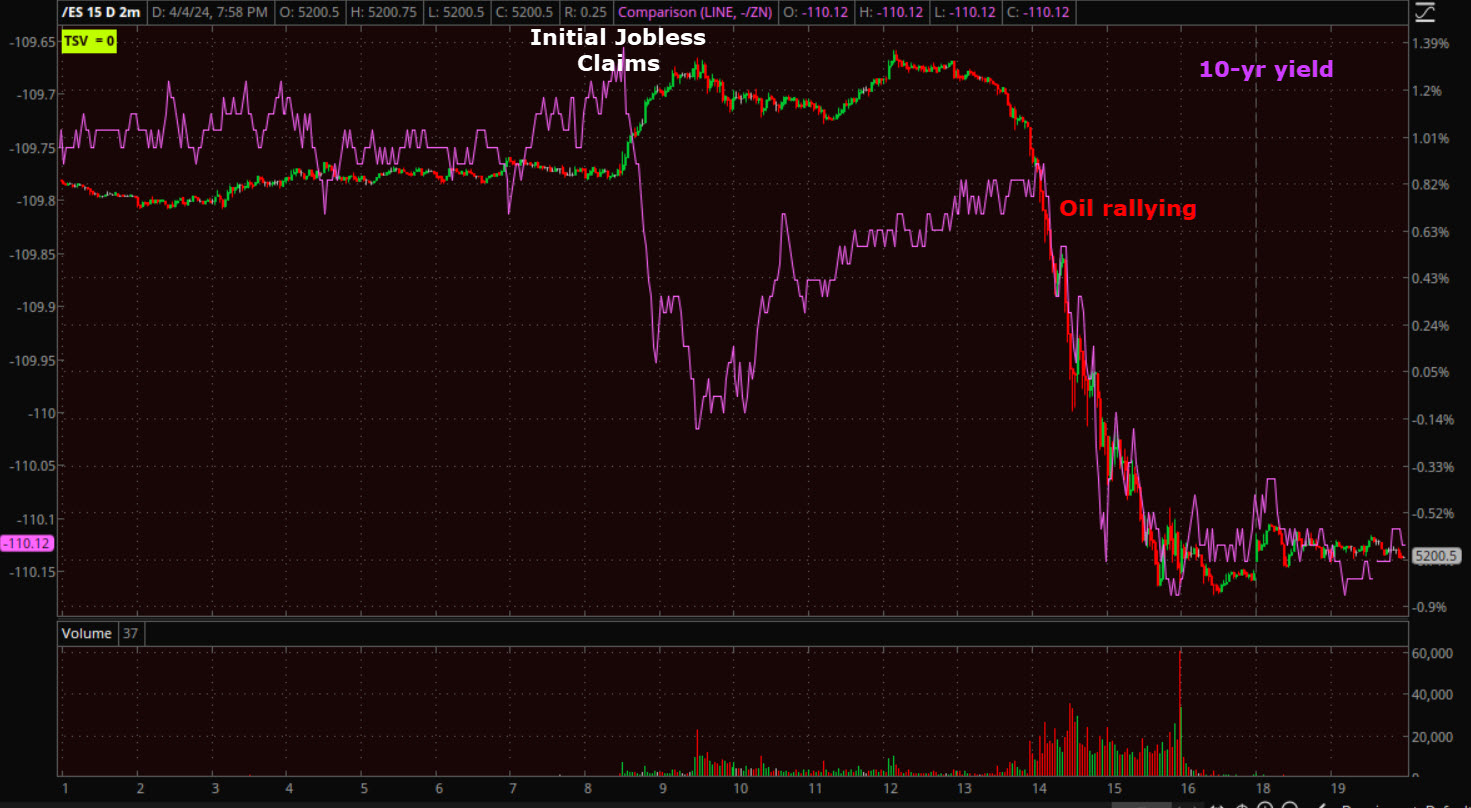 S&P futures (2m) and 10-yr yield (purple) – The equity/rates reaction to Initial Jobless Claims this morning is the “normal” inverse correlation that’s been dominant since March 2022 when the Fed started hiking rates. The positive correlation as both S&P and yields sank this afternoon as crude rallied (inflationary) is the more typical positive correlation reflecting economic growth expectations.
On the geopolitical front, the Biden administration realizes they can’t stop the Houthi rebels attacks on shipping in the Red Sea with their task force and after numerous strikes against the rebels. The administration is pivoting to sue for peace talks with the Houthi rebels to halt the attacks in the Red Sea and try to reduce oil prices and supply chain issues….

To which, geopolitical analyst, Arnaud Bertrand, had this to say…

A day is not a trend, but it’s hard to view this afternoon’s dump in stocks as anything other than an oil / inflationary reaction exacerbated (finally, as I’ve long expected) by geopolitical developments in the Middle East and Russia.
Currencies and Commodities
The U.S. Dollar Index lost -0.2% to $104.07.
WTI Crude oil traded above $87 intraday and climbed +1.3% to end the day at $86.57/bbl.
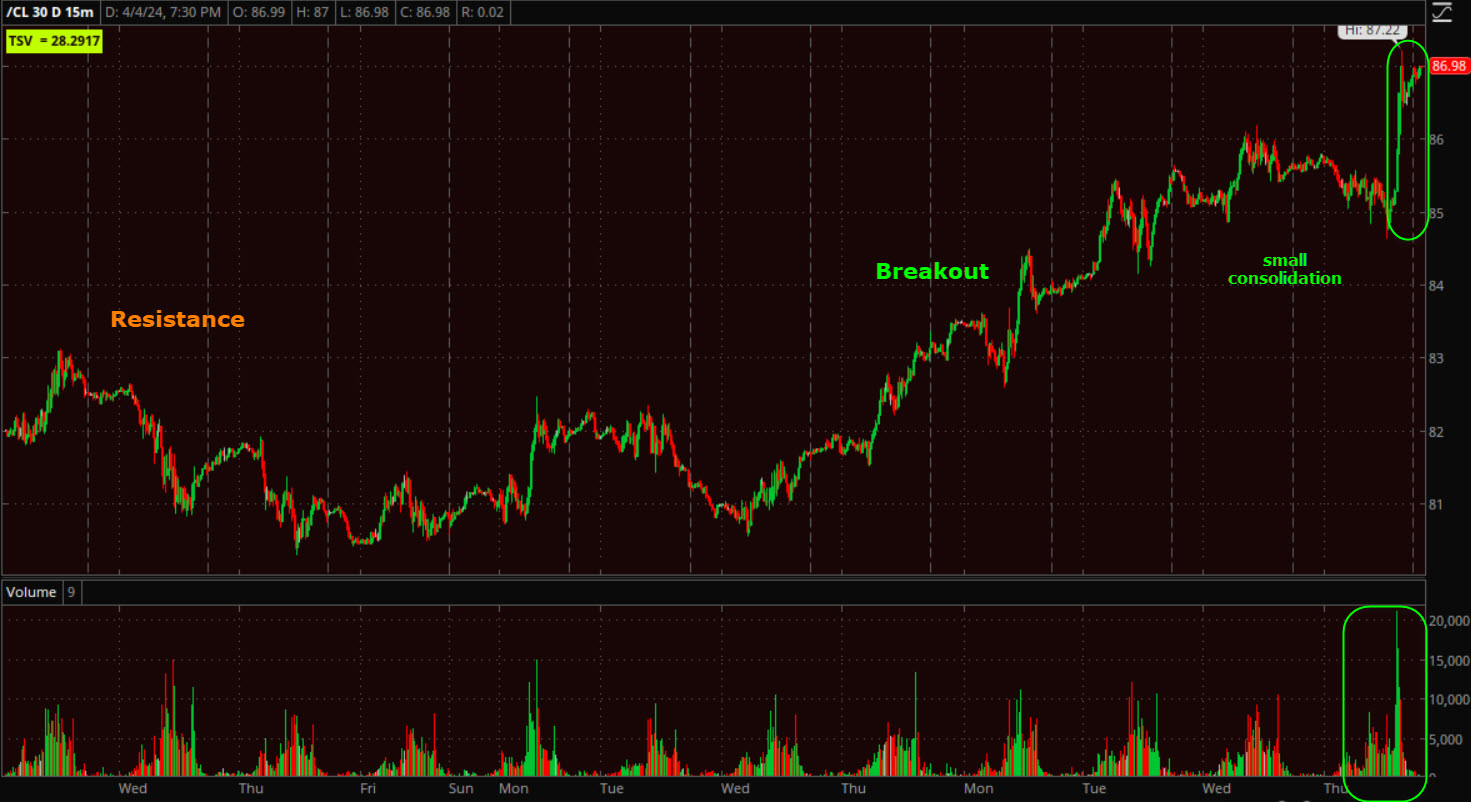 WTI Crude Oil futures (15m) – The afternoon’s big move up is in green, as well as heavy buy-side volume.
The catalyst was escalating geopolitical tensions after headlines that the UAE is cutting ties with Israel and Israel putting all of its global embassies on alert, as well as jamming GPS signals across most of the country in case of an Iranian drone attack in retaliation for Monday’s Israeli attack on the Iranian embassy in Damascus. Net effect…. INFLATIONARY.
Wholesale gasoline prices hit their highest level in seven months, which lead pump prices ever higher. Since mid-December, I’ve suspected that Crude Oil was the asset to watch — even if you have no interest in trading oil — which has more than doubled the SPX and NDX’s 2024 ytd gains, and was one of the earliest tells of reflationary pressures building while stocks remained blissfully ignorant.
Gold hit a new record high for the sixth day in a row, with spot gold above $2300 for the first time ever before selling off late in the day. Gold futures settled lower by -0.3% to $2,308.50/oz.
Bitcoin had a better day than equities, but ultimately is doing nothing more than what was expected… back-testing a broken range from below around the $68k area.
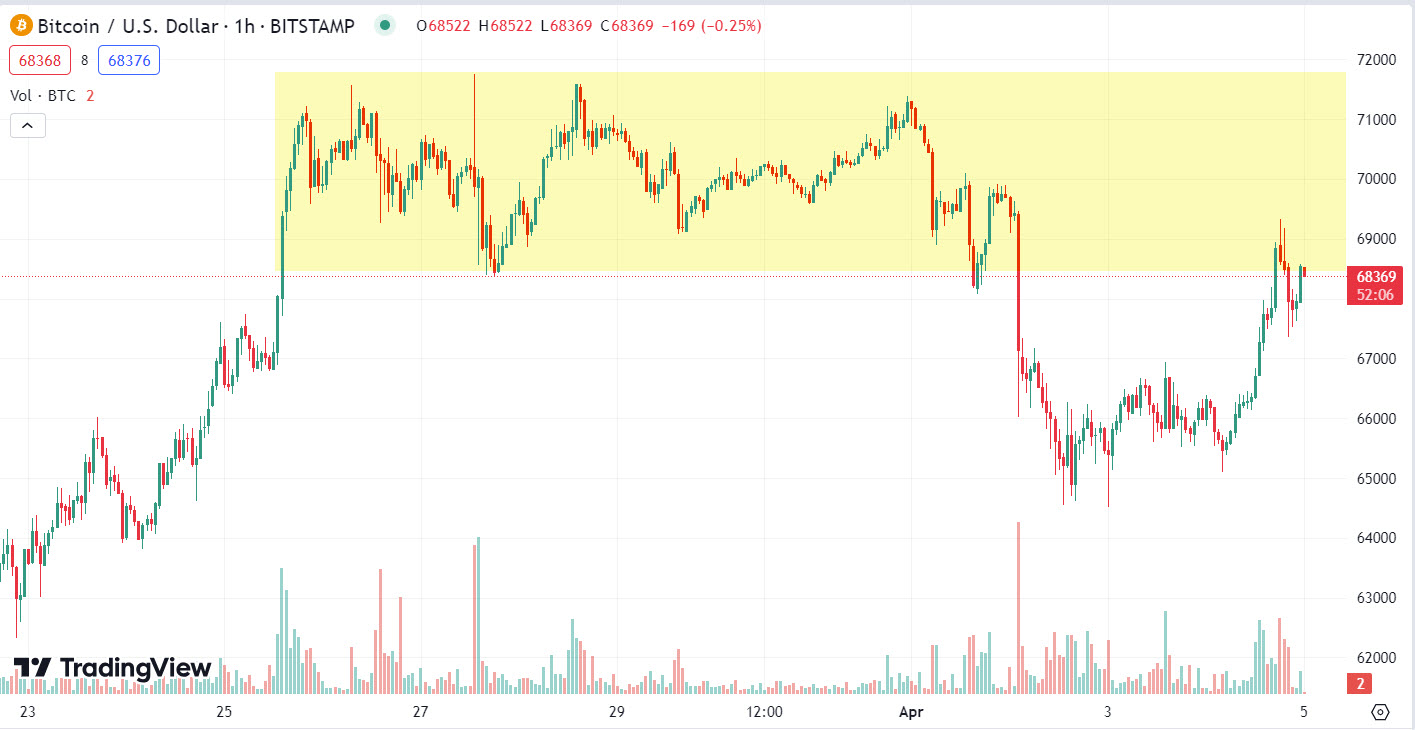 BTC/USD (60m)
Summary
Picking back up on my thoughts from the Intro section of tonight’s Daily Wrap relating to the Jobs data and the Fed’s newly emerging and challenging quandary…
As for the ridiculousness of the BLS’s Jobs report (out tomorrow morning at 8:30 a.m. ET), am I surprised by the trend of fictitious data? No.
It’s an election year, and a contentious one at that. Whatever side of the political isle you’re on in is irrelevant for our purposes, and something I have zero interest in with regard to my analysis. The actual jobs and inflation data and subsequent revisions lower to jobs data is all that matters for our purposes.
So what does all of it mean? It’s the Fed’s nightmare scenario.
Inflation is stickier in the U.S. than most of the world and reflating, which means it will be difficult for the Fed to cut rates soon. The purpose of which is to shoot for a soft landing and avoid an economic recession. A recession is a near certainty historically speaking after such an aggressive Fed rate hike cycle. The Fed would feel pretty good about waiting to cut rates with the uncertain inflation outlook “IF’ the employment situation was as strong as the BLS data depicts upon its initial release. However, the employment situation is not as strong as the BLS initially depicts and the Fed knows it. Anyone who watches the revisions from the BLS knows it. The reality is that employment is not as strong as the BLS depicts, makes cutting rates sooner than later a higher priority for the Fed as they try to navigate a soft landing and avoid a painful recession. However, reflation in Q4 ’23 and Q1 ’24 ties the Fed’s hands from taking any action.
I say it often… The equity market is the dumbest money compared to larger and more sophisticated markets like currencies, commodities, precious metals, credit and rates. The equity market bought into the BLS overstating job gains because it fits the bull narrative. Equity investors have paid no attention to the year-plus trend of subsequent and meaningful downward jobs data revisions nearly every month when headline Payrolls are released. The more sophistaced markets are aware and discounting both the weaker than reported jobs data, and the reflationary theme of 2024. The Fed seems to get it too, although there are certain things they will not say publicly at the headline level, but that you can easily dig up with a little curiosity, a healthy dose of skepticism when it comes to election year government data, and willingness to view the data as it is, not as our personal interests would have it.
This is among the reasons we have such massive negative divergences between the major equity averages on one side and the rates, commodity, credit and currency markets on the other for all of 2024.
As the old saying goes, “The market can stay irrational longer than you can stay solvent.” This is true, but it doesn’t mean you should bury your head in the sand and just take whatever you’re told at face value. I’ve been increasingly skeptical of market gains and the economic growth/inflation developments since first getting a whiff around mid-December. I’m aware of the jobs and reflation trends. However, I haven’t once said, “I think this is the time to short the market”… yet. I’m aware of the equity market’s habit of ignoring anything that doesn’t fit the narrative, whether in a bullish or bearish market price trend. Narratives can be more powerful than actual data or actions. The Fed figured this out 20 years ago, and realizes that they can often jawbone the market in the direction they want, without having to make actual policy changes. Powell is the first Fed chair, at least in my memory, to hold a press conference after every single FOMC meeting. Powell understands the power of forward guidance, or jawboning the market.
However, facts are still facts and the facts that the equity market is just coming to grips with is now a trend of at least a quarter. You’ve seen the divergences between stocks and rates, or stocks and the dollar or credit. That’s a reflection of what the equity market has thus far ignored.
Hey, it’s nothing new. I was ponding the table for 5or 6 weeks in late 2019 an early 2020 that credit, rates and commodities were all pointing to a major deflationary event. Yet the stock market blissfully ignored signals that were screaming and jumping off the charts, and stocks went on to make a number of new record highs, until the facts could no longer be ignored. Those major deflationary signals were warning of the U.S. economy being shut down due to Covid.
After this post, I don’t think there’s a lot I can add heading into tomorrow morning’s Payrolls report. I’d just say that I think the market will be more interested in the change in wages than anything else given the reflationary pressures bubbling to the surface.
Overnight
S&P futures are flat tonight.
The U.S. Dollar Index is up nearly +0.2% to retrace today’s losses.
WTI Crude Oil futures are up +0.1%
Gold futures are down -0.75% to $2291.
Bitcoin futures are down -0.6% as the $68k resistance area is felt.
Friday’s economic calendar features:
- 8:30 ET: March Nonfarm Payrolls (prior 275,000), Nonfarm Private Payrolls (prior 223,000), Average Hourly Earnings (prior 0.1%), Unemployment Rate (prior 3.9%), and Average Workweek (prior 34.3)
- 15:00 ET: February Consumer Credit (prior $19.5 bln)