Once again early buying faded quickly with no specific news catalyst to account for the change. The S&P slid below my own trend line at $5040 before noon. There was another attempt to move higher in the afternoon which ran into resistance at the $5040 area, then led the major indices to close lower.
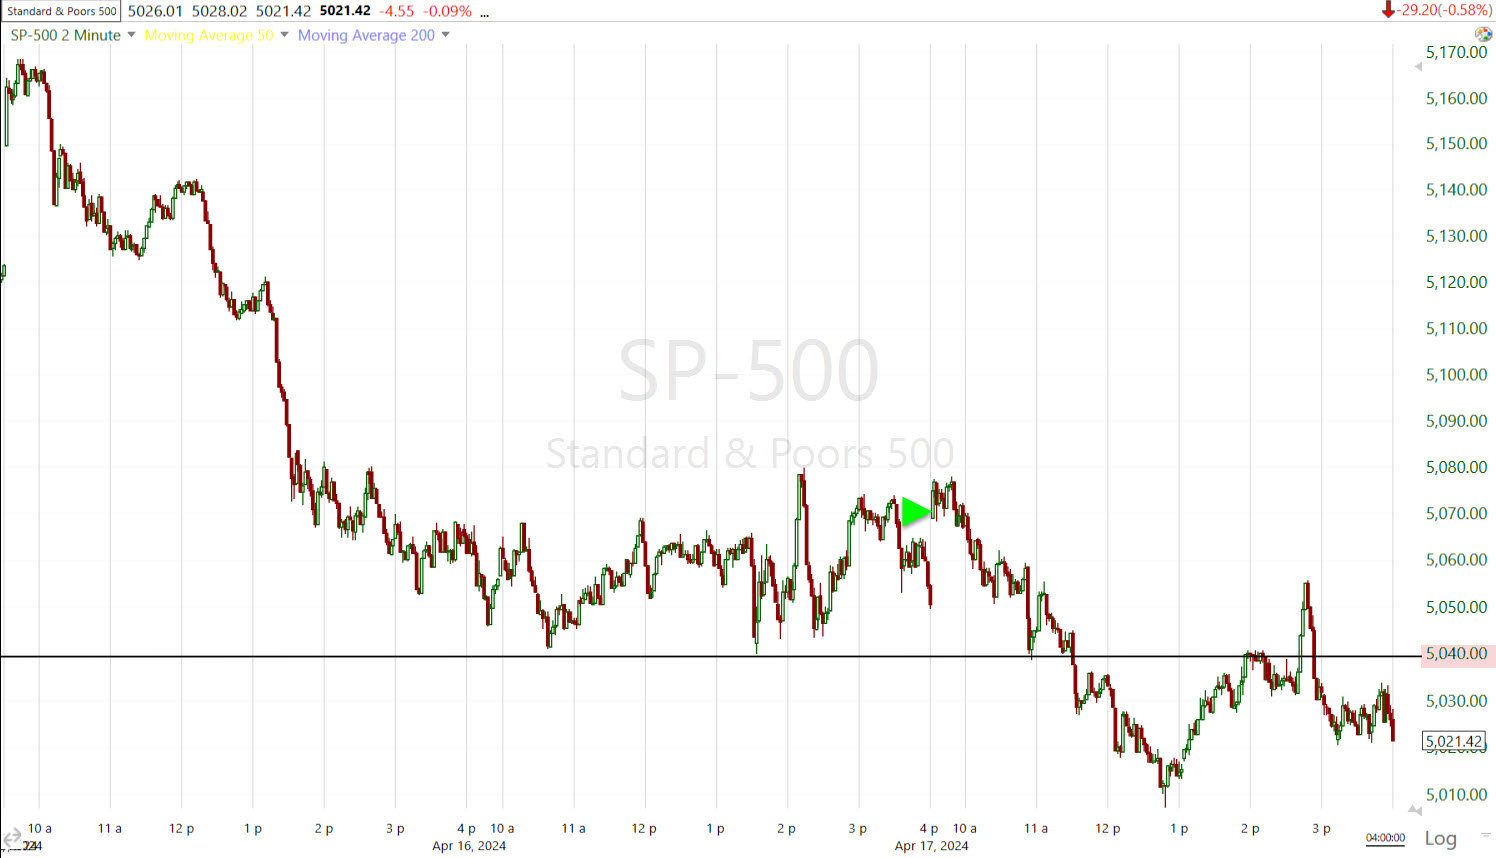
(2m this week) – I have no idea what the catalyst was for the afternoon run above $5040 this afternoon. The Treasury auction results were out well before that. In any case, former support turned into resistance as semiconductors made a new intraday low this afternoon.
Interestingly, we saw the same price action at the same time of day yesterday afternoon.
 (2m)
(2m)
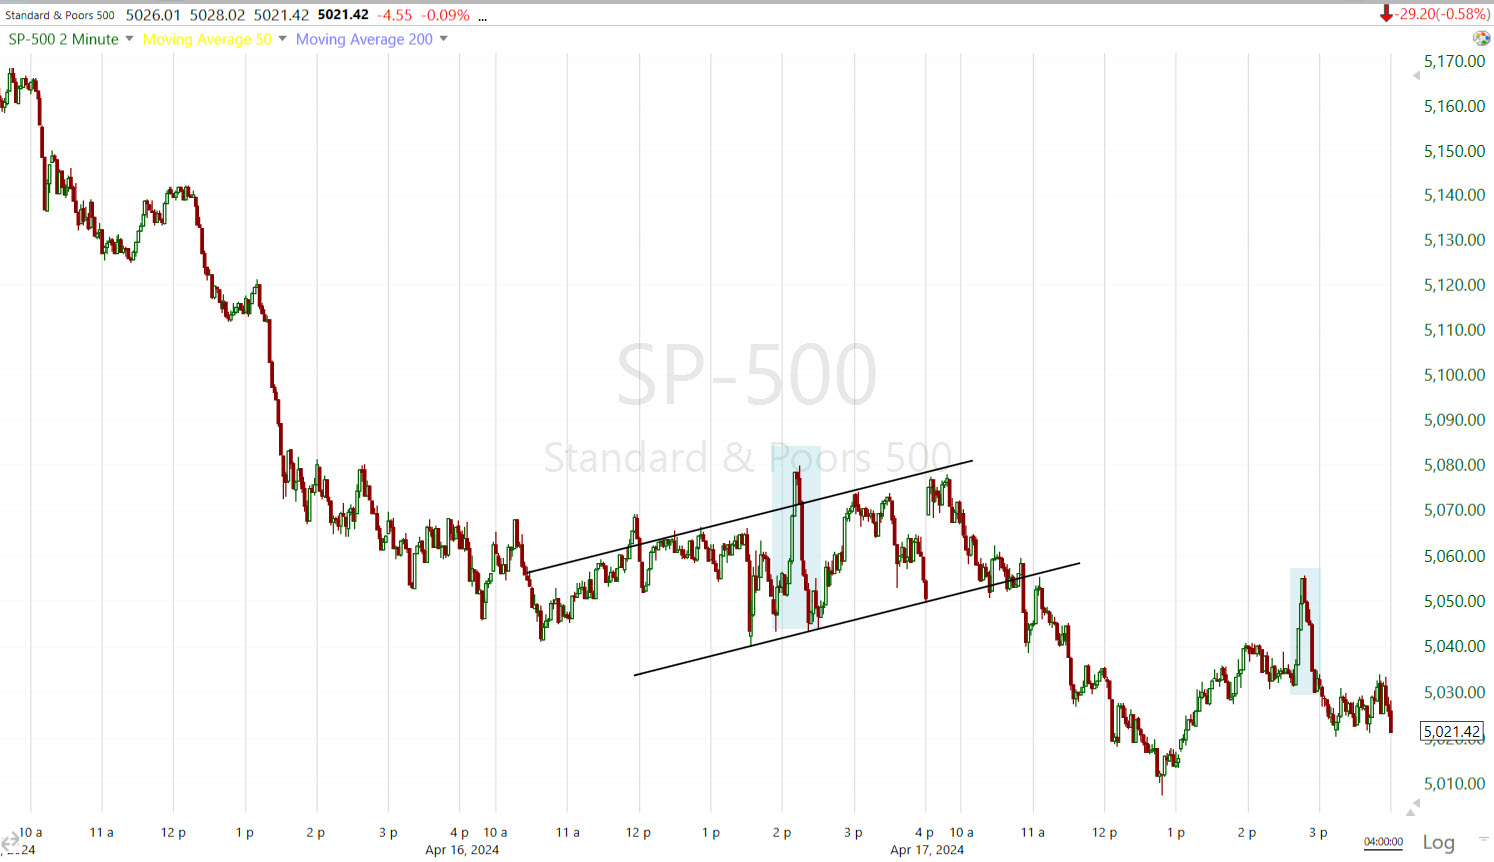
Weakness in semiconductors was apparent from the open. Mega-caps were performing in-line with the S&P Equal Weight Index early on, but started seeing increased selling as the morning session wore on.
The equity market had every advantage today, from lower yields to an unusually weak VIX (contract roll?), a lower Dollar and extremely deep short-term oversold conditions. I think today was a clear example of CTA’s deleveraging from near record long positioning. As noted last week, “The first short-term CTA sell trigger is estimated to be SPX $5120.”, which was taken out Friday and again early this week. The selling today was focused on the same stocks CTA’s had been loading up on the long side most of 2024 (semis and mega-caps).
The Fed’s Beige Book showed that economic activity expanded slightly, consumer price sensitivity remains elevated.
Employment rose at a slight pace overall, with nine Districts reporting very slow to modest increases, and the remaining three Districts reporting no changes in employment.
Price increases were modest, on average, running at about the same pace as in the last report. Disruptions in the Red Sea and the collapse of Baltimore’s Key Bridge caused some shipping delays but so far did not lead to widespread price increases. Another frequent comment was that firms’ ability to pass cost increases on to consumers had weakened considerably in recent months, resulting in smaller profit margins. Inflation also caused strain at nonprofit entities, resulting in service reductions in some cases.
Consumer spending barely increased overall, but reports were quite mixed across Districts and spending categories. Several reports mentioned weakness in discretionary spending, as consumers’ price sensitivity remained elevated.
Averages
NASDAQ-100 and Small Caps were the standout losers, while the Dow settled with the slimmest loss. Dow Transports (-1.7%), however, were hammered lower. Bellwether transport, J.B. Hunt Transport (JBHT -8.1%), posted a big loss after disappointing quarterly results.
S&P-500 ⇩ -0.58 %
NASDAQ ⇩ -1.24 %
DOW JONES ⇩ -0.12 %
RUSSELL 2000 ⇩ -0.99 %
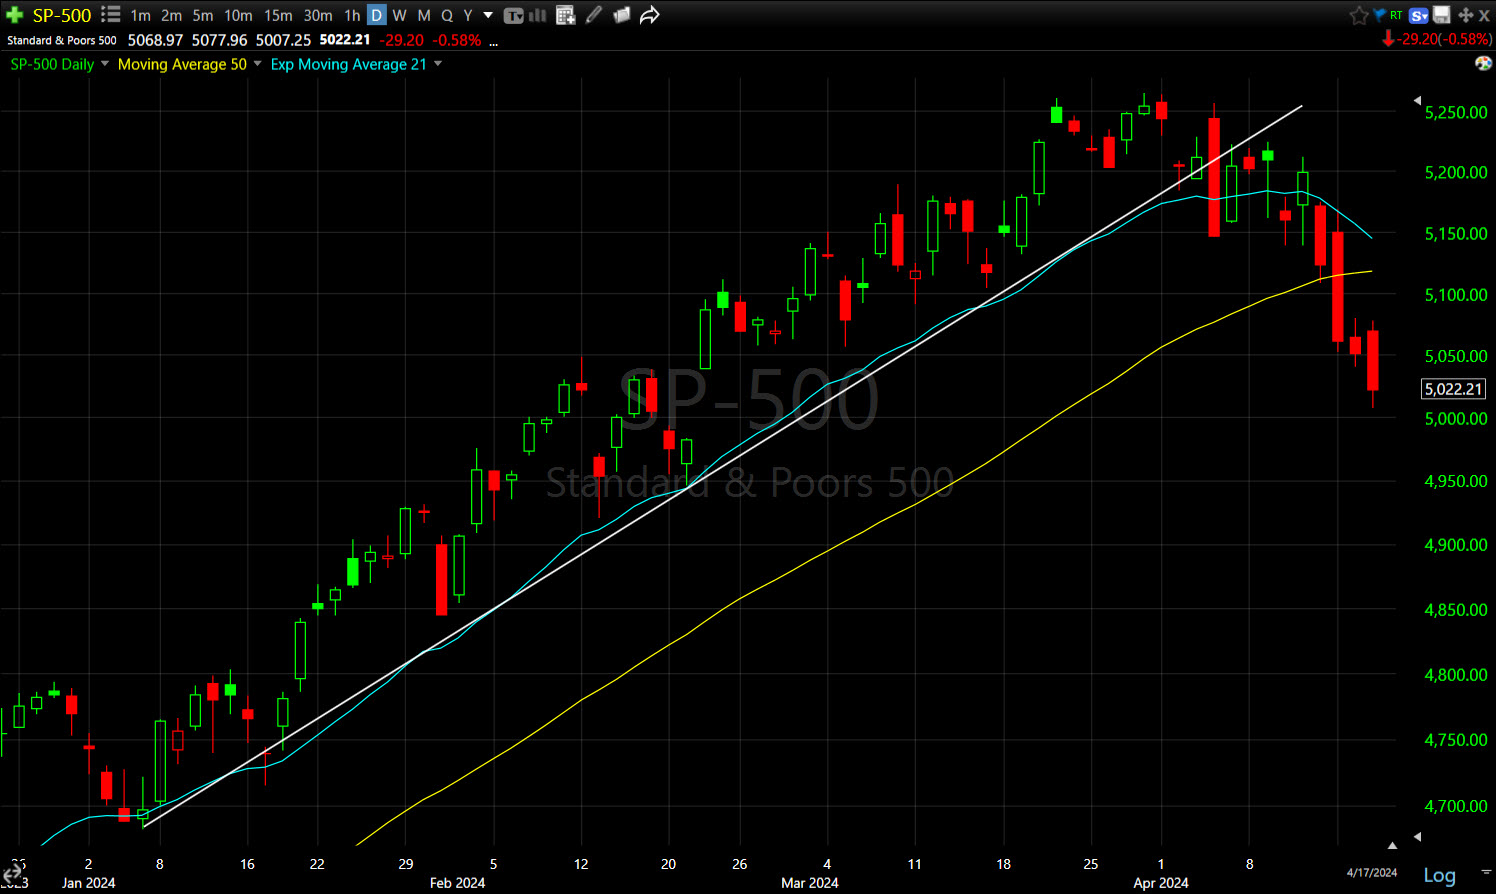 SPX (daily) just barely closed off the lows and down 4 in a row. The YTD up trend is decisively broken. Now we look for the oversold rebound to flesh out the S&P’s likely top.
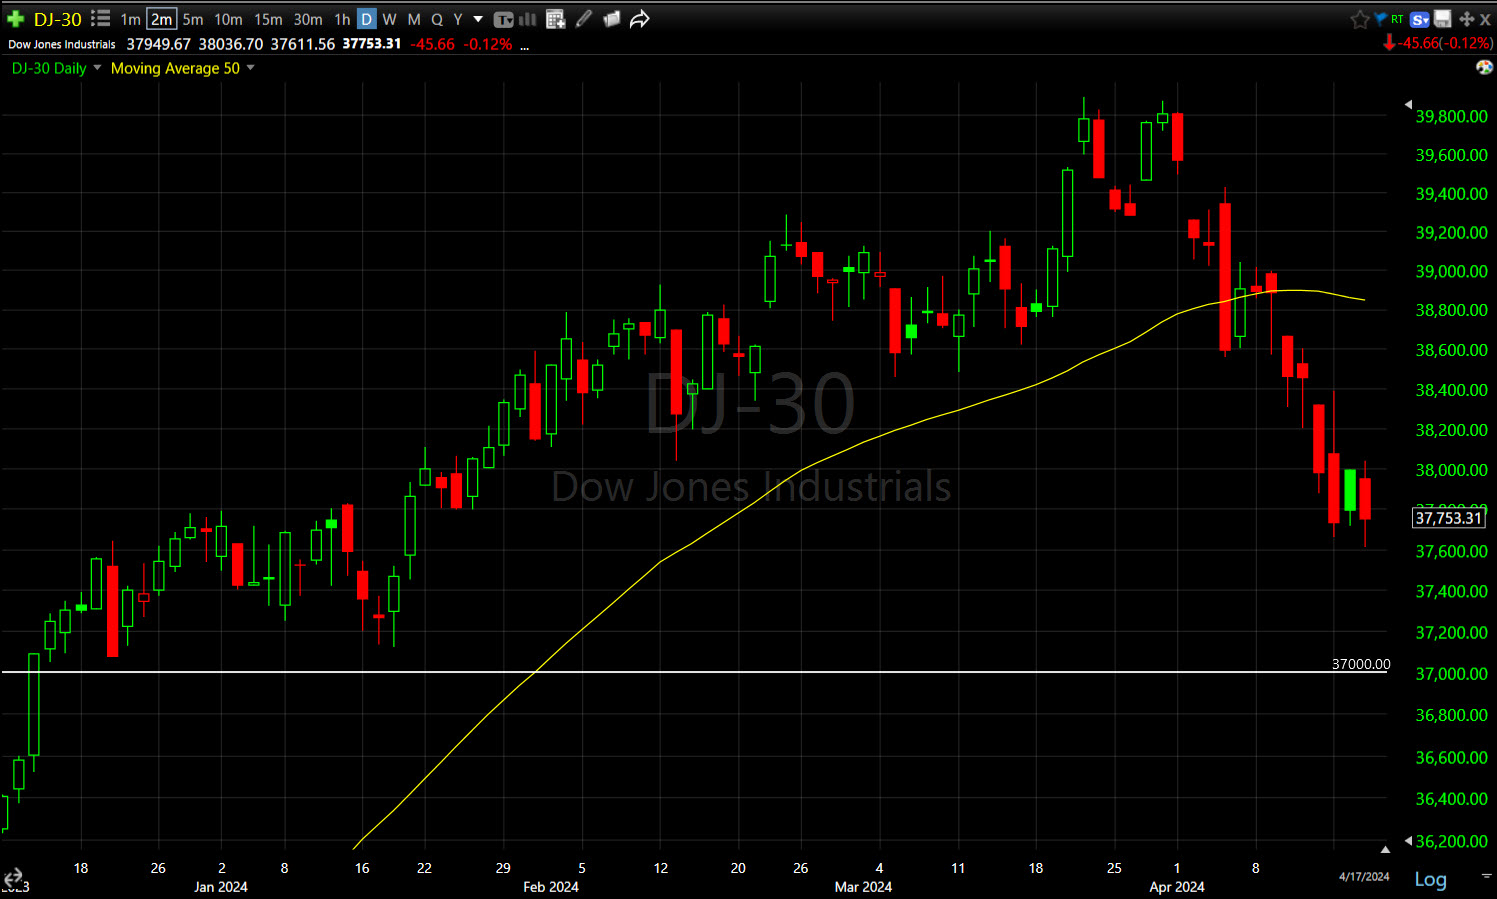 Dow Industrials (daily) have now given back all 2024 gains. The trend line below is the 2021 high.
![]() Dow Transports (2h) are now down -5.75% YTD.
Dow Transports (2h) are now down -5.75% YTD.
The way Transports ended the day, I wouldn’t be surprised to see more downside to come in the near-term.
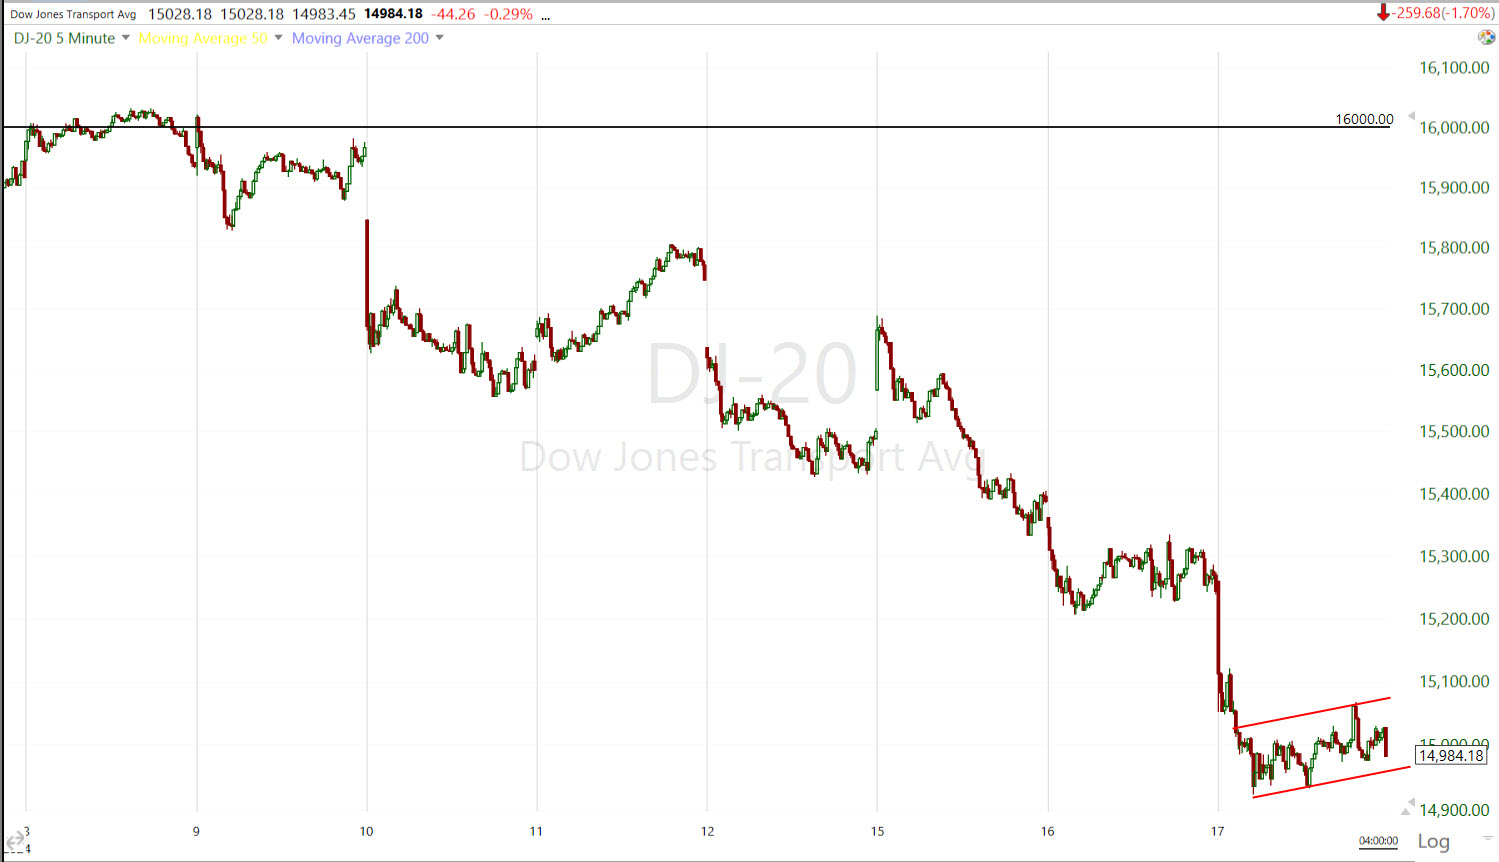 Dow Transports (5m)
With Transports acting as badly as they have been for a while now, this isn’t what you expect to see in an economy as strong as government data insists it is.
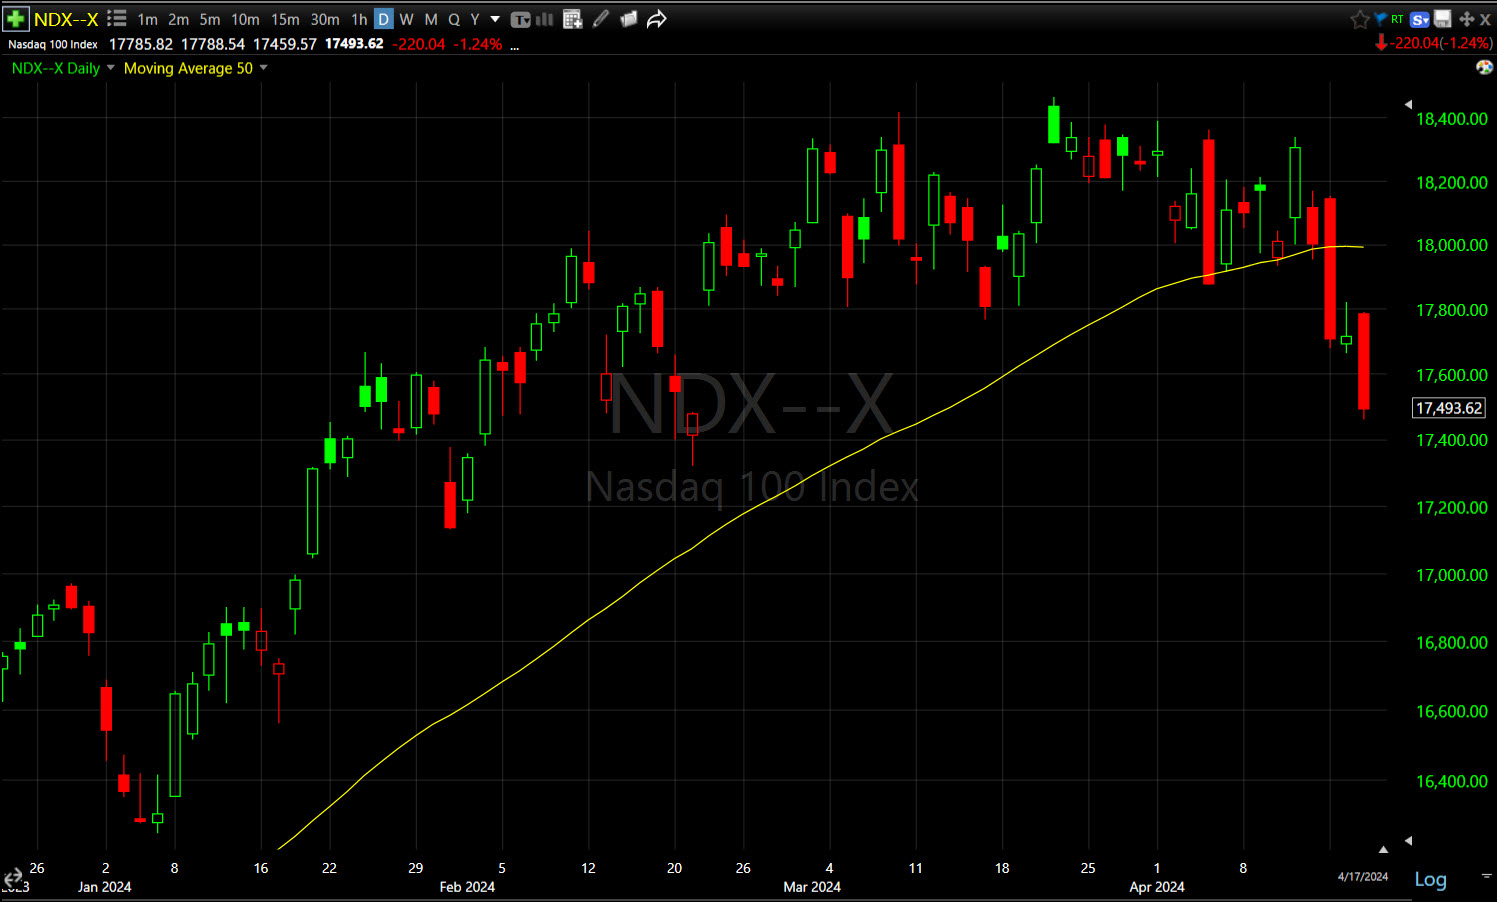 NASDAQ-100 (daily) – Yesterday’s price candle was NOT a bullish harami/inside day, just a pit-stop consolidation before another leg lower. Today’s close was ugly near session lows and that’s never a good look heading into the next day. I don’t know where the market finds support for an oversold bounce (CTA’s are running the show), but I do think it’s coming. In the meantime, the more the NDX and market come down here, the bigger the top and downside measured move will be. Said another way, NASDAQ is widening out that lateral range and toppy price action.
While you can’t argue with price as semis and mega-caps tore higher in 2024, you can observe that if serious investors indeed believe that there’s going to be a soft-landing (or no landing/no recession), Small Caps would be the average to lead the way higher. We know very well they have not.
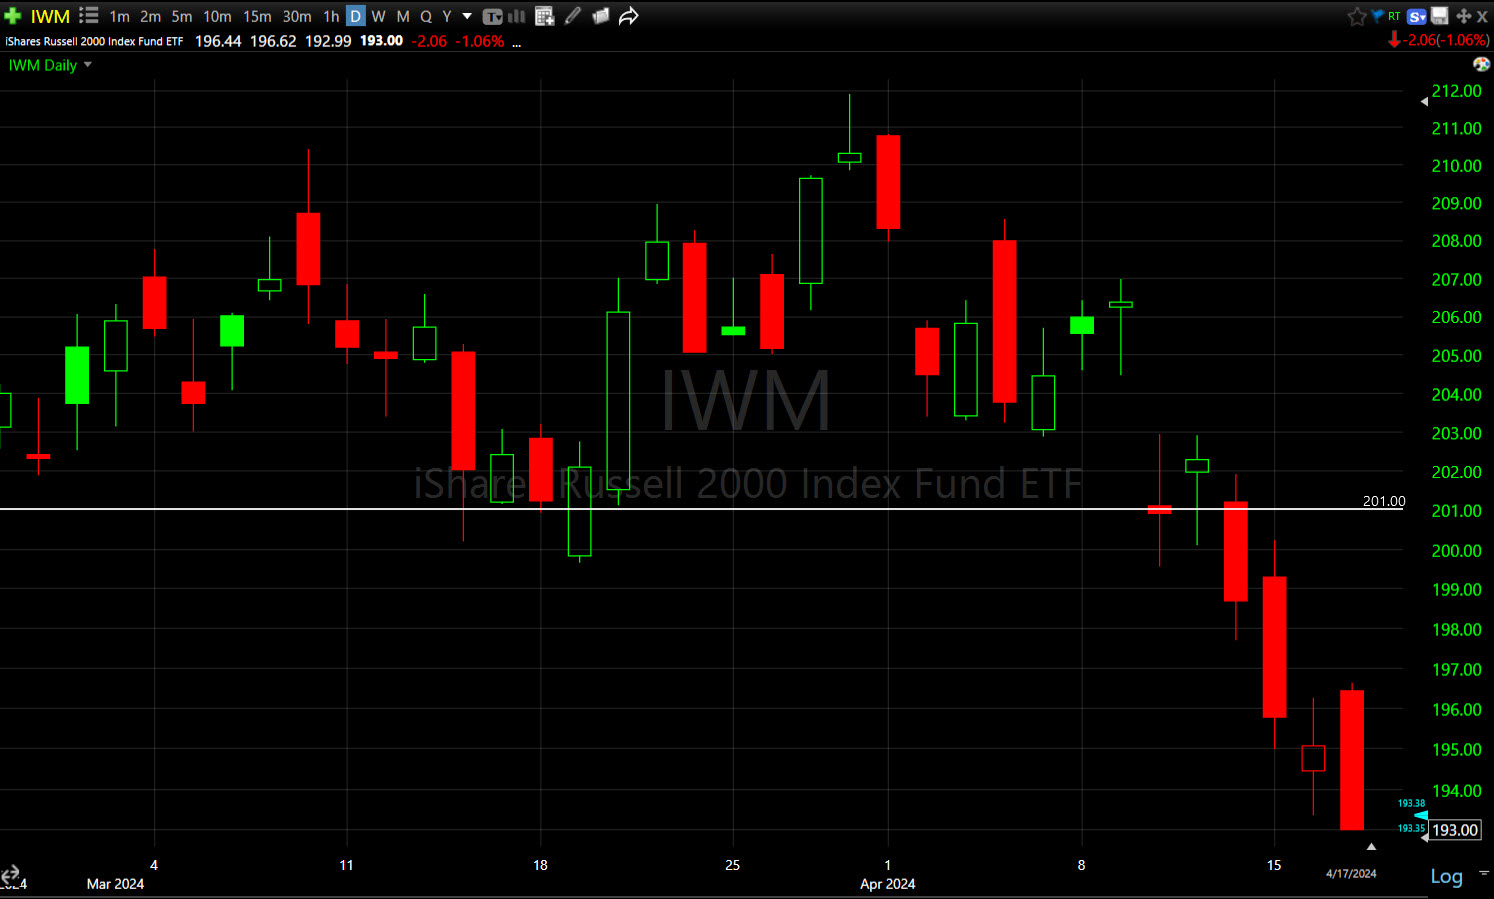 IWM (daily) with a very ugly bearish engulfing candle today and closing at session lows. Again – this doesn’t look good for the very near term.
This is looking more and more like the late 2021 scenario when mega-caps had taken over leadership that year, but as 2021 moved into the latter part of the year, slowly the leaders fell by the way side and investors attempted to rotate into Small Caps. That lasted 2 weeks before the breakout from a year-long lateral price range failed. Next, the entire equity market topped and pushed into 2022’s bear market.
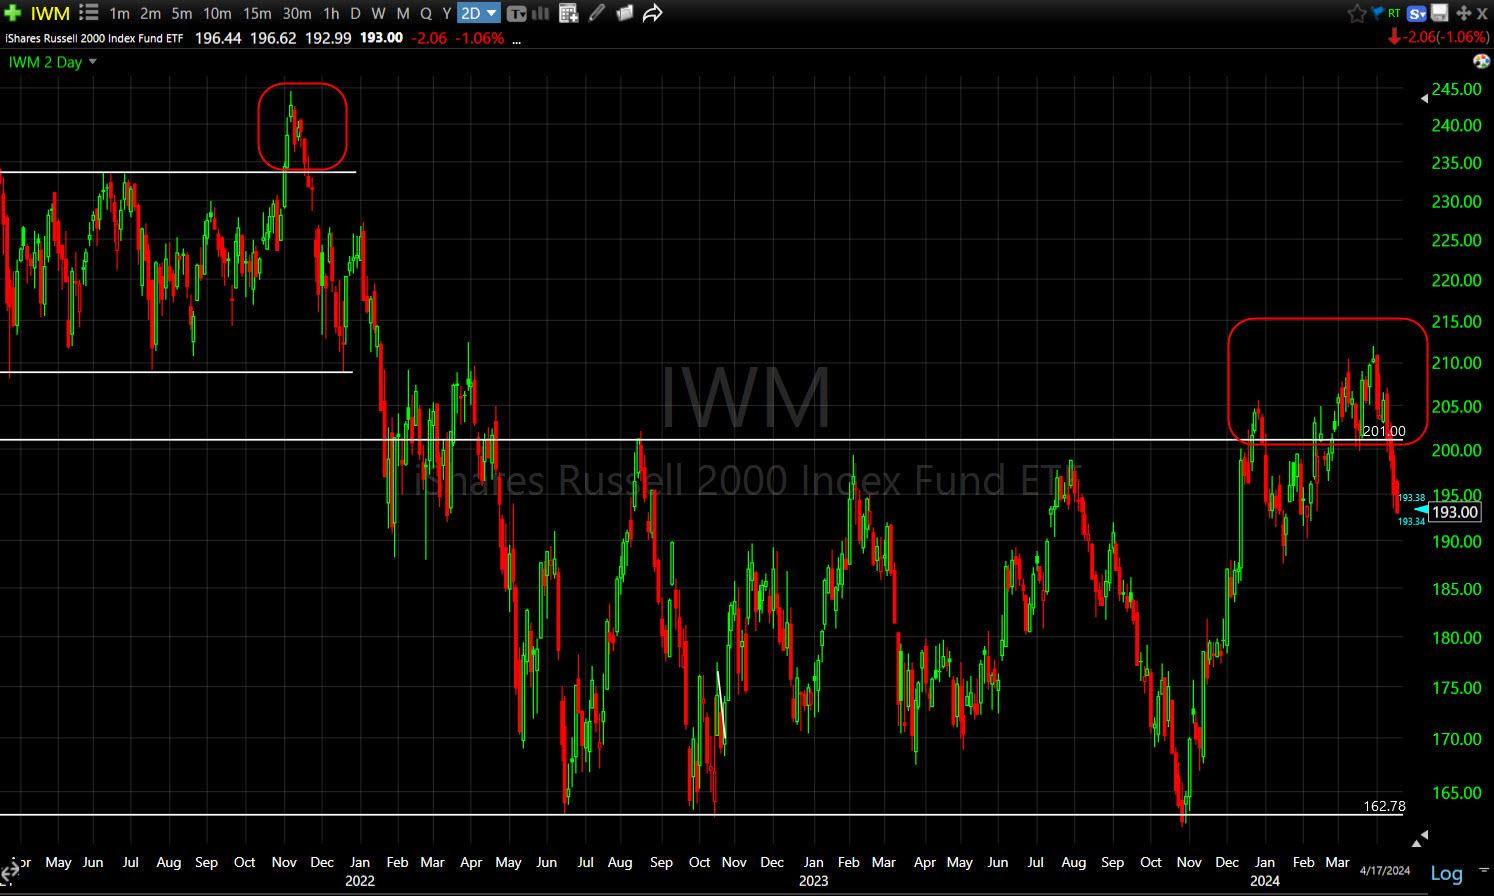 IWM (2D) The only difference is the scale in that the lateral range now is 2 years rather than one (almost one) and the failed breakout is proportional in size to the larger lateral range.
Shorts actually did some covering today.
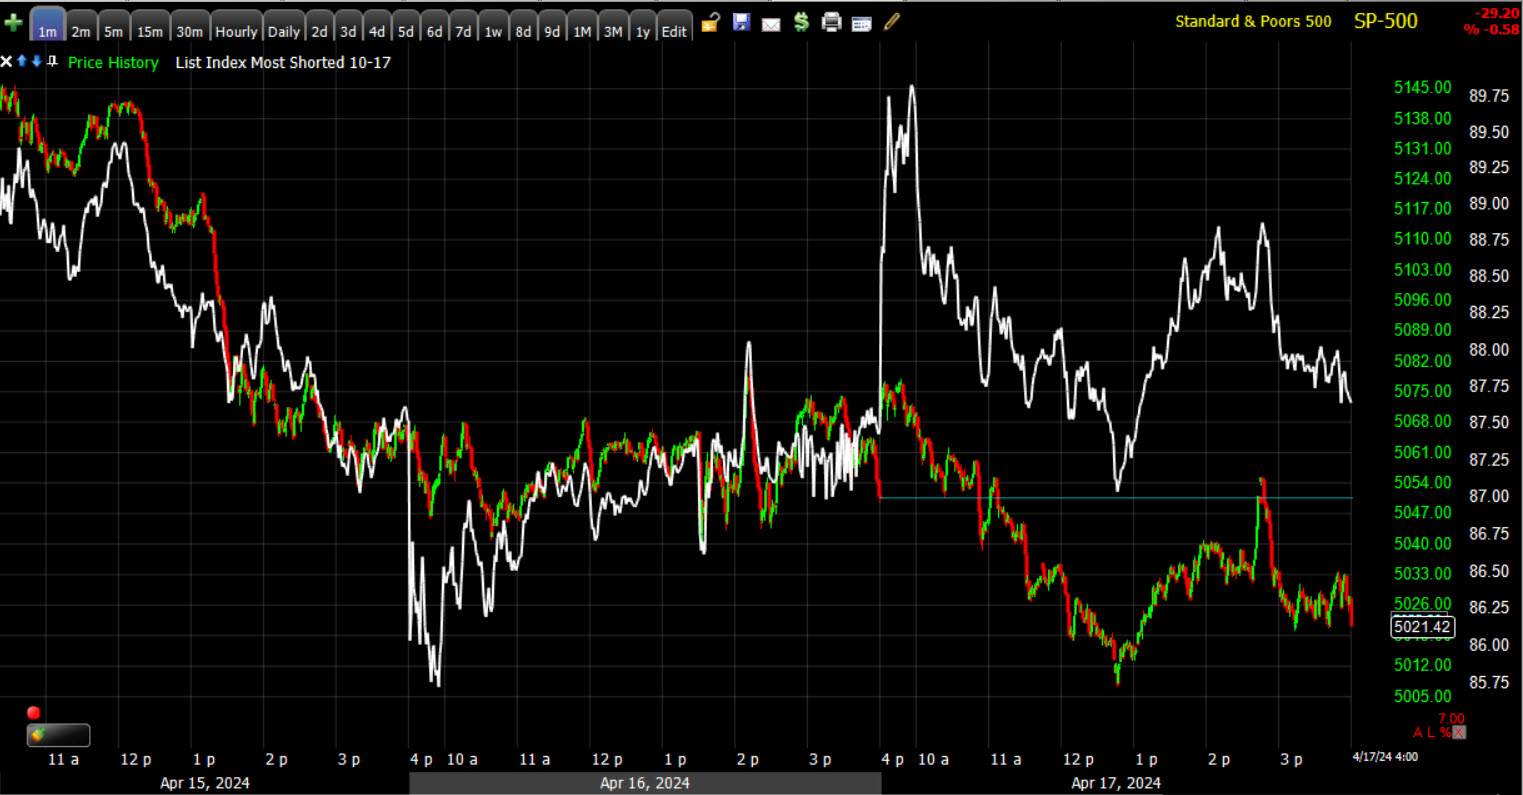 SPX (1m) and Most Shorted Index
Normally VIX (-1%) shouldn’t be down on a day like today. The only thing that I think of that accounts for this is the VIX futures contract rolling tonight in light of how extreme VIX’s gains were Friday. The extra “premium” from Friday is likely being rolled off into the new month’s contract, but still, low volatility allows funds to leverage up on the long side and provides support for stocks. Stocks “should” have acted better today with VIX as weak as it was, which again suggests the CTA’s were in the driver’s seat today and deleveraging.
ABI ended at 49.
S&P sectors
7 of 11 S&P sectors closed lower with the Technology sector (-1.45%) being the standout loser, followed by Real Estate.
After some outperformance yesterday, which didn’t amount to much more than a bear flag, Semiconductors (SOX) lost -3.25%, meeting the conservative downside measured move I posted earlier.
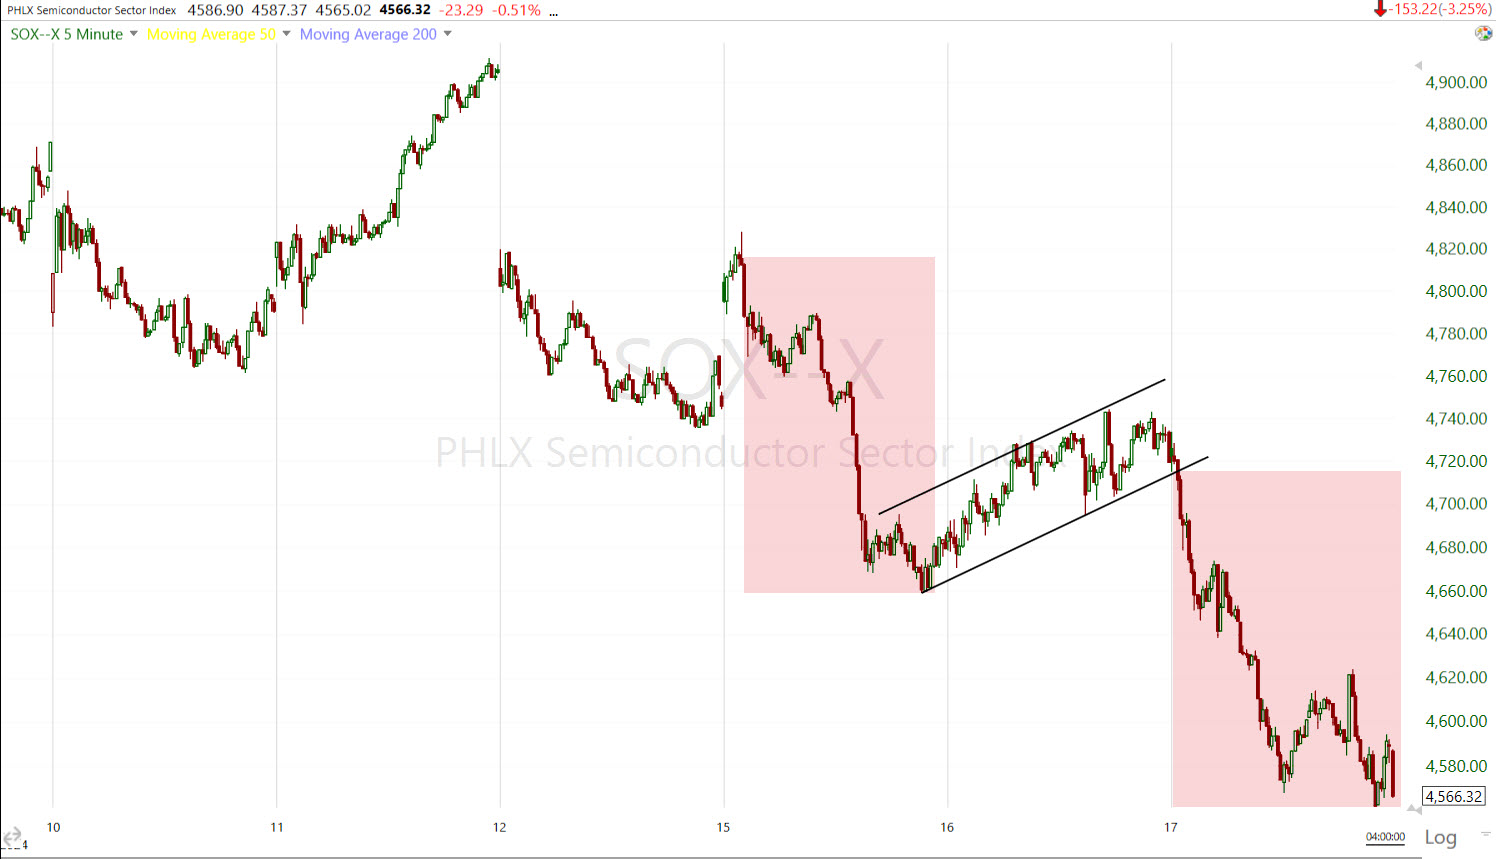
SOX Index (5m)
ASML (ASML -7.1%) was the worst performer in the SOX after reporting weaker-than-expected Q1 bookings. NVIDIA (NVDA -3.9%) was another influential laggard from the space.
The Mega-Caps (MGK -1%) underperformed the Equal Weight S&P-500 (-0.2%) by 80 basis points.
The defensive Utilities sector saw the largest gain by a wide margin, followed by the Consumer Staples; both benefitting from risk-off tone and a pull back in yields.
Materials ⇧ 0.23 %
Energy ⇩ -0.29 %
Financials ⇧ 0.25 %
Industrial ⇩ -0.52 %
Technology ⇩ -1.44 %
Consumer Staples ⇧ 0.37 %
Utilities ⇧ 2.09 %
Health Care ⇩ -0.17 %
Consumer Discretionary ⇩ -0.49 %
Real Estate ⇩ -0.83 %
Communications ⇩ -0.09 %
One bright spot was United Airlines (UAL +17.5%) up big after quarterly results.
Internals
Decliners (1392) barely edged out Advancers (1316) on Volume (878 mln shares) that was well below average. This is typical of a market that’s being thrashed by several heavily weighted stocks and I think we know who’s selling them.
There is no Dominant price/volume relationship. There is no 1-day oversold signal, but Breadth Oscillators are even more oversold.
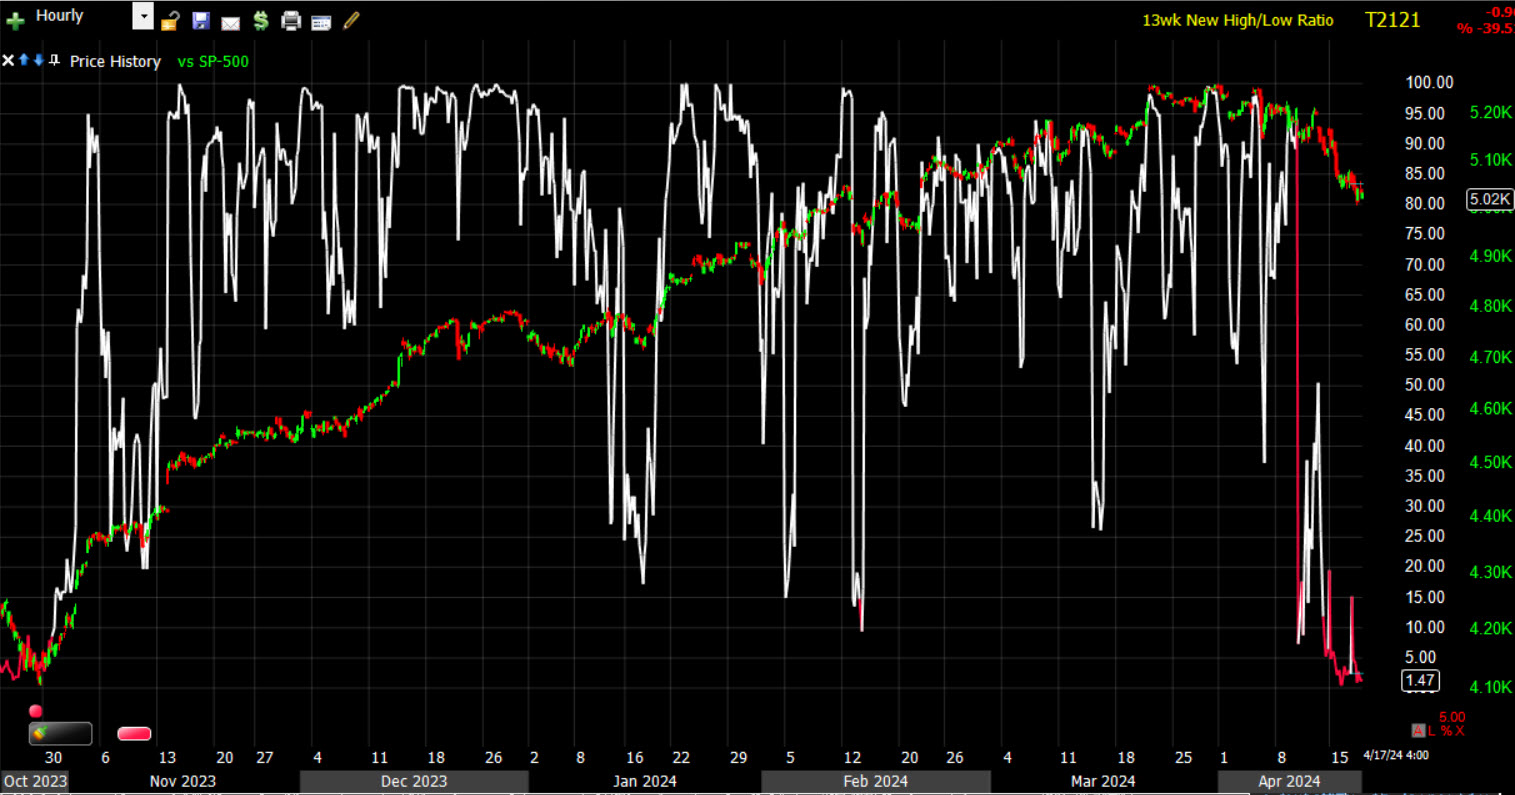 In the short-term this is helpful for the market as we should get a decent bounce to reset oscillators near overbought again, but long term we should not be seeing breadth this oversold with the S&P still just off record highs. These are the kind of signals you see after a 3 month downtrend and the S&P losing 500 points which just speaks to how weak the market has been beneath the surface in 2024 as it’s been propped up by a dozen heavily weighted stocks. Play the game, but know what the game is or risk a big ugly surprise.
Treasuries
The 10-yr yield settled seven basis points lower at 4.59%. The 2-yr yield fell three basis points to 4.93%. Yields were already moving lower before today’s $13 billion 20-yr bond auction was met with excellent demand.
Yields started the correction/consolidation expected in the area after a sharp run higher in the wake of last week’s hot CPI and the 2-yr testing 5.00%.
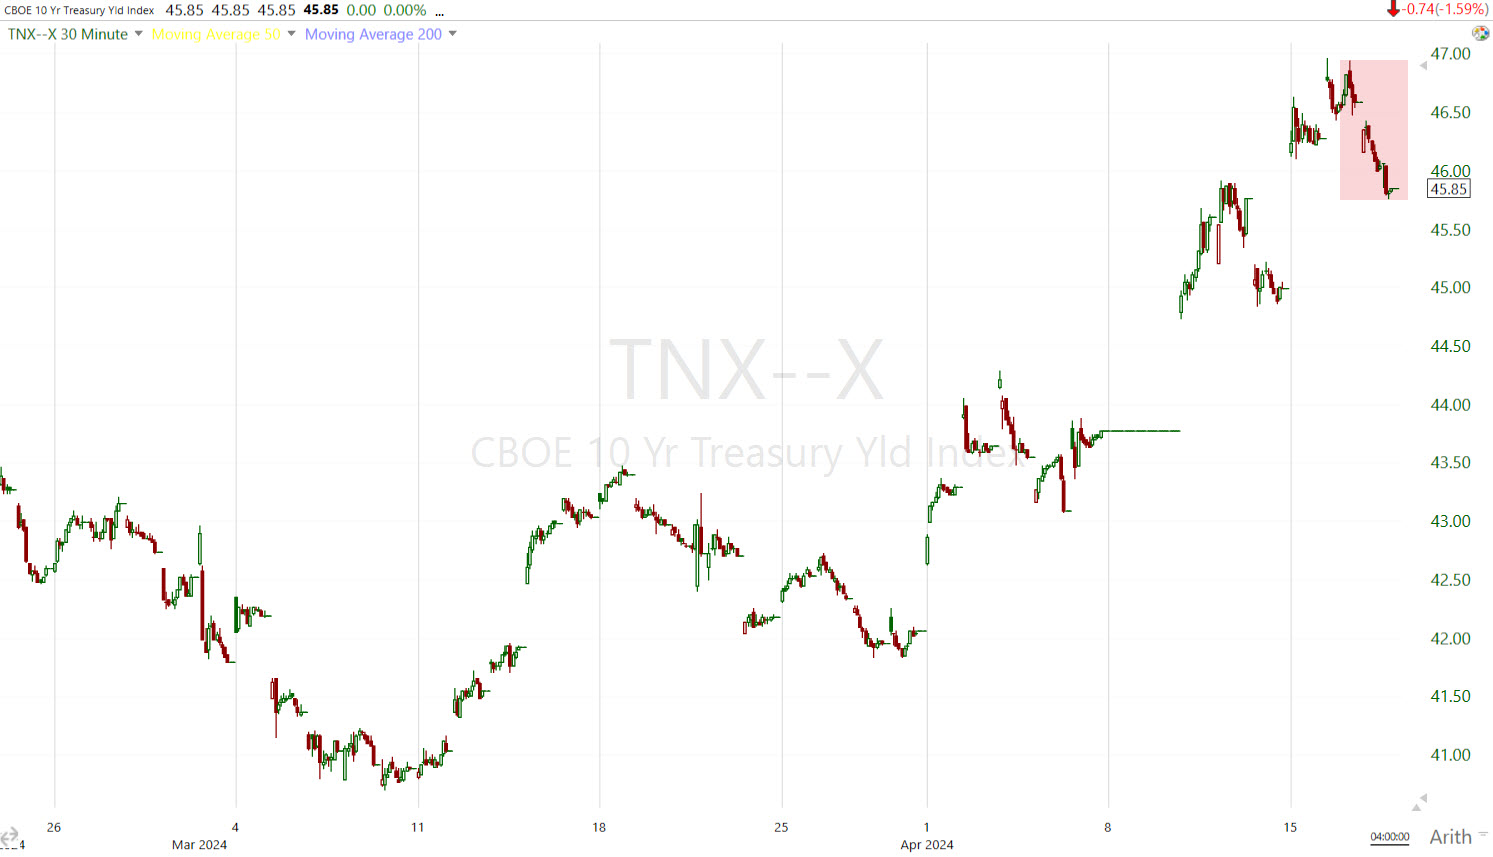 10-yr yield (30m)
Rate cut expectations were pretty much unchanged today.
HY Credit (HYG +0.13%) acted well today with lower yields, but the price action remains bearish both short and long term.
Currencies and Commodities
The U.S. Dollar Index lost -0.2% as it too (like yields) is ripe for a correction/consolidation after 6 consecutive closes notably higher.
WTI Crude oil lost nearly -3% today to $82.82.
I mentioned a day or two ago that Crude’s price consolidation was a bull flag, but a bit on the sloppy side. Oil was drifting lower early on after a larger crude stockpile build, but then Maduro and SPR headlines hit and the price fell out of the flag to to three-week lows.
The Biden administration is moving to reimpose oil sanctions on Venezuela, citing a failure of President Nicolás Maduro’s regime to live up to commitments to holding free and fair elections this year. I think this is much more about gas prices and an excuse to tap the U.S. Strategic Petroleum Reserve.
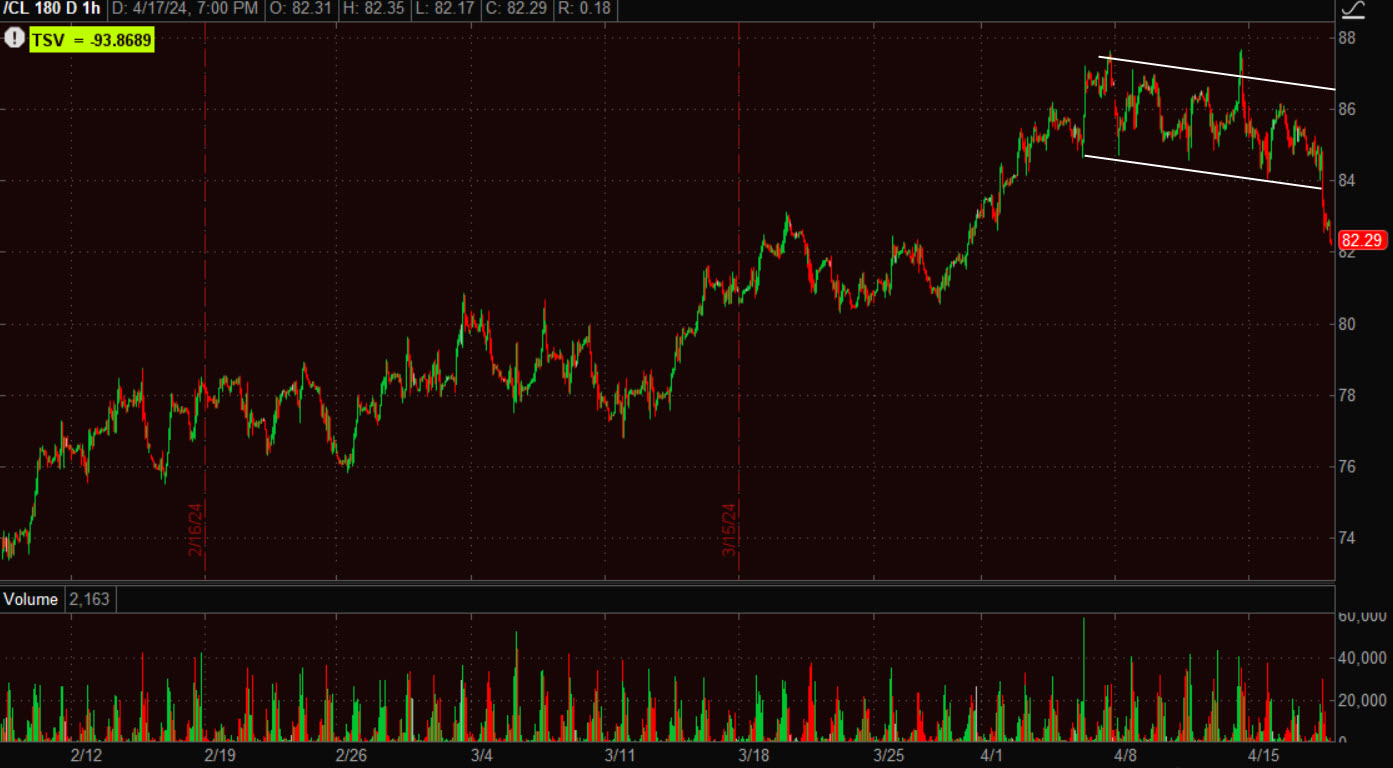 WTI Crude Oil (60m) – The only silver lining for crude bulls is that the volume wasn’t all that heavy today.
Just last night I was just talking about the Biden administration tapping the SPR to try to lower what are set to be sharply rising prices at the pump. It appears the action against Venezuela was a strawman to allow the administration to tap the SPR as the last thing the President needs is additional rising prices at the pump into an election. This isn’t political commentary. I think just about any politician facing a contentions election with gas prices set to soar would do the same. The problem is, this isn’t the first time the Biden administration has drained the SPR. The administration drained 200 million barrels out of the SPR in 10 months to try to lower pump prices and it wasn’t very successful.
Gold futures lost -0.8% to $2,388.40/oz, even as bond yields and the dollar showed weakness. I can’t say I’m surprised. It’s going to take some time for price volatility to settle into a consolidation (I hope) after Friday’s ugly price/volume action.
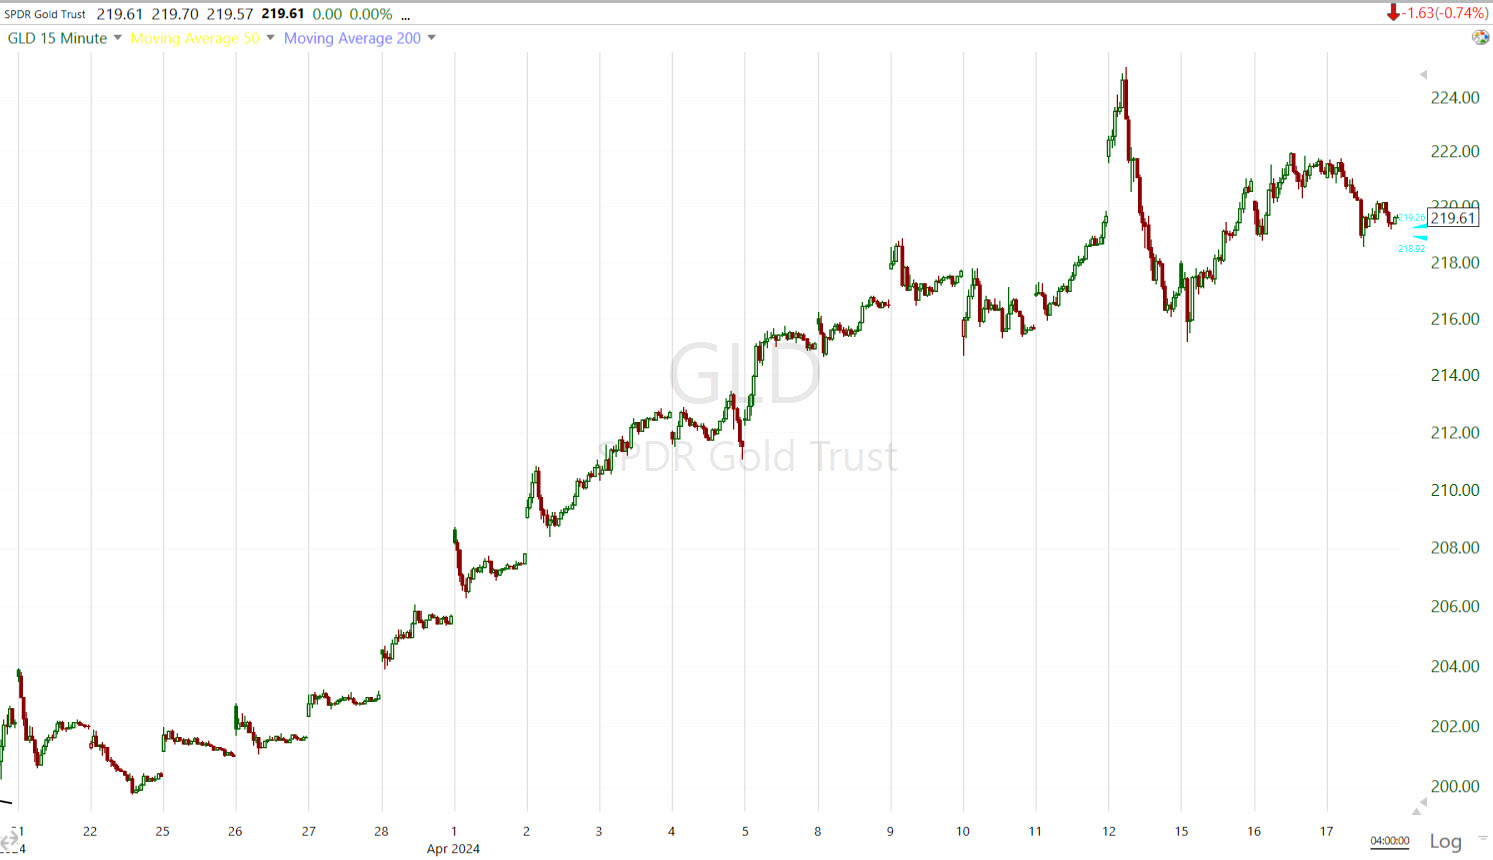
GLD (15m)
Bitcoin briefly tumbled below $60k today.
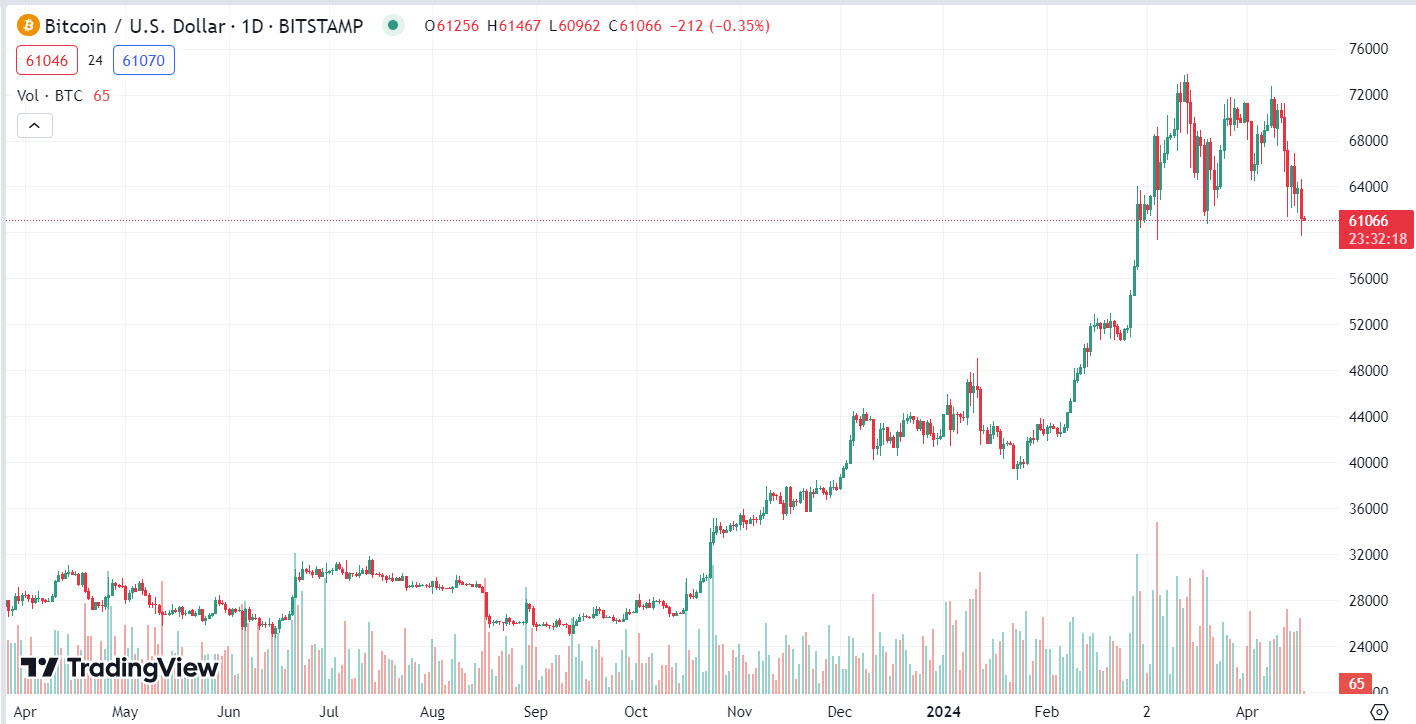 BTC/USD (daily) – Price is looking toppy. Volume looks more like a consolidation. I don’t love it, I don’t hate it. I’m just not interested in having money dead money tied up in something I don’t see a high probability move in yet.
Summary
Some cite an ex Mossad intelligence chief telling SKY News that Iran’s nuclear sites are not off the table in an Israeli retaliation as a catalyst for today’s weakness, but I saw no signs of the flight to safety trade in bonds, VIX, gold ,the dollar, or war premium in Crude, to consider that probable. Rather, we saw targeted selling of Momentum style factors (-1.35%), semiconductors and mega-caps, which have been the year’s big winners thus far. Everything I saw today wreaked of CTA’s (and perhaps others) unloading those positions.
Not that CTA’s “ARE” the market, but their rules-based flows can be significant and spark broader selling across other types of funds. The medium term CTA sell threshold is estimated to be SPX 4880. Goldman warns this would trigger more than $50 billion in SPX supply over 1 month. I think it’s worth noting the “1 month” timeframe. While CTA’s are mechanical rules-based buyers/sellers, their position sizes are so large they cannot simply sell all of their supply at once. I was making this point earlier this week with this S&P futures chart…
 ES (60m) Their footprint looks very different than hedge or pension funds in the distribution phase, in which they try to sell into price strength, even instigating bounces to sell into. CTA’s are less subtle. I don’t know how much more supply they have to unload, but eventually it should slow/stop.
The market is very oversold, but oversold doesn’t mean it has to do anything. It’s just a probability that goes in to the mix with a number of other probabilities. I still think we get an oversold bounce or a relief rally and that fleshes out the right side of the major averages toppy formations. Isn’t it amazing how long you get warning signals, and then how quickly prices move; for many investors, seemingly out of nowhere.
I posted the measured move for mega-caps in an intraday update. A bearish measured move is much more likely to be met or even exceeded in a bearish primary trend. We’re not in a bearish primary trend, but probabilities are that mega-caps have about -1.15% more downside to go on this leg.
As mentioned in the Afternoon Update and this morning, there’s been a trend of selling growth/mega-caps/semis and then leaning in to sell cyclicals/value. There are quite a few cyclical sectors that ended today with bearish price charts (see the Afternoon Update) so I wouldn’t be surprised to see the semis and mega-caps get a break and selling pick up in cyclicals and Small Caps which will push the market more oversold than a day like today.
It’s easy to get bearish and want to jump in with both feet when markets get ugly, but when they’re this oversold, it’s a risky proposition. My view is that it’s still likely that when we do find some support, that support very likely ends up being the key level in top formations, or the neckline if these were to be H&S tops, which I’m not convinced of yet. If we get some decent signals that buyers are stepping in, I think we’ll most likely have some nice short term long trades, so long as you understand the game we’re in. CTA’s are the story today, but there are much bigger issues at play and 2024’s reflation is just one of them (perhaps an exacerbating one, but still just one).
A consolidation in yields and the dollar should help the averages bounce once the CTA’s are done doing their thing.
Overnight
S&P futures are up +0.1%
The U.S, Dollar index is unchanged.
WTI Crude Oil futures are unchanged.
Gold futures are down -0.3% and look like they’ve got more downside to go in the near term.
Bitcoin futures are up +1%.
Yields are on either side of unchanged, less than 1 basis point.
Thursday’s economic calendar futures:
- 8:30 ET: Weekly Initial Claims (prior 211,000), Continuing Claims (prior 1.817 mln), and April Philadelphia Fed survey (prior 3.2)
- 10:00 ET: March Existing Home Sales (prior 4.38 mln) and March Leading Indicators (prior 0.1%)
- 10:30 ET: Weekly natural gas inventories (prior +24 bcf)