3:15 p.m. ET
I’m getting this post out earlier than usual because I think today’s developments are huge and I want to be as clear as I can about them as they are happening.
Stocks are just as dull today as yesterday… painfully so. There’s not a lot of conviction on either side of the tape, leading the S&P 500 to trade in a roughly 15 point range (or 0.25%) between its intraday high and low. That’s super dull trade,
SP-500 0%, Dow +0.2% (Transports -0.3%), NASDAQ-100 -0.15%, Small Caps -0.05%
In context of a price-only perspective and the tactical long bias off mid-April lows, the most we can say about price action is that the up trend is intact and in consolidation.
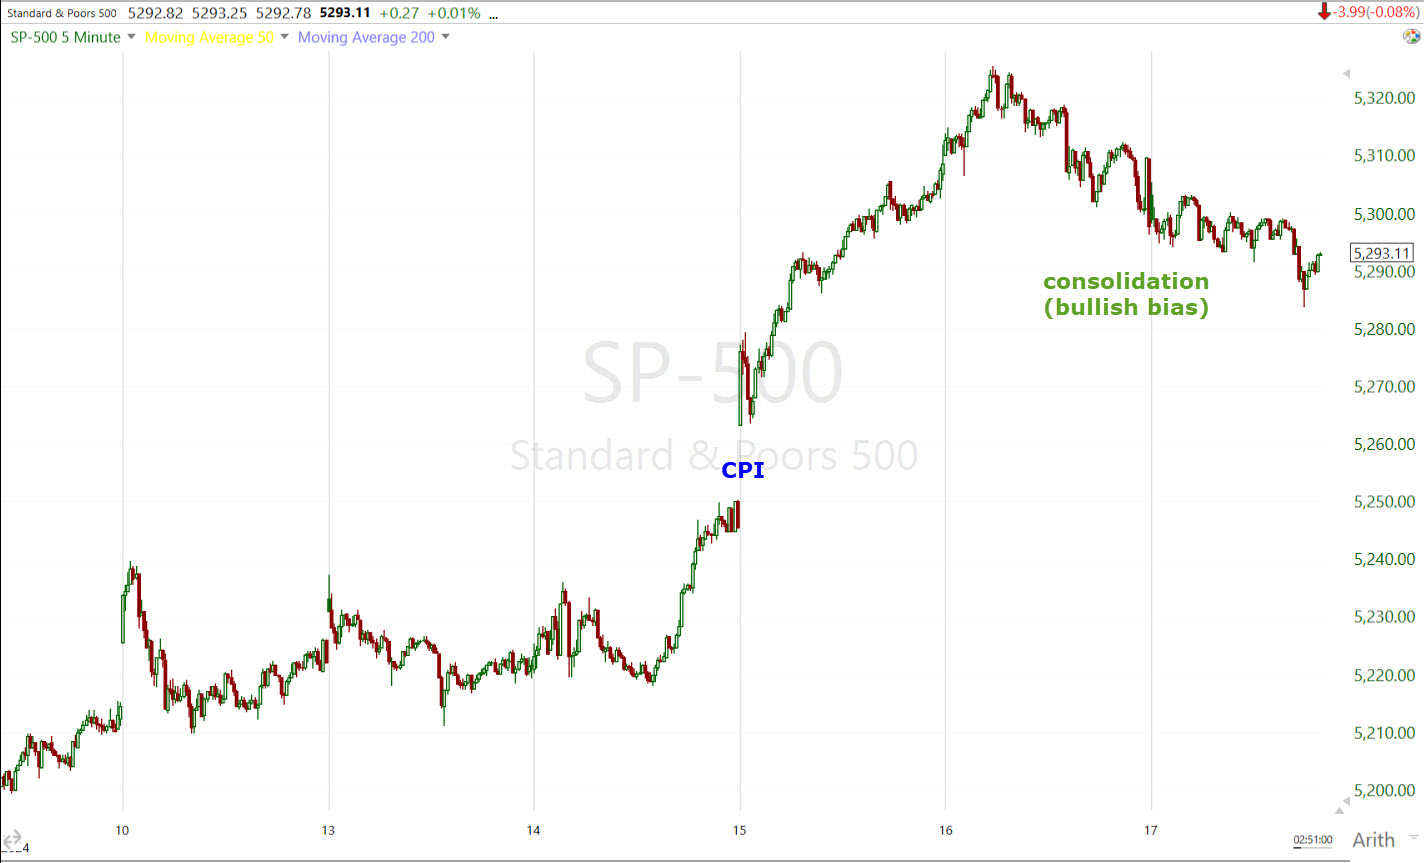 SPX (5m)
S&P sectors are split down the middle reflecting the low conviction. Aside from Energy, which trades up +1.45%, none of the sectors are moving more than 0.6% in either direction, and most less than a third of percent in either direction. The Energy sector has benefitted from the positive price action in commodity futures. WTI crude oil futures are up +1.1% to $80.07/bbl and natural gas futures are up 5.85% to $2.64/mmbtu.
Mega-caps (MGK -0.1%) are modestly lagging the Equal Weight S&P (0%) by 10 basis points.
Semiconductors (SOX -0.75%) underperform with Nvidia (NVDA -1.8%) and Broadcom (AVGO -1.5%) relatively weak after both show negative 3C divergences into price gains earlier in the week. More below.
Advancers/Decliners are nearly evenly split at NYSE and NASDAQ again reflecting a lack of direction/conviction and consolidation.
Cyclical sectors as a group are doing better today, but that’s almost exclusively driven by Materials and Energy due to commodities/precious metals gaining – although Financials have oved up on the leaderboard too.
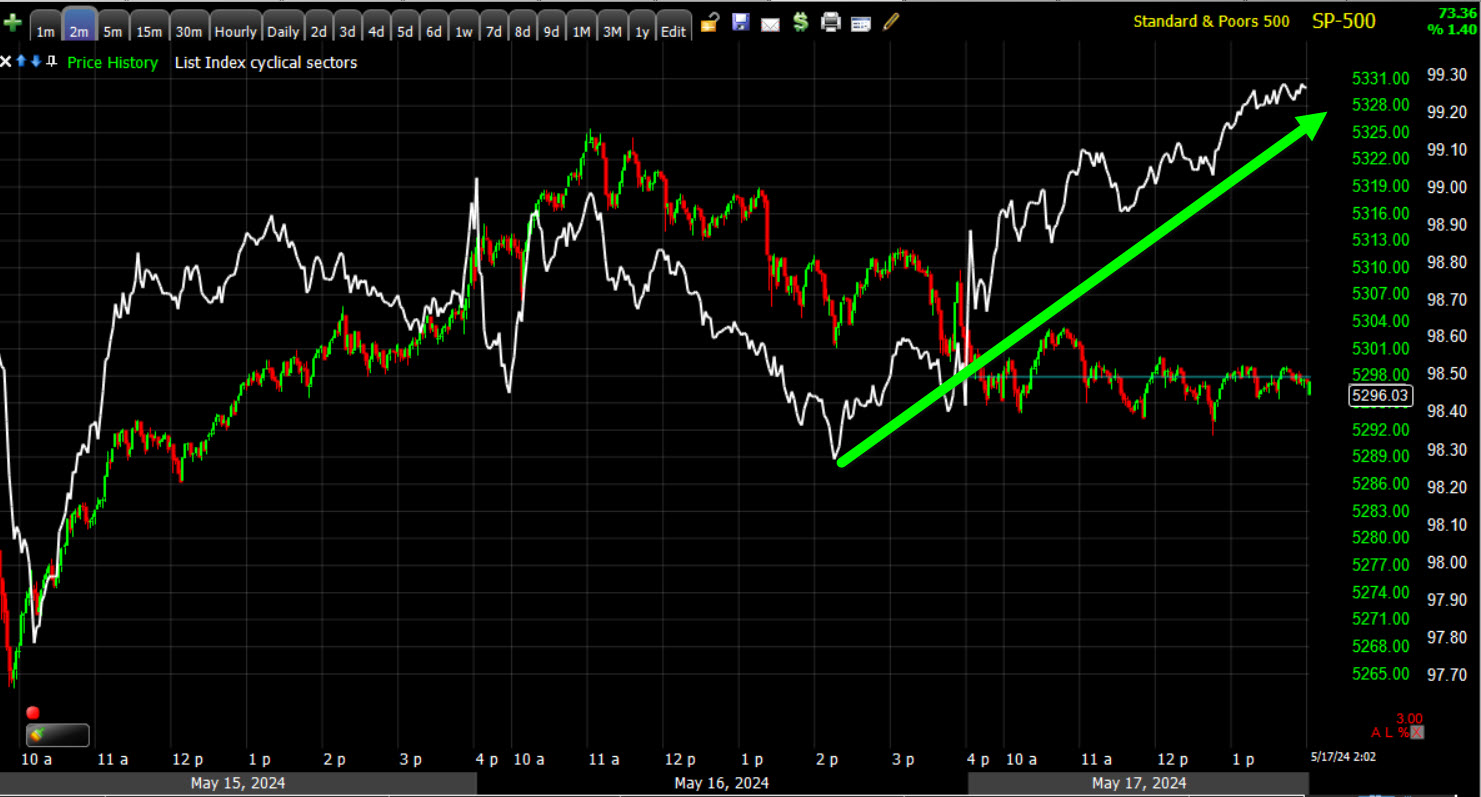 SPX (2m) and my Equal Weight Index of cyclical sectors- this is almost exclusively commodity gain related today.
Even more interestingly are the gains in metals with Gold futures up +1.35% and Silver making a hugely important move above $30 to trade up +5.6%. About half of silver supply is for industrial purposes vs. 10% of gold. In other words, the gains in silver, if they hold, will start filtering into costs/inflation.
Copper hasn’t made a new higher high, but there was a path to an uglier outcome earlier this week on a channel buster and thus far Copper has acted well since then, adding +3.8% today.
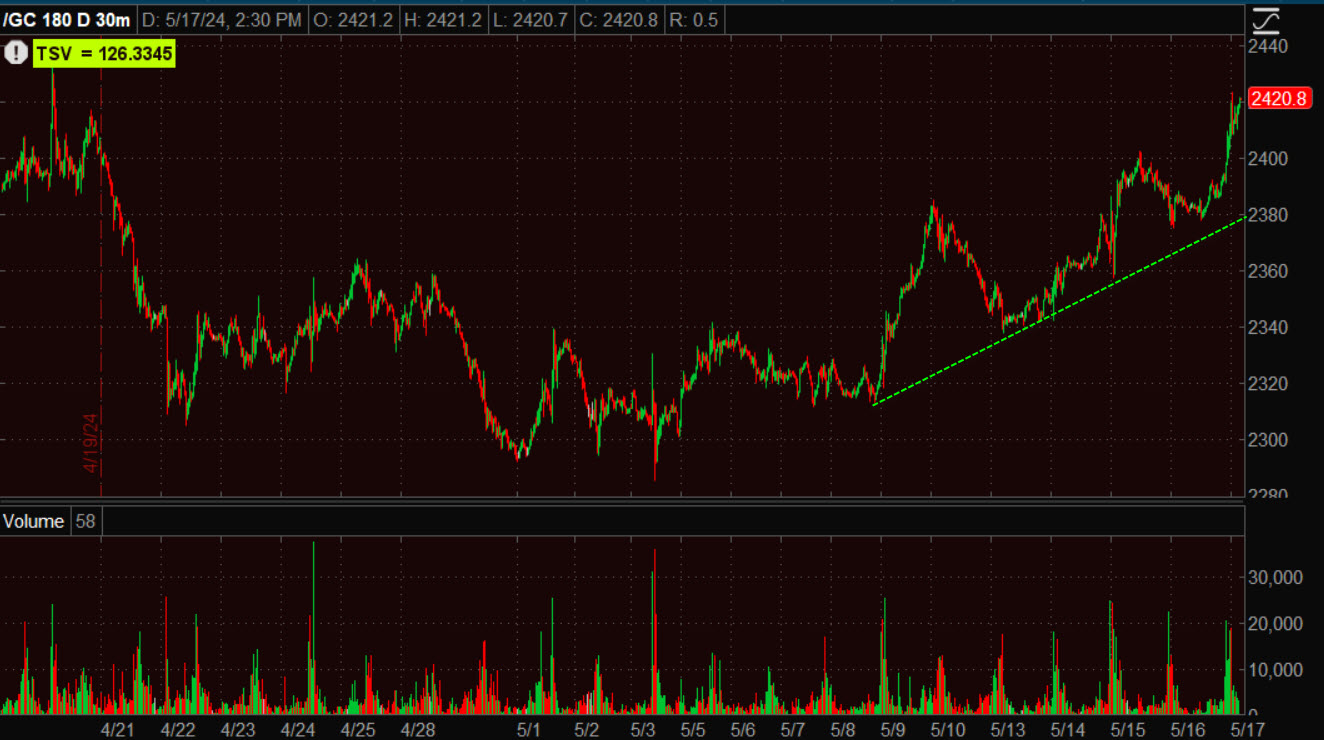 Gold futures (30m) – Still hoping to see volume pick up more notably on the upside move.
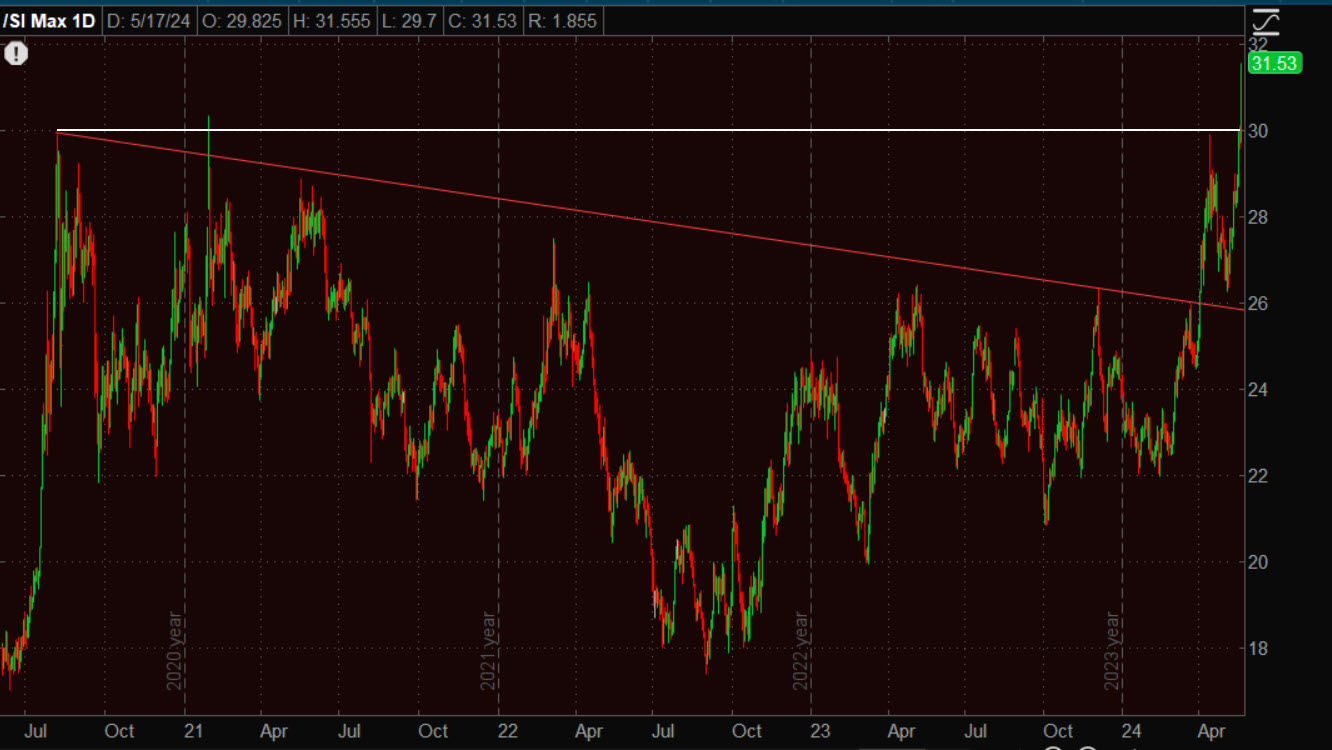 Silver futures (daily) with an important breakout above $30 on strong, bullish volume. Silver and gold have industrial uses, silver more so than gold so this is a more inflationary move.
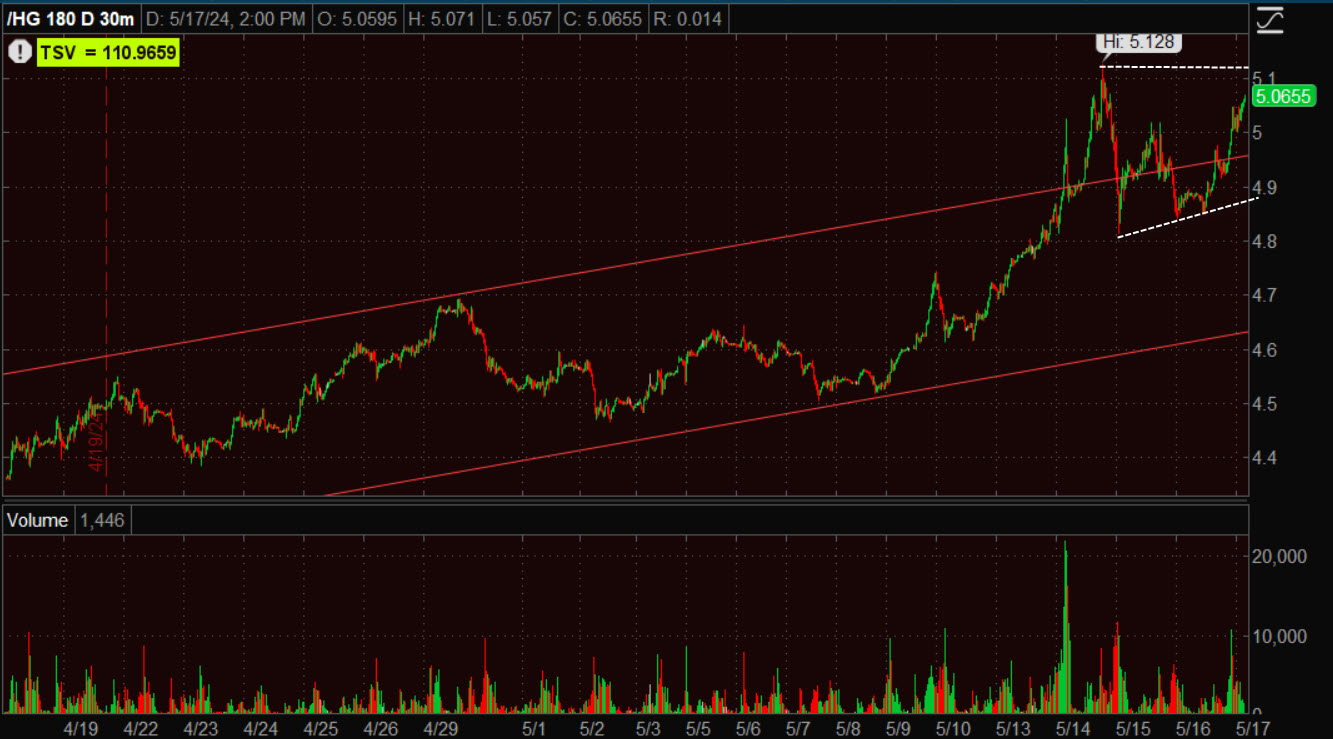 Copper futures (30m) acting well considering things could have gone the other way with a Channel Buster.
Inflationary? Yes. However, Crude is the biggie and WTI still needs to take out $79-$81 before resuming its reflationary trend.
 WTI (2m) holding the key trend line and making a higher high today.
Then we have other assets like Natural Gas futures up +5.6%, which allowed UNG (+5.15%) to slice right though its measured move.
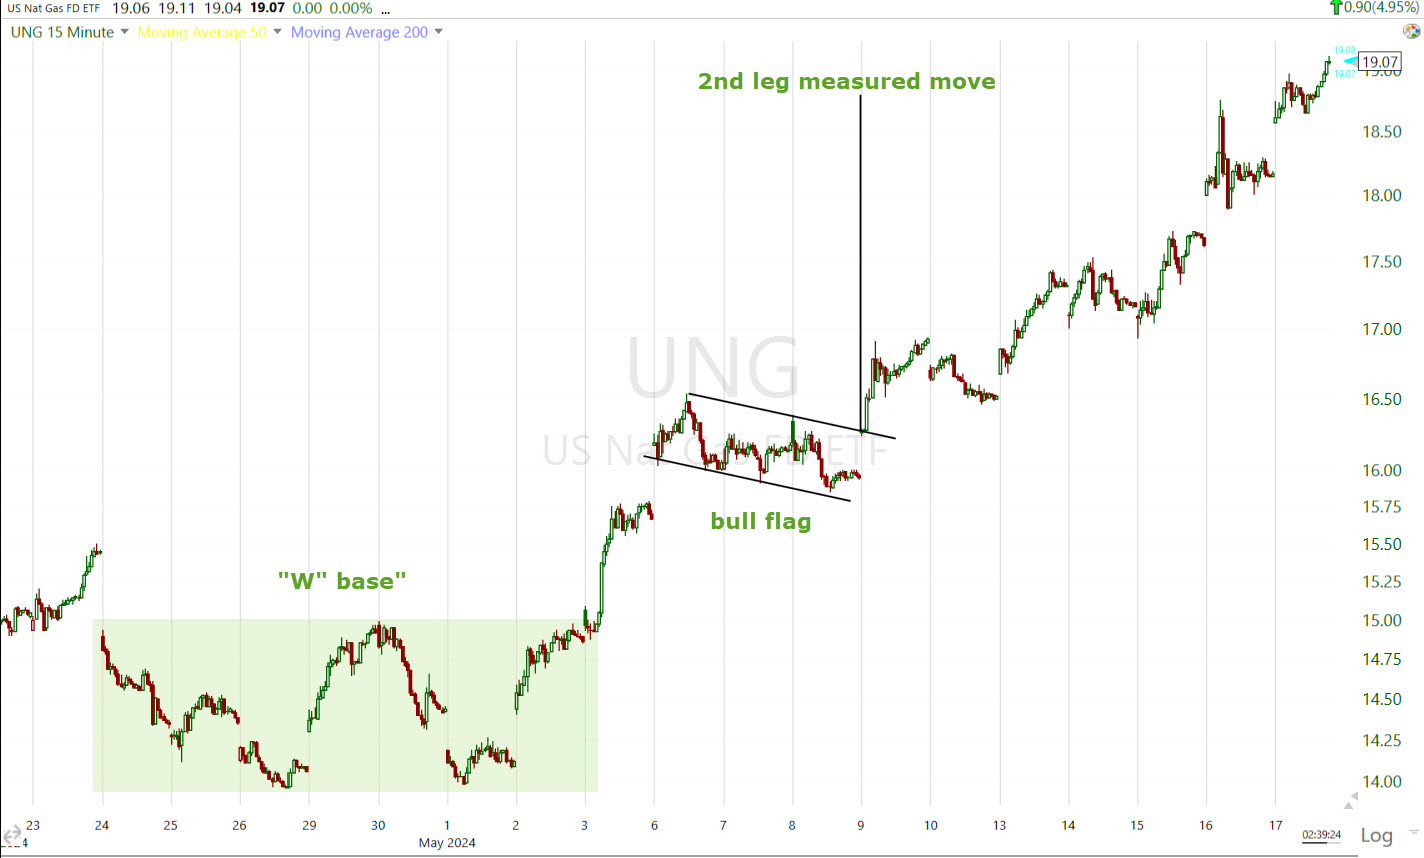 UNG (15m)
And Uranium ETF, URA up +3.85% breaking out above the key $32.50 level on excellent volume.
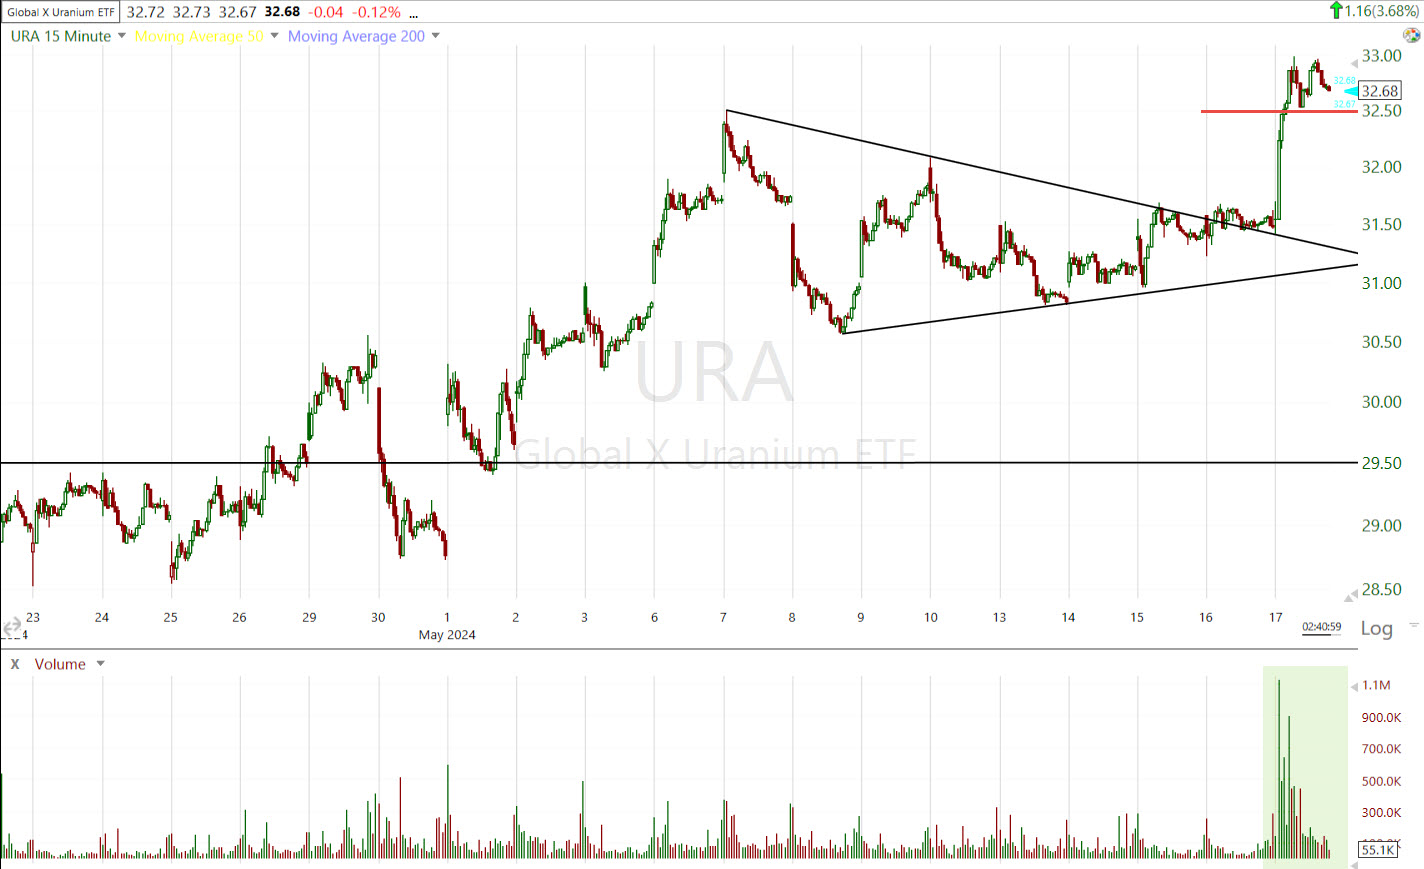 URA (15m)
It’s no wonder that Yields are creeping modestly higher with many commodities gaining. The 2-yr yield is up +3 bp and 10-yr up +4 bp.
These aren’t huge moves in yields, but given the decline in yields on a miniscule beat in headline CPI, and the vast gains across many parts of the commodity space, I think commodities rising here are a bigger deal than a slight miss in headline CPI (0.3% vs. 0.4% expected Mom) with 3 of 4 other CPI components coming in as expected, and Super-Core coming in hotter than expected, and that follows a hot PPI print Tuesday.
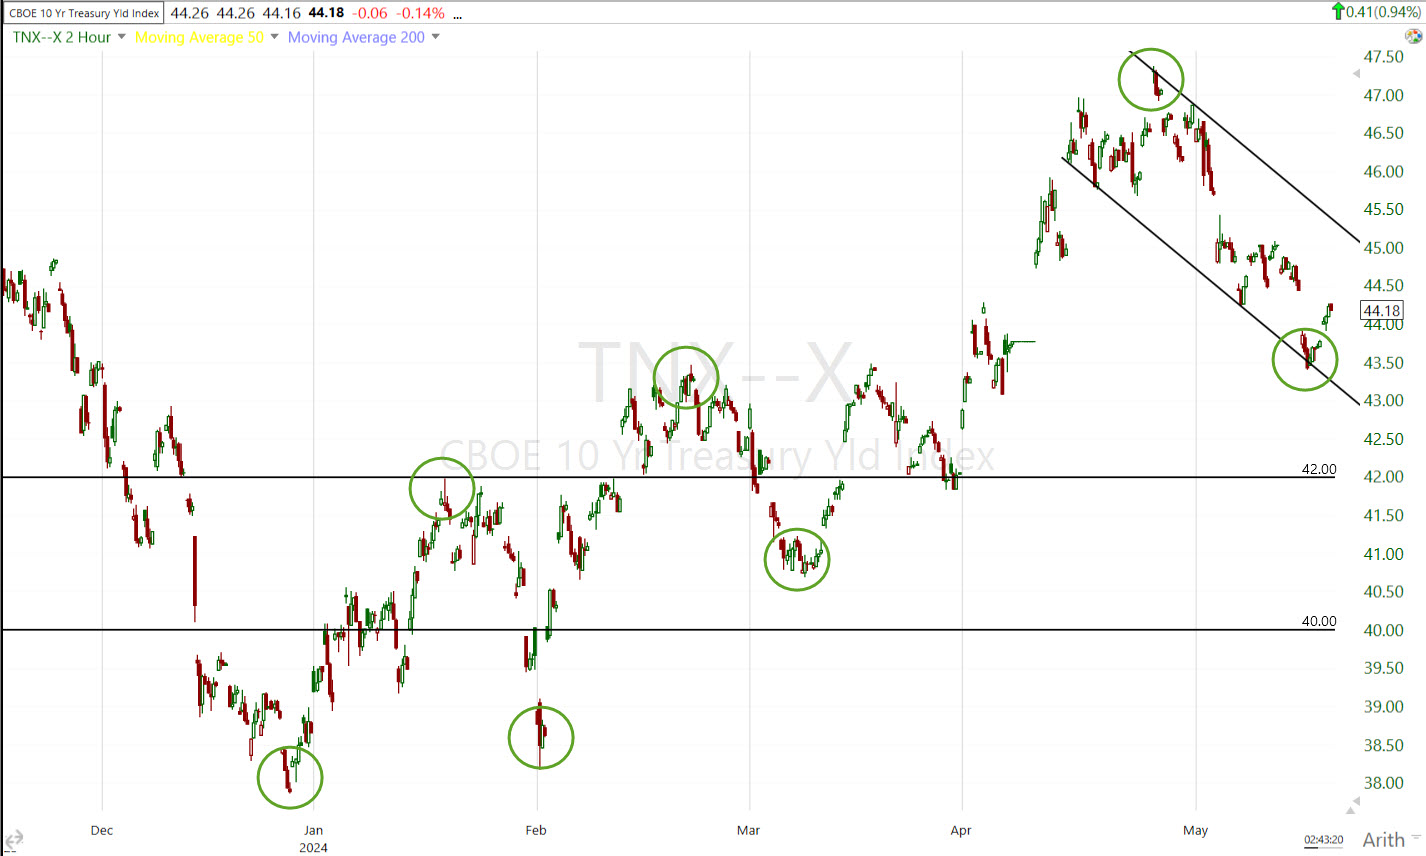 The 10-y yield’s 2024 inflationary impulse trend (higher highs/higher lows) is still intact.
A closer look…
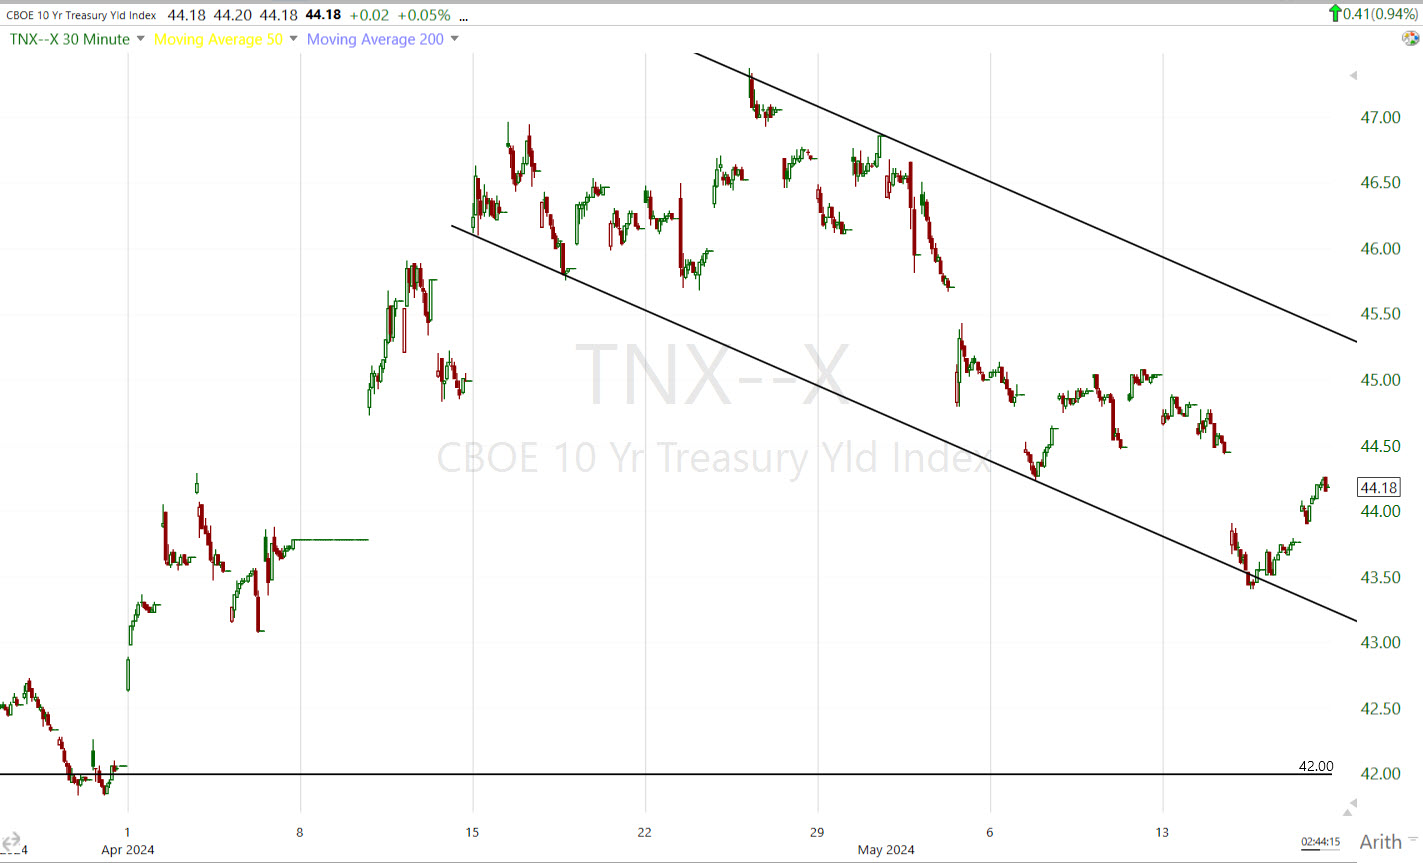 10-yr yield (10m) It’s exactly this pull back in yields (along with oil) that created the window of opportunity for stocks to rally off mid-April lows. Is it nearing time for the up trend to reassert itself?
The jump in commodities suggests a higher probability now than at any point over the last month…
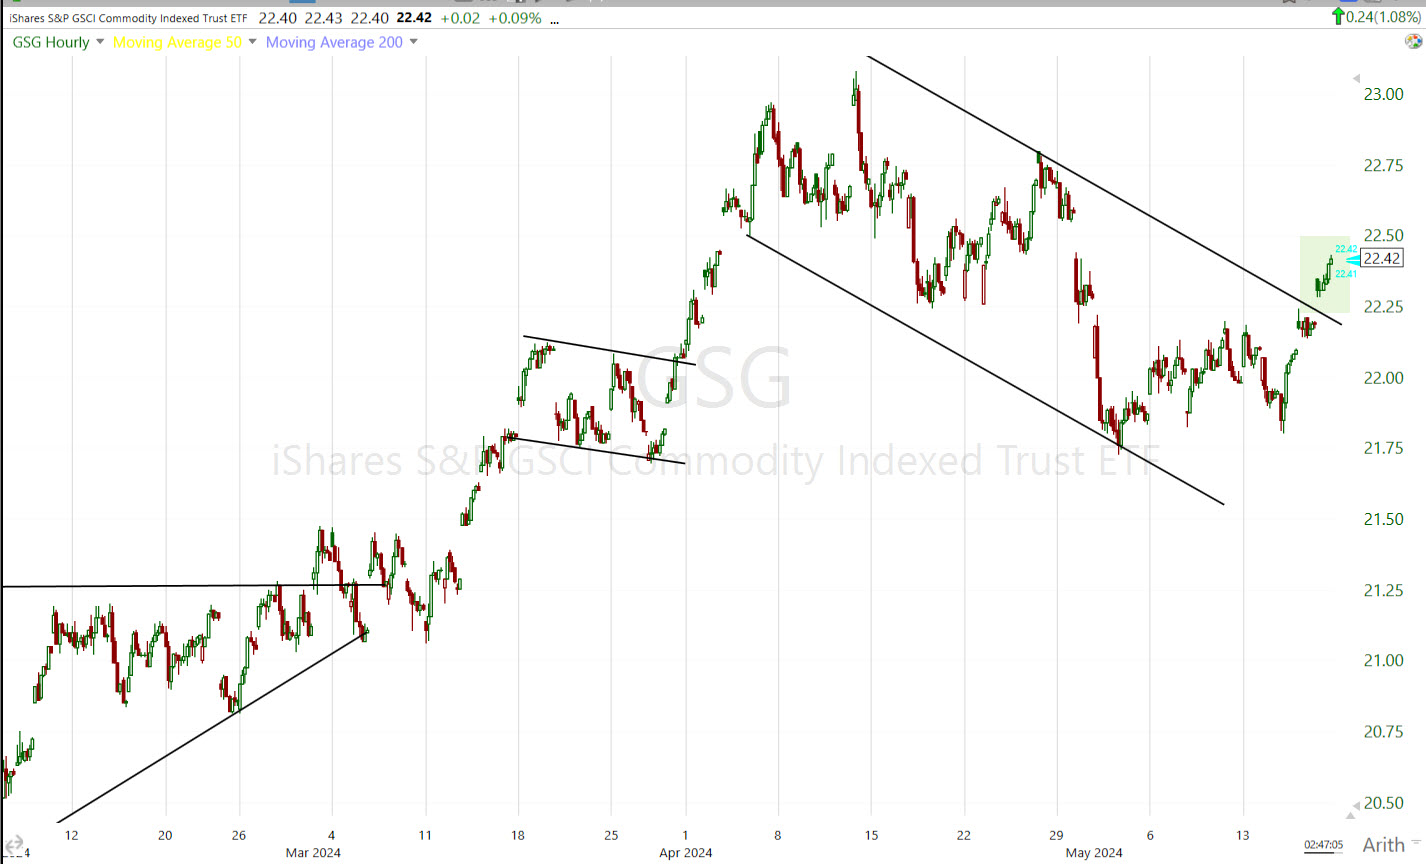
Commodity index w (60m) with the same pull back as yields and oil is starting to breakout suggesting the answer is increasingly yet, but ultimately Crude oil trading higher seals the deal.
Especially given today’s action, I think my chart of the Copper:Gold ratio from last night’s Daily Wrap is even more important, and this is with Gold acting better than I’d normally expect.
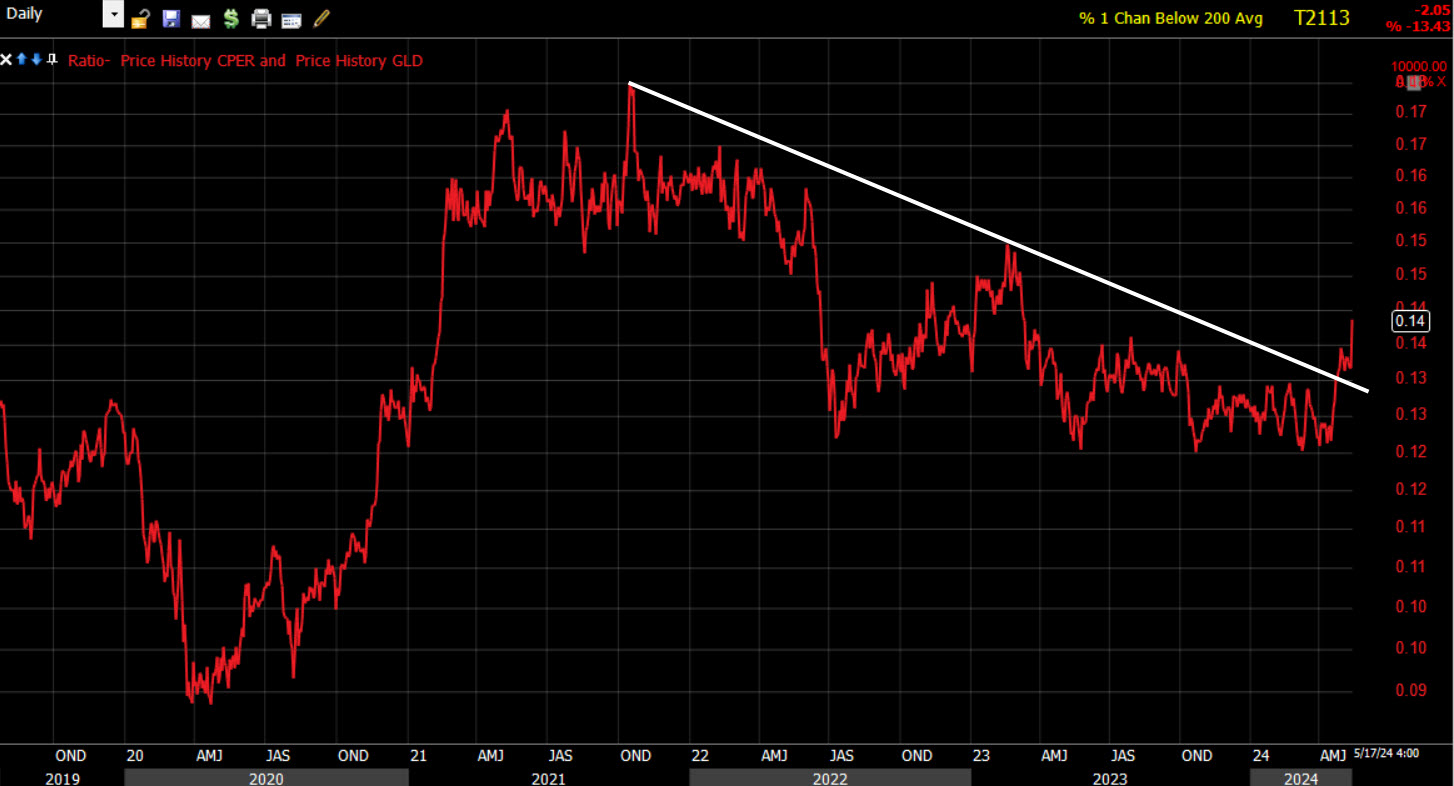
(daily) From a disinflationary trend (white) to starting to breakout back to an inflationary impulse. This is not a trading indicator, but a macro indicator so this move may not look extreme, but it’s an important trend change, and again, I don’t think 1 month of headline CPI just shy of consensus makes the case that the 2024 reflation impulse is done and dead in the water.
As for short term (1m) 3C charts on the week, nothing stands out as important and pretty much in line with price action that’s entered a modest consolidation phase.
 SPY (1m)
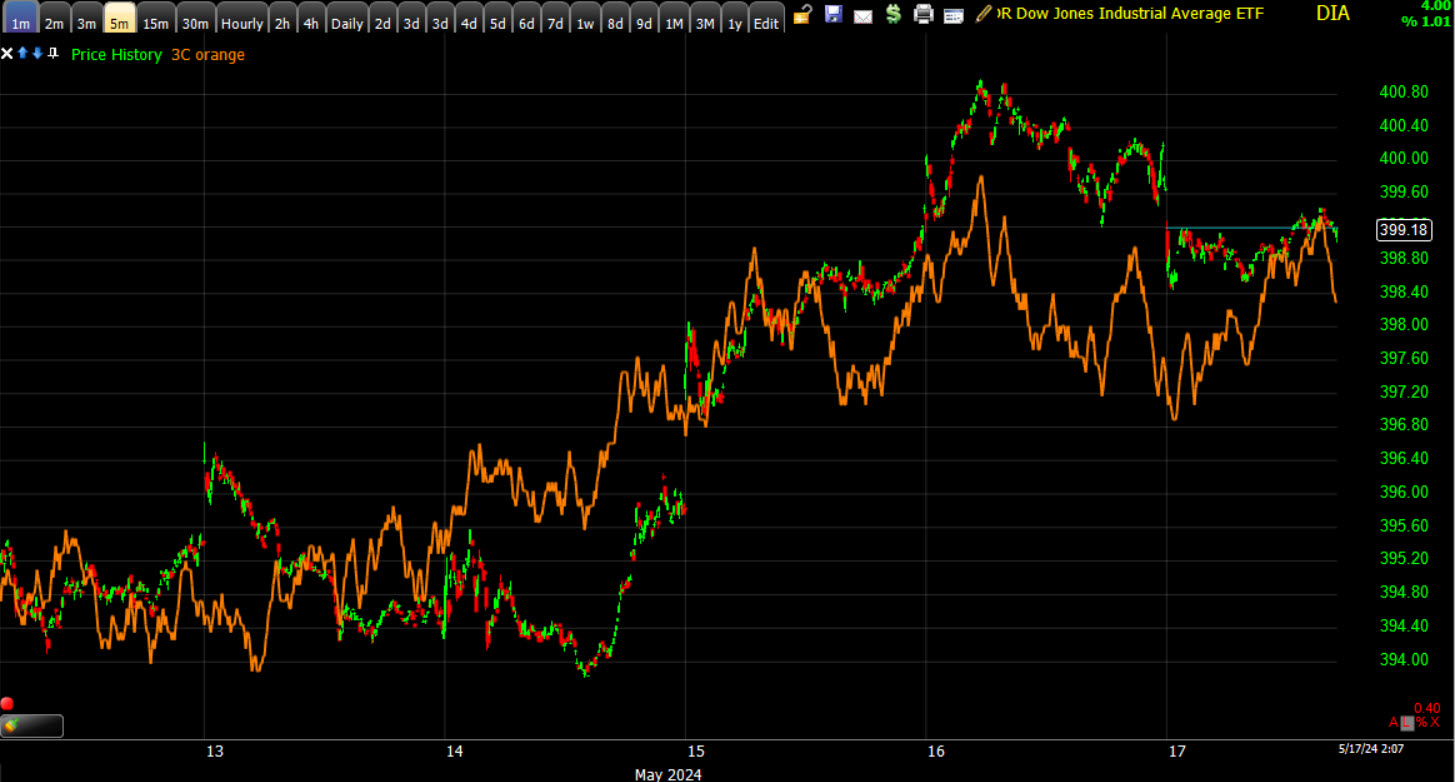 DIA (1m)
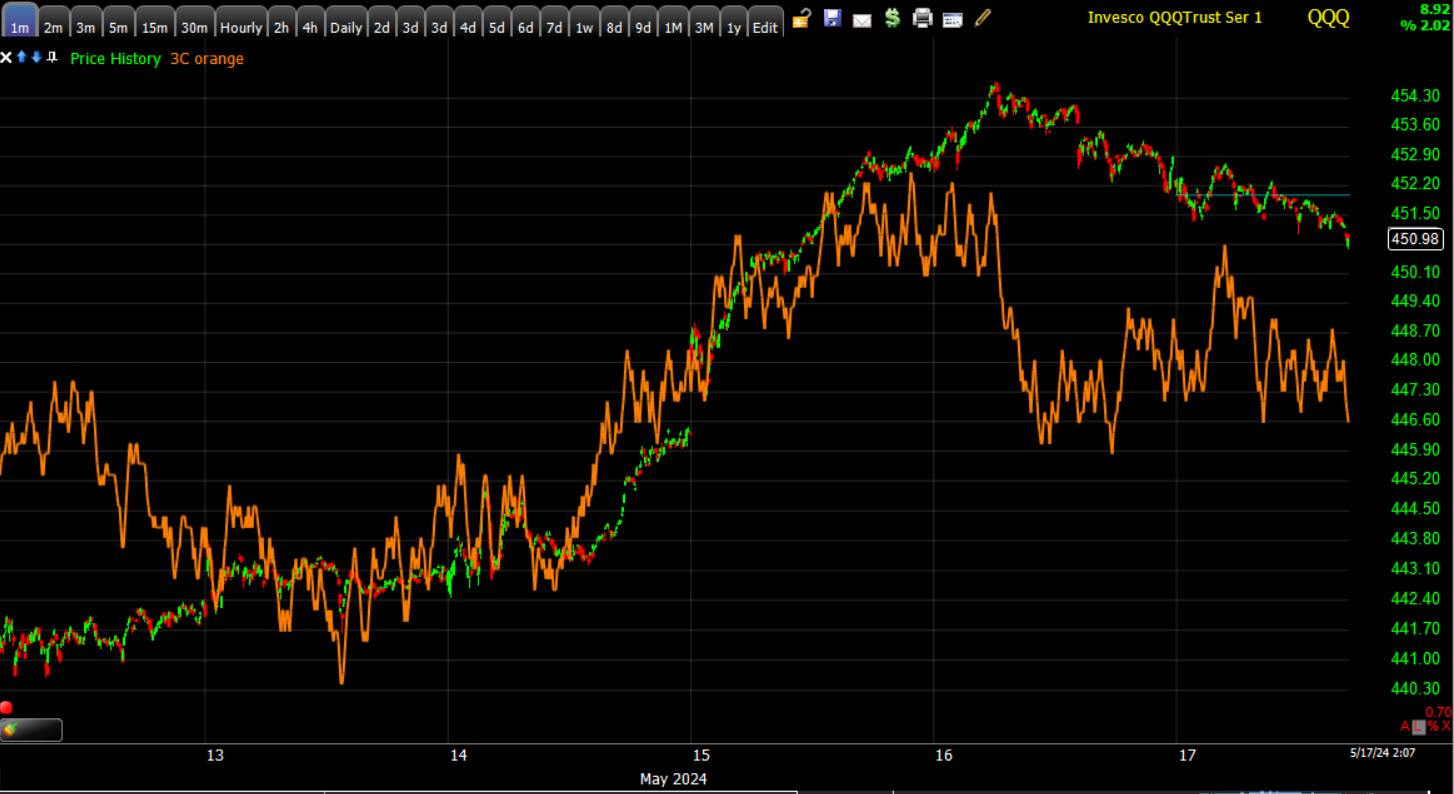 QQQ (1m) slightly weaker, but nothing that raises immediate alarm bells, and very much consistent with the consolidative correction in play since yesterday.
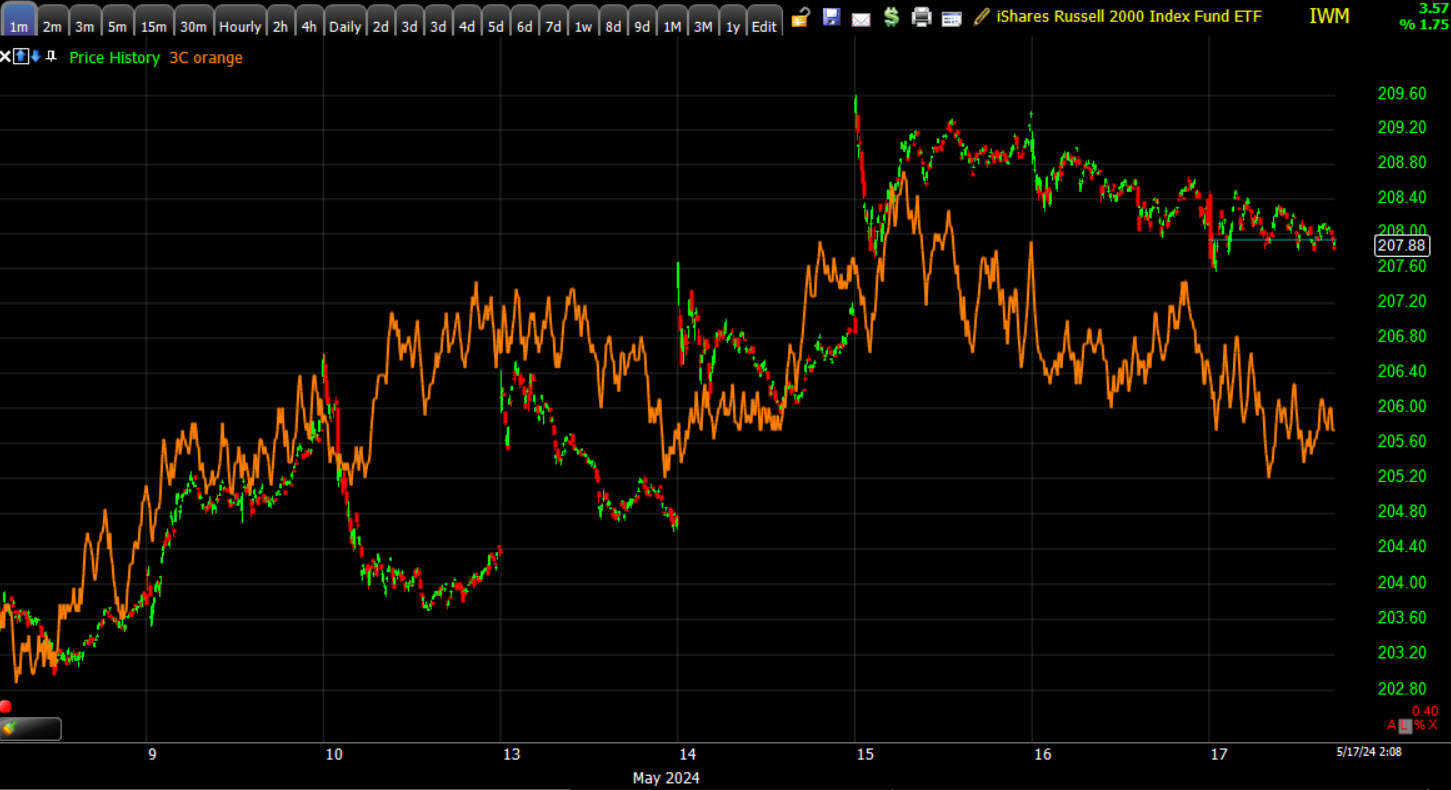
IWM (1m) – same story.
With regard to the tactical long price trend off the market’s CTA selling April lows…
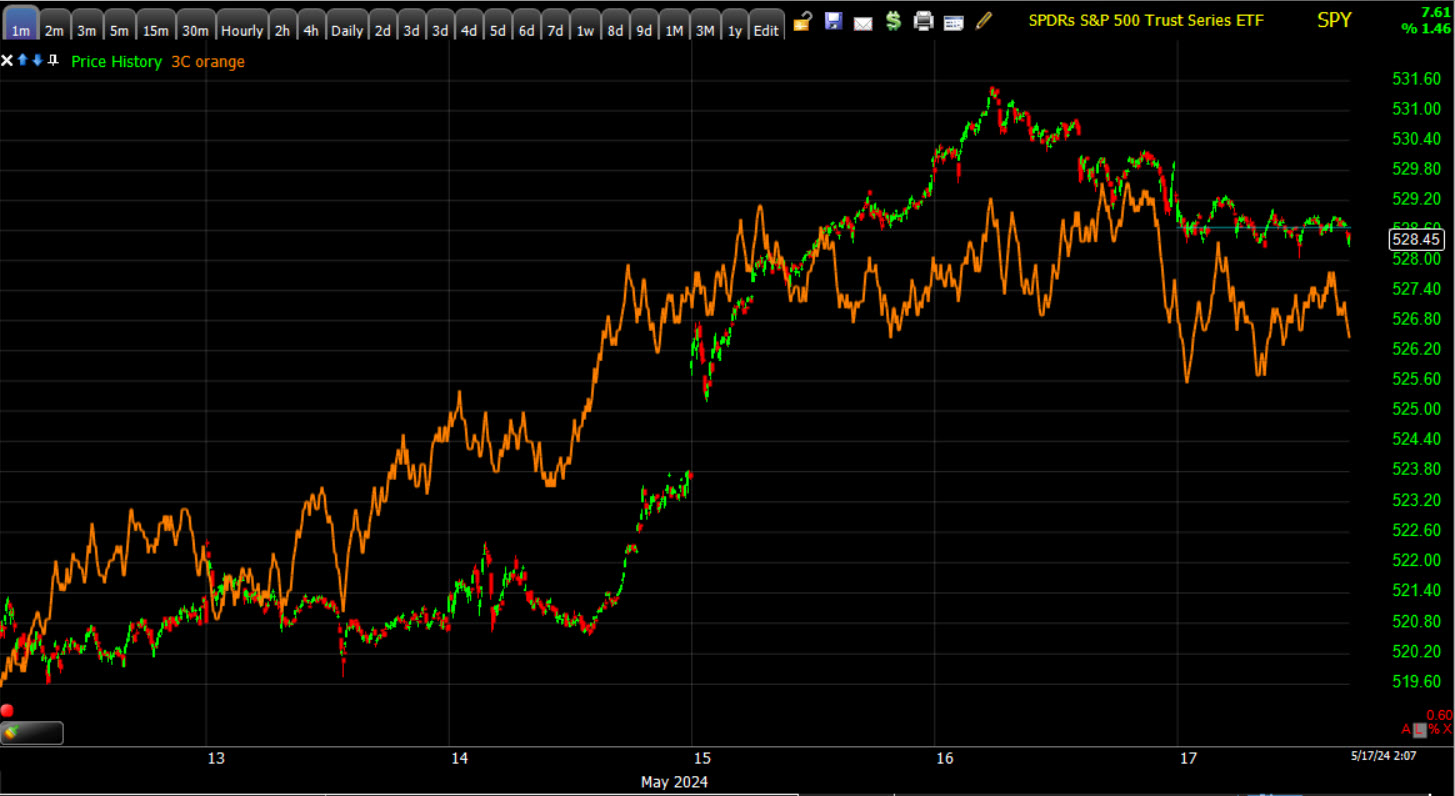
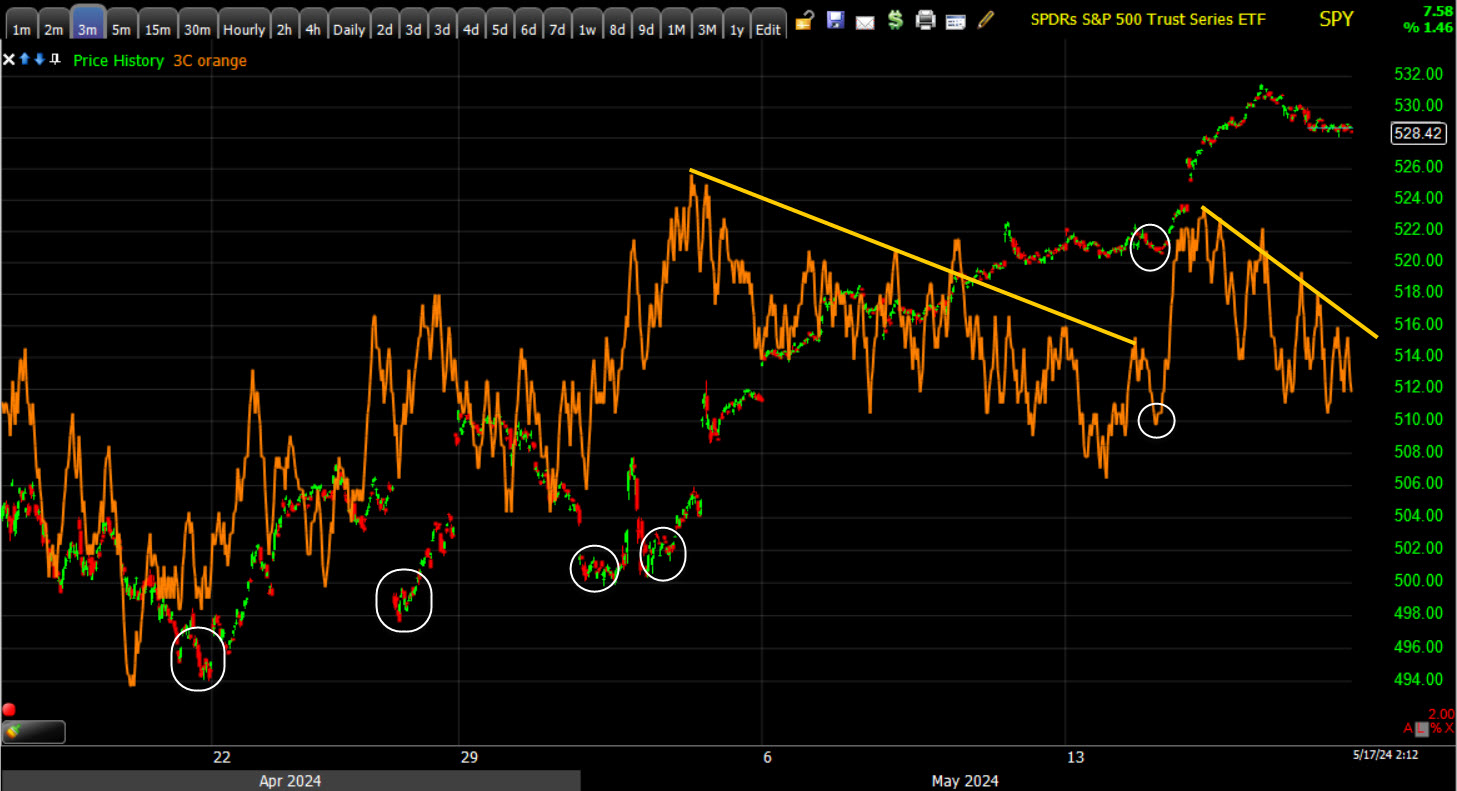 SPY (3m) positive 3C divergences in white backing the trend of higher price highs and higher price lows, but 3C has not made a new higher high with price with 2 relative negative divergences (yellow), neither of which is trend changing, but depicts typical distribution in smart money selling into higher prices.
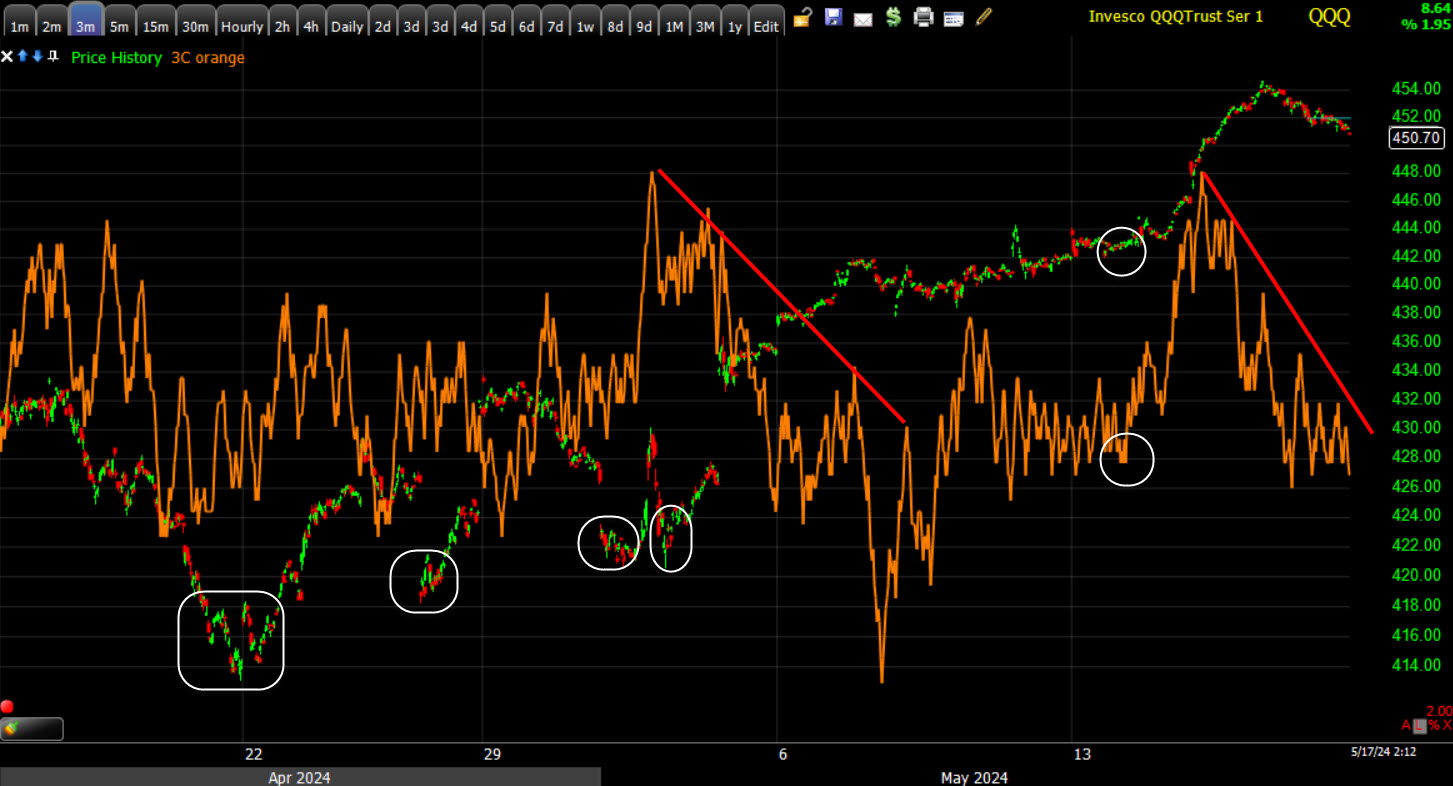 QQQ (3m) same timeframe/scale with similar signals, but a clearer trend of selling into price gains when they materialize. This may not be hat I’d call a sell signal yet, but it gives us important information as to what’s happening with underlying flows that can contradict price.
Semiconductors were the first this week to stand out in that respect. First the more sensitive short-term 3C timeframe (1m)…
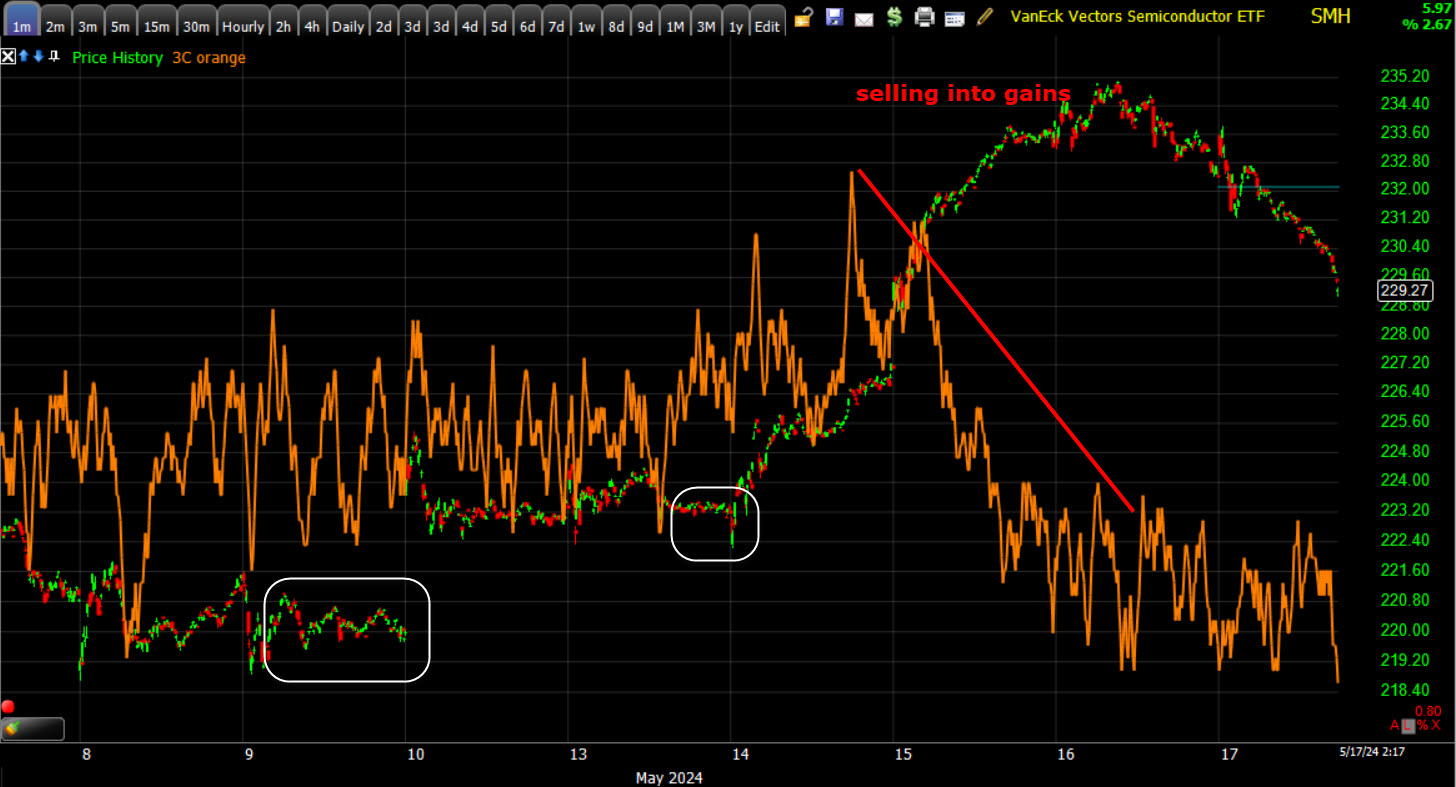 SMH / Semis (1m) with modest positive divgernece, like all of the averages over the same period (white) and when there’s a decent gain that smart money can sell into without pushing price against their positions, they are.
And the 3 min 3C trend off April lows…
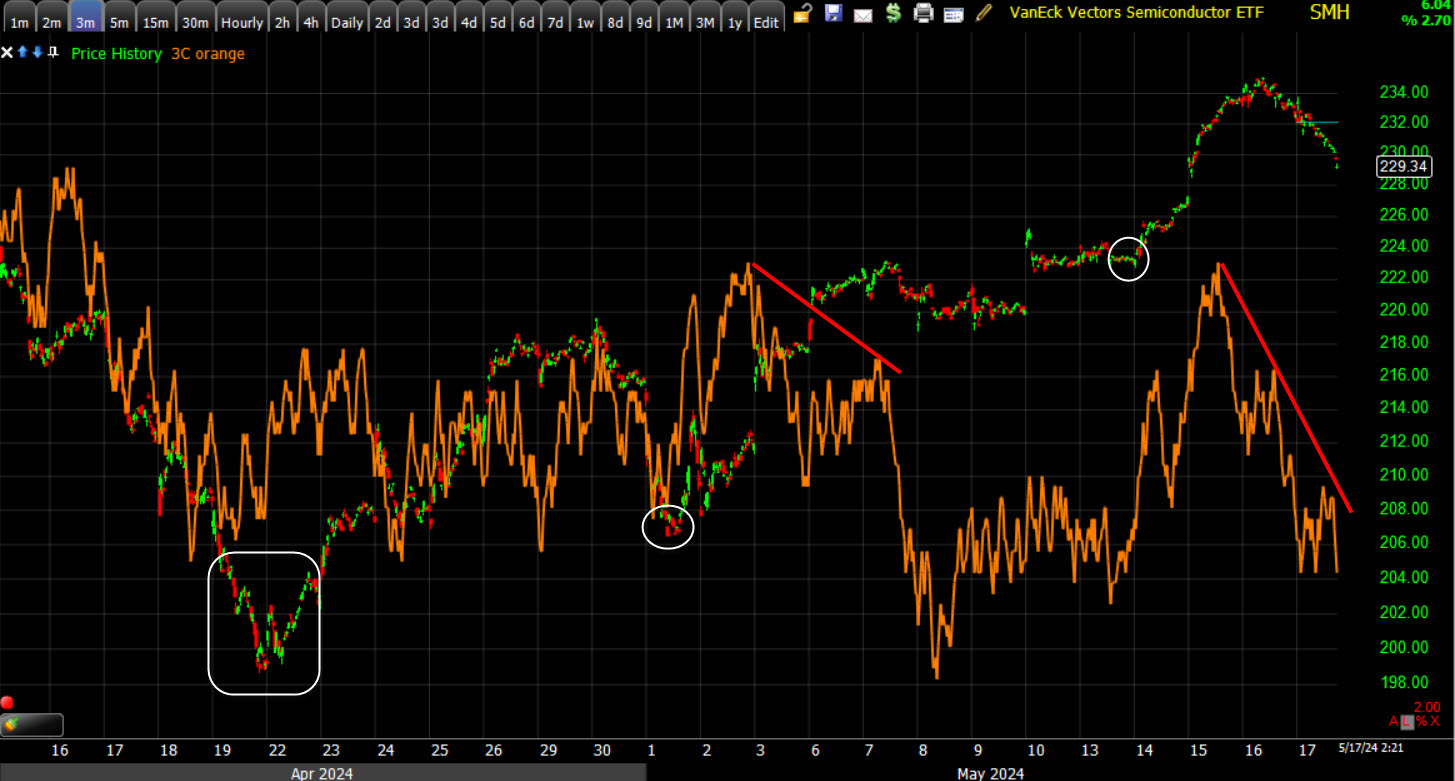
SMH (3m) positive (white) at April lows and modest positives since, but when there’s a decent advance, that’s being use to unload shares.
And I’m getting confirming 3C signals in semis like Nvidia and Broadcom. NVDA reports earnings Wednesday after the close so we could get some volatility around that.
Mega-caps have a similar trend…
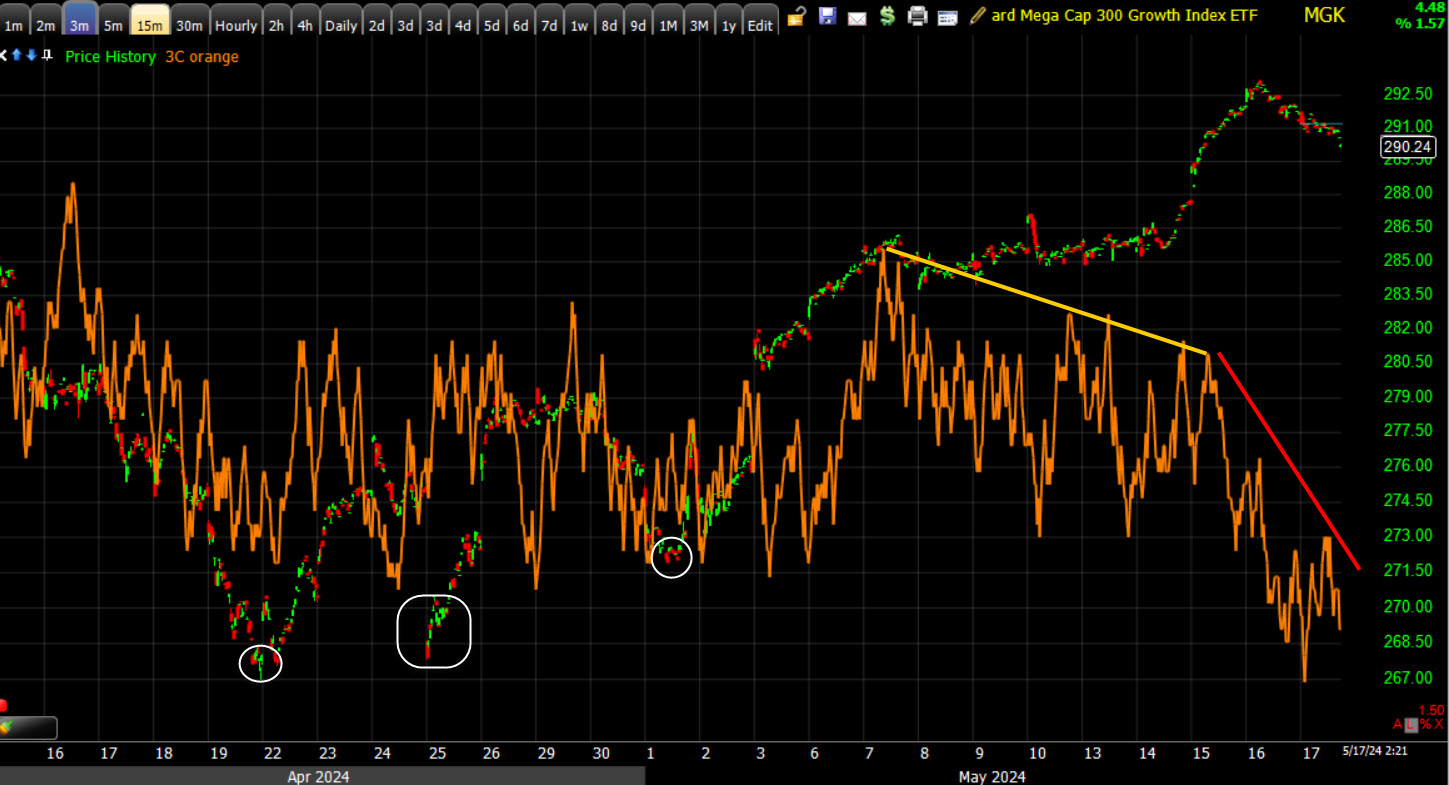 MGK (3m) off April lows with small pos. div’s, just enough to support price advances, but then bigger bouts of selling into price strength. This is classic toppy pattern distribution in the most important stocks with the largest or highest concentration positioning in a century, meaning positions that large on an intuitional basis are not going to be unwound in a week or two… It’s process, not an event and it’s been so extreme that none of us have seen this kind of market concentration in a few names, unless you’re some 120 years old.
I don’t feel that it’s time to make a downside short sale call on the averages yet, but the evidence is mounting that we’re heading in that direction. Despite the majors putting in new record highs, as pointed out earlier this week in the Discord room chat conversation, I’ve seen very few bear markets that weren’t first preceded by all time record highs first (2021/early 2022 was the most recent example). It seems counterintuitive, but it’s seen over and over again going back over a century of market price data I have access to.
What I’m more interested in today is the surge in commodities, which if it keeps up, puts the month-plus pullback in inflationary assets back on track for a renewed advance and with that, the resumption of 2024’s inflationary impulse – including higher yields. The overwhelming feeling I get from the week’s price action, having met measured moves, was that the market knee jerk reaction to a almost meaningless headline CPI MoM slight miss, is an overreaction missing the big picture that seems to be resuming with commodities surging. Crude oil is still the top of my list in that regard. Should crude breakout back above $81, I think it’s back on.
And we have a lot more commodities and PM’s now surging since then.
While the equity market is dull, there are huge developments in commodities and thus on the inflationary front. I think the week’s developments in commodities, and especially today’s are far more important than 1 month of headline CPI barely missing expectations.
If anything exciting pops up before the close I’ll send out another update. Otherwise have a great weekend.