From Wolf on Wall Street – Trade
Today’s session started sluggish in front of the Federal Open Market Committee (FOMC), which voted in favor of cutting the target range for the fed funds rate by 50 basis points to 4.75-5.00%. It was not a unanimous vote. Fed Governor Bowman dissented, preferring a 25-basis points rate cut. Dissents are rare.
As mentioned last night, ironically, the Fed cut by the same amount, coming from the same FFR level, on the very same day, 17 years ago to the day in 2007.
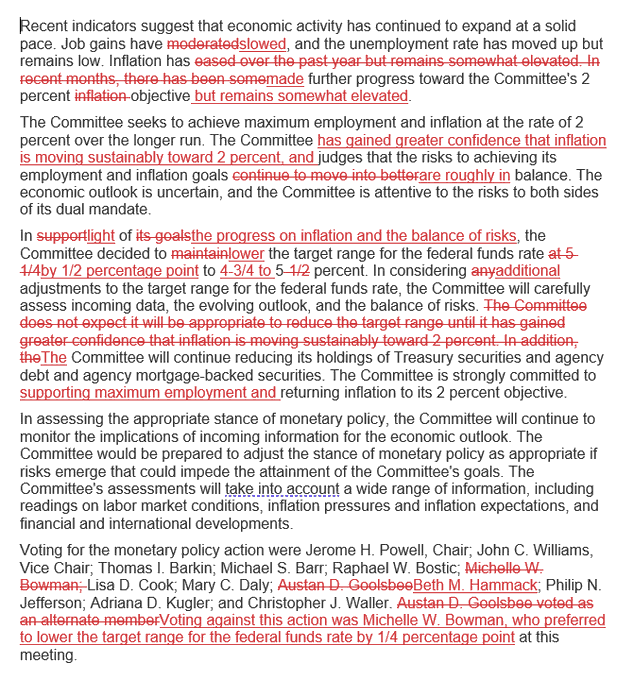
The policy directive indicated that the Committee has “gained greater confidence that inflation is moving sustainably toward 2 percent, and judges that the risks to achieving its employment and inflation goals are roughly in balance.” Here’s the directive with changes from the last meeting redlined.
The Summary of Economic Projections (SEP) showed a shift in the median estimate for the 2024 unemployment rate to 4.4% (from 4.0% in June) and a downward shift in PCE inflation to 2.3% (from 2.6% in June) and core-PCE inflation to 2.6% (from 2.8%). The dot-plot shows a median estimate for 2024 (4.40%) that implies another 50 basis points of rate cuts this year and another 100 basis points in 2025.
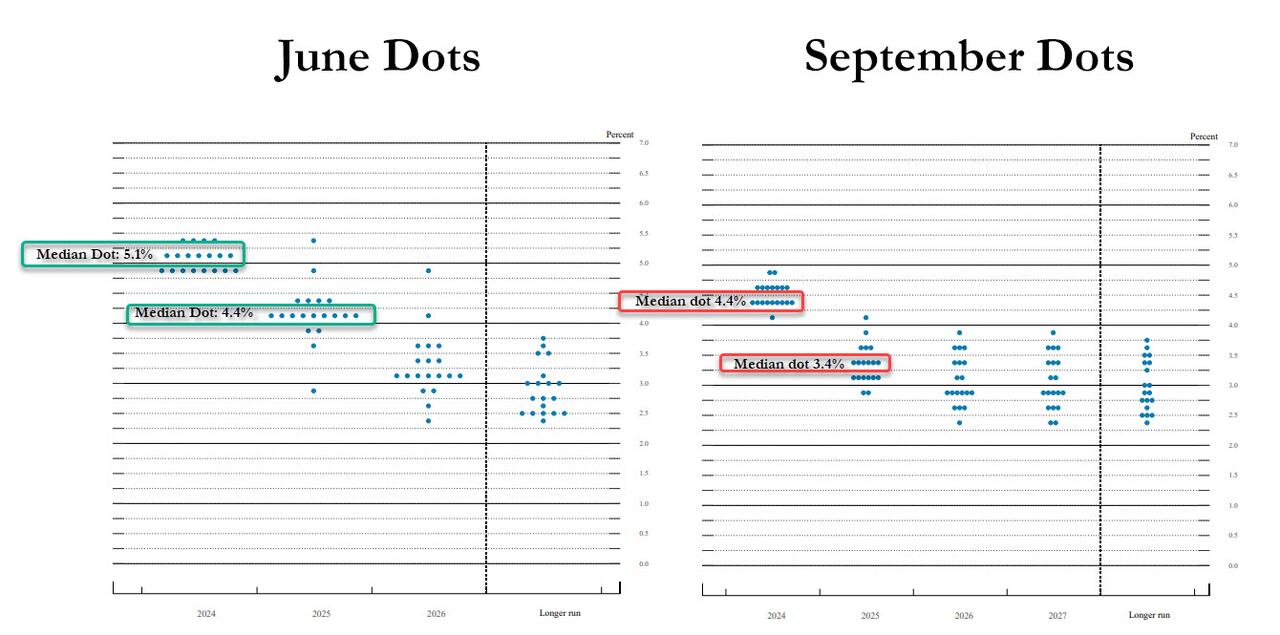
That’s a big shift in the Dots from the last SEP in June.
During Powell’s press conference he said,
“The US economy is in a good place and our decision today is designed to keep it there,”
That 50 basis points couldn’t have anything to do with nearly a million jobs revised away, could it? Not according to Powell. The first question in Powell’s presser was what information caused the FOMC to opt for the larger cut, and Powell mentioned the Beige Book.
The economists were largely wrong, at least all but 9 of the 114 that Bloomberg surveyed, who expected a 25 basis point cut. Sometimes people are so smart that you have pull them in from the rain. By now you probably know that the Fed has their channels to leak to the market, especially when they’re in media blackout. You don’t need to be an economist, you just have to know who the Fed leaks to. Chief among the Fed leakers is Wall Street Journal’s, Nick Timiraos. While Nick isn’t going to come right out and tell us that someone at the Fed told him so, he put 50 basis points out there last week when the market had written it off. There have been 4 or 5 other sources that have done the same over the last week, including this weekend. The market discounted 50 basis points last week with the S&P adding +2.4% from Tuesday’s close to Friday’s close, most of that came Wed-Thurs.
I have my opinions about the Fed’s move, the very real potential for an inflationary rebound, the Fed’s political independence and a lot more, but it’s not my job here to bloviate. My job is to forecast probabilities to the best of my ability, and give you the concepts and tools to do the same. However, I will say that this press conference was probably the most awkward and tongue-tied I’ve seen from Powell. When asked what a 50 bp rate cut will do to housing inflation with home prices (and rents) already at record highs, despite 6.5% to 7% 30-yr fixed mortgages, he stumbled and mumbled through the answer, ultimately landing on, the Fed can’t fix the housing market, leave it to the government! Make of that what you will, but I found Powell to be unusually awkward in the presser.
Economic data:
- The weekly MBA Mortgage Applications Index rose 14.2% with refinance applications surging 24% and purchase applications jumping 5%
- Housing starts increased 9.6% month-over-month to a seasonally adjusted annual rate of 1.356 million units (consensus 1.320 million), bolstered by a 15.8% increase in single-unit starts. Building permits increased 4.9% month-over-month to a seasonally adjusted annual rate of 1.475 million (consensus 1.415 million), aided by a 2.8% increase in single-unit permits.
- The weekly EIA Crude Oil Inventories showed a draw of 1.63 million barrels following last week’s build of 833,000 barrels
Averages
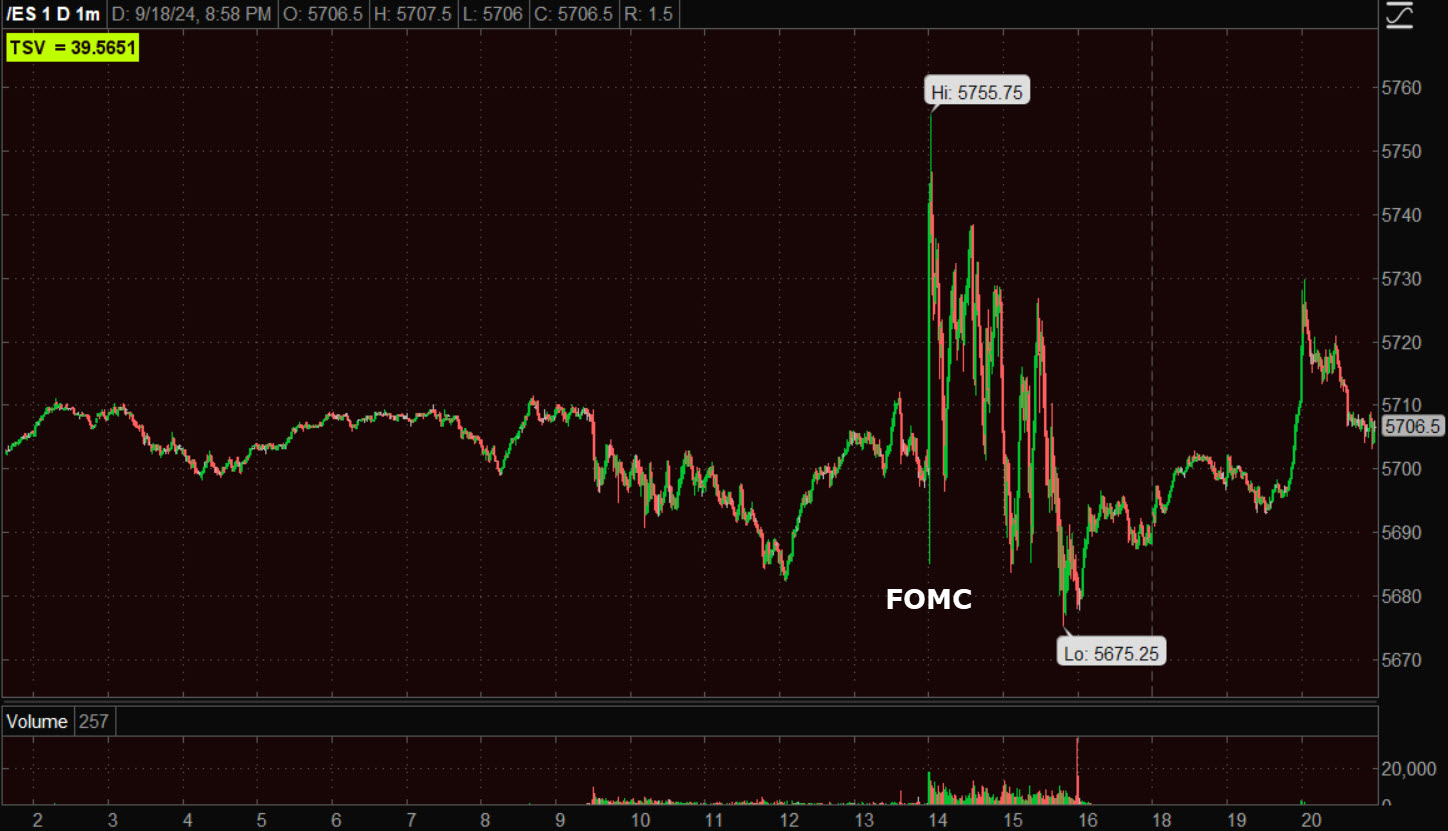
There was some kneejerk trade in the stock market and the Treasury market after the FOMC announcement and as Powell conducted his press conference at 2:30 p.m. ET. The averages ended mixed, but mostly modestly lower, closing at or near the low of the day.
S&P-500 ⇩ -0.29 %
NASDAQ ⇩ -0.45 %
DOW JONES ⇩ -0.25 %
RUSSELL 2000 ⇧ 0.04 %
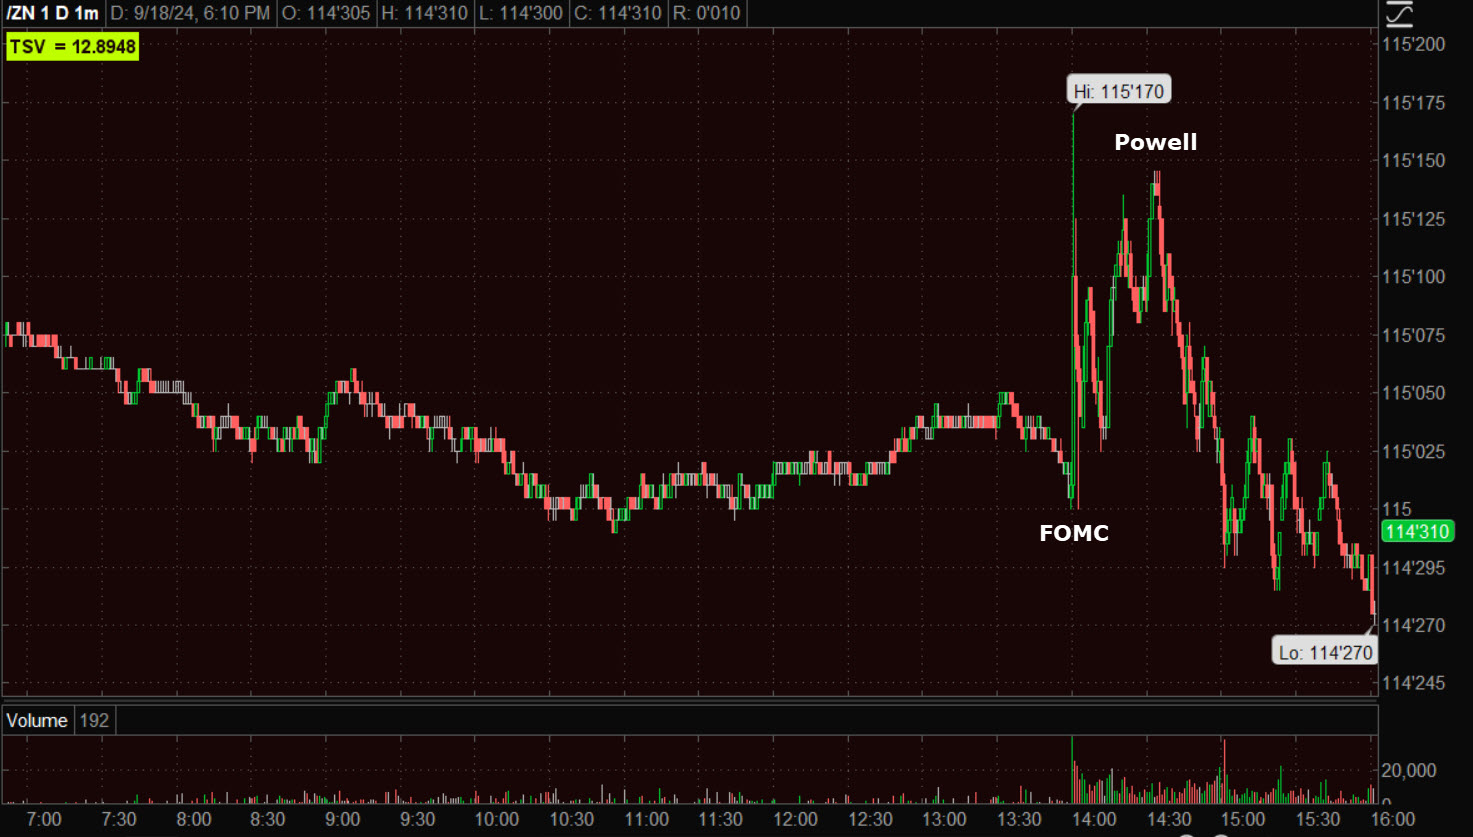
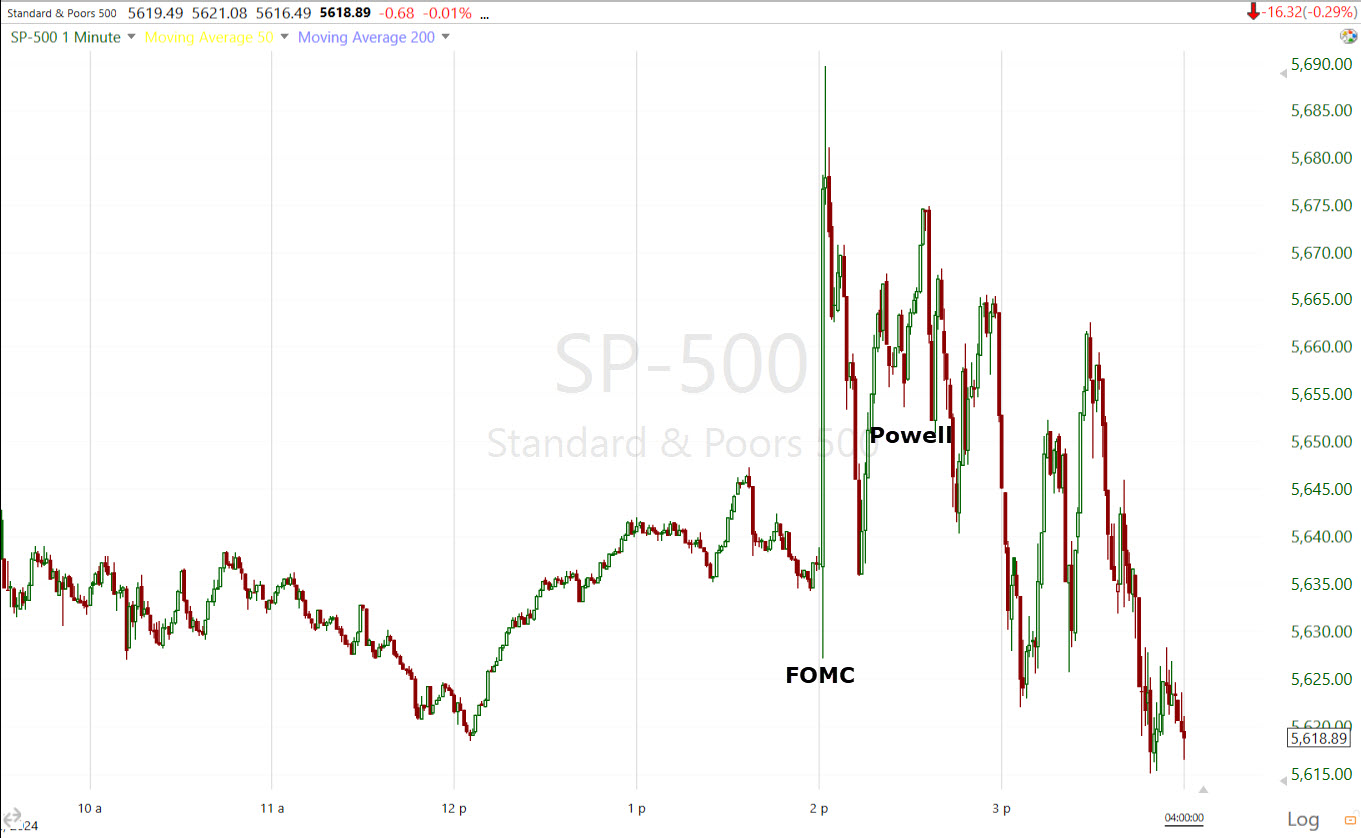 SPX (1m today) knee-jerk price action around the Fed. As I always warn ahead of the FOMC, “Be ware of knee-jerk reactions”, and “Watch the Dollar and rates.”
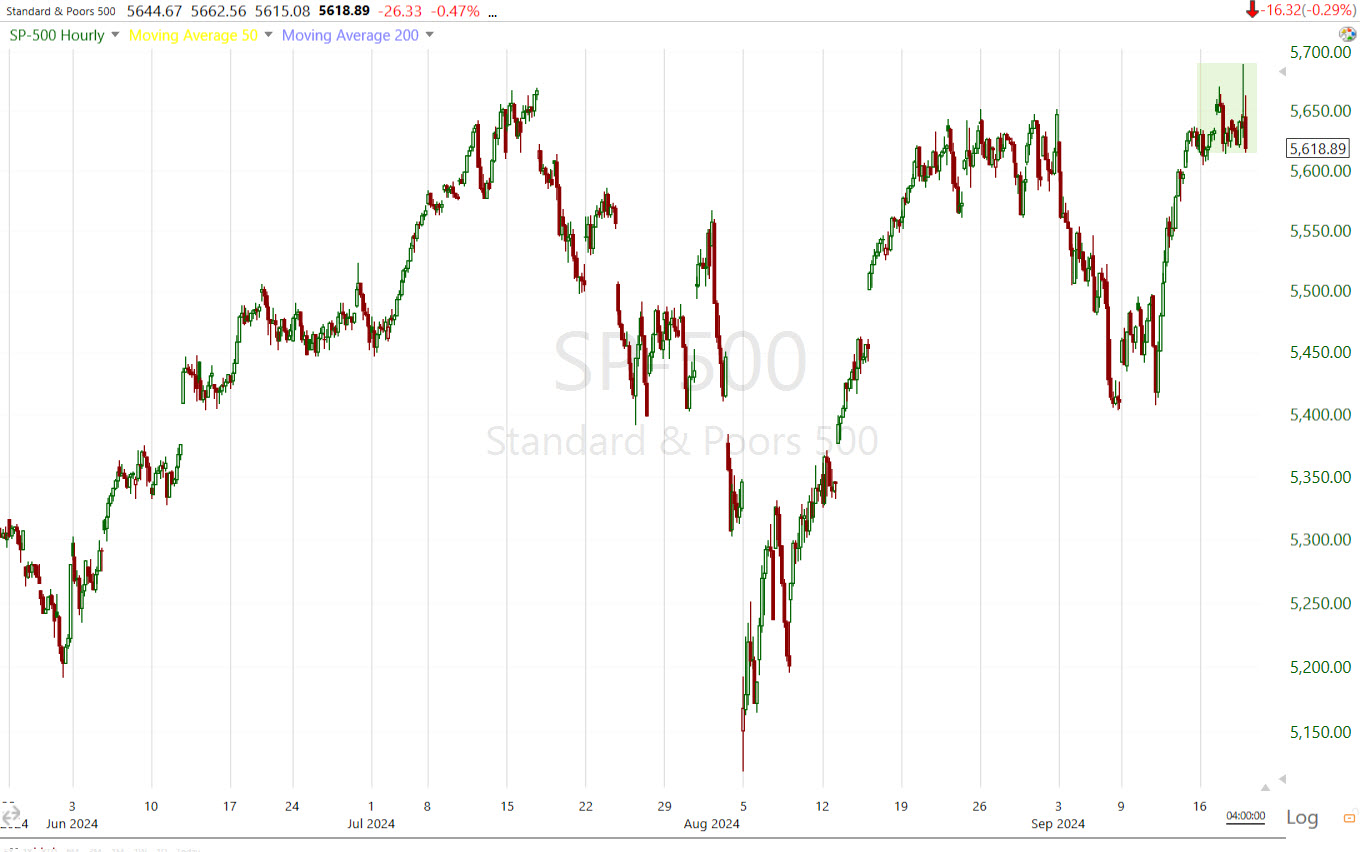 SPX (60m) – the week (green) is still a narrow range.
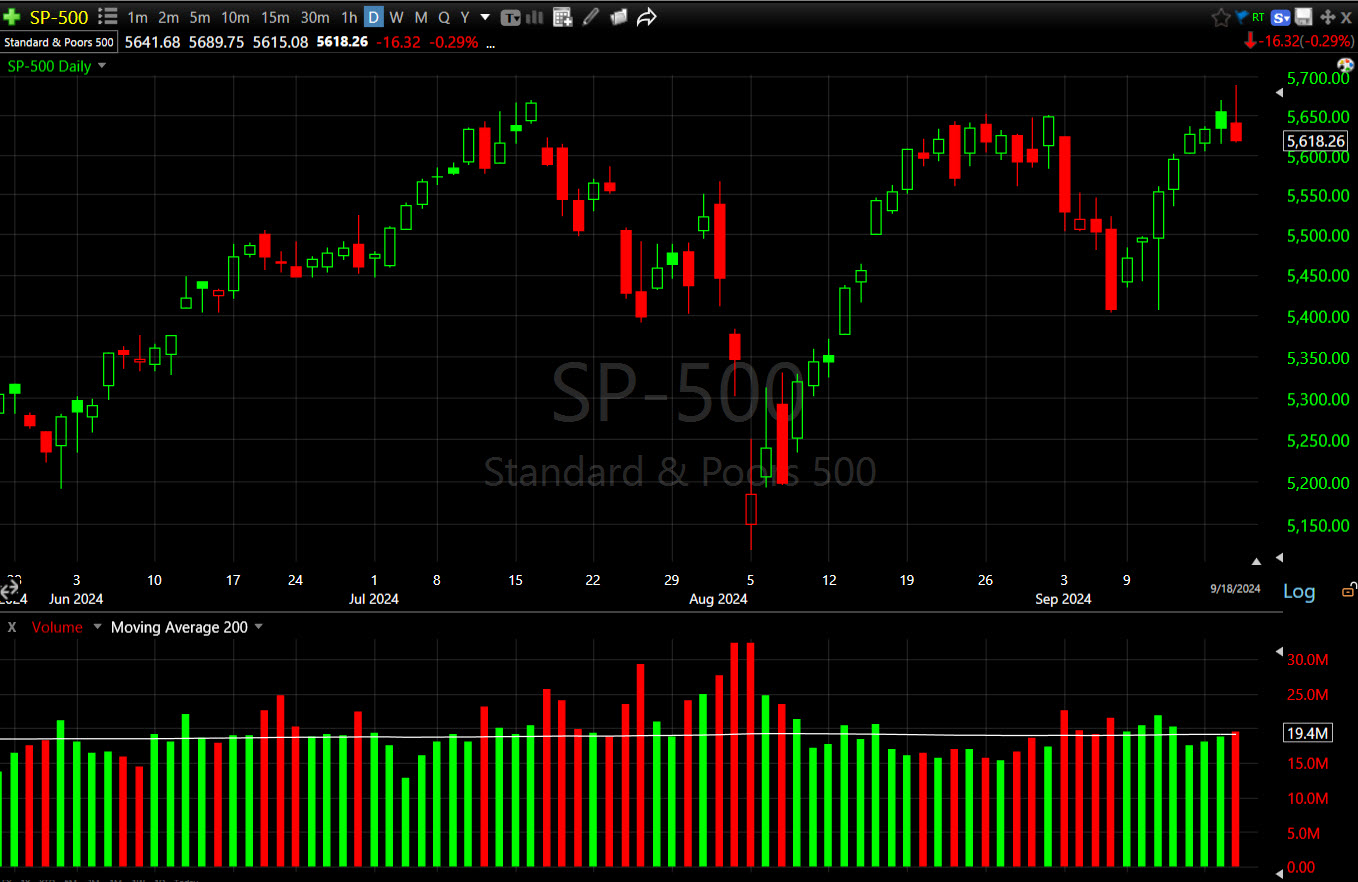 SPX (daily) After 7 consecutive green closes, the Shooting Star candle on a pick up in volume was a bearish change in character.
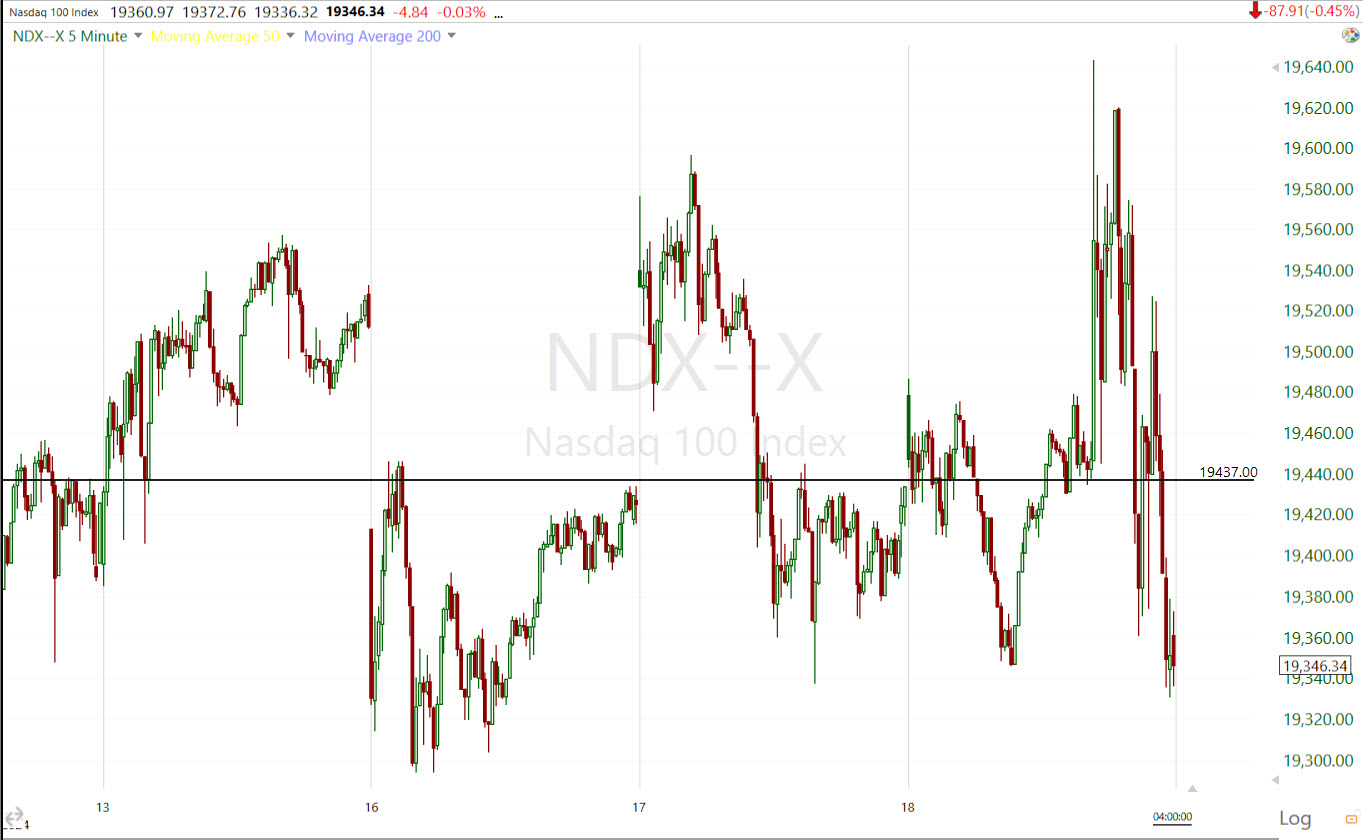 NDX (5m) has spent the last 4 days trading around $19,437. Volume was heavier on today’s red close.
The DJIA knee-jerked and posted an inverted hammer candlestick, although I think it looks better than the SPX/NDX on a relative basis.
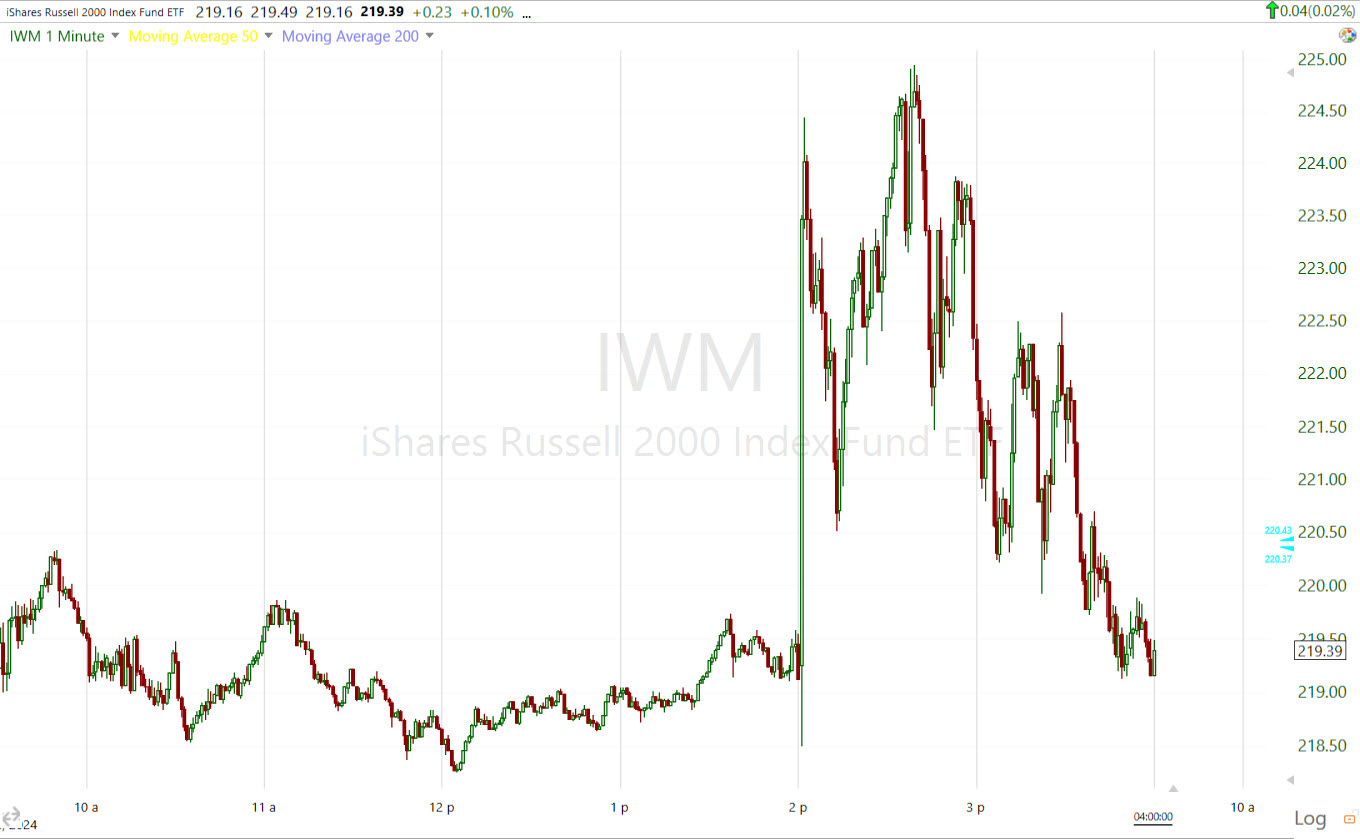 Small Cap IWM (1m today) jumped over +2.5% in response to the FOMC directive before giving it back to close nearly flat on the day.
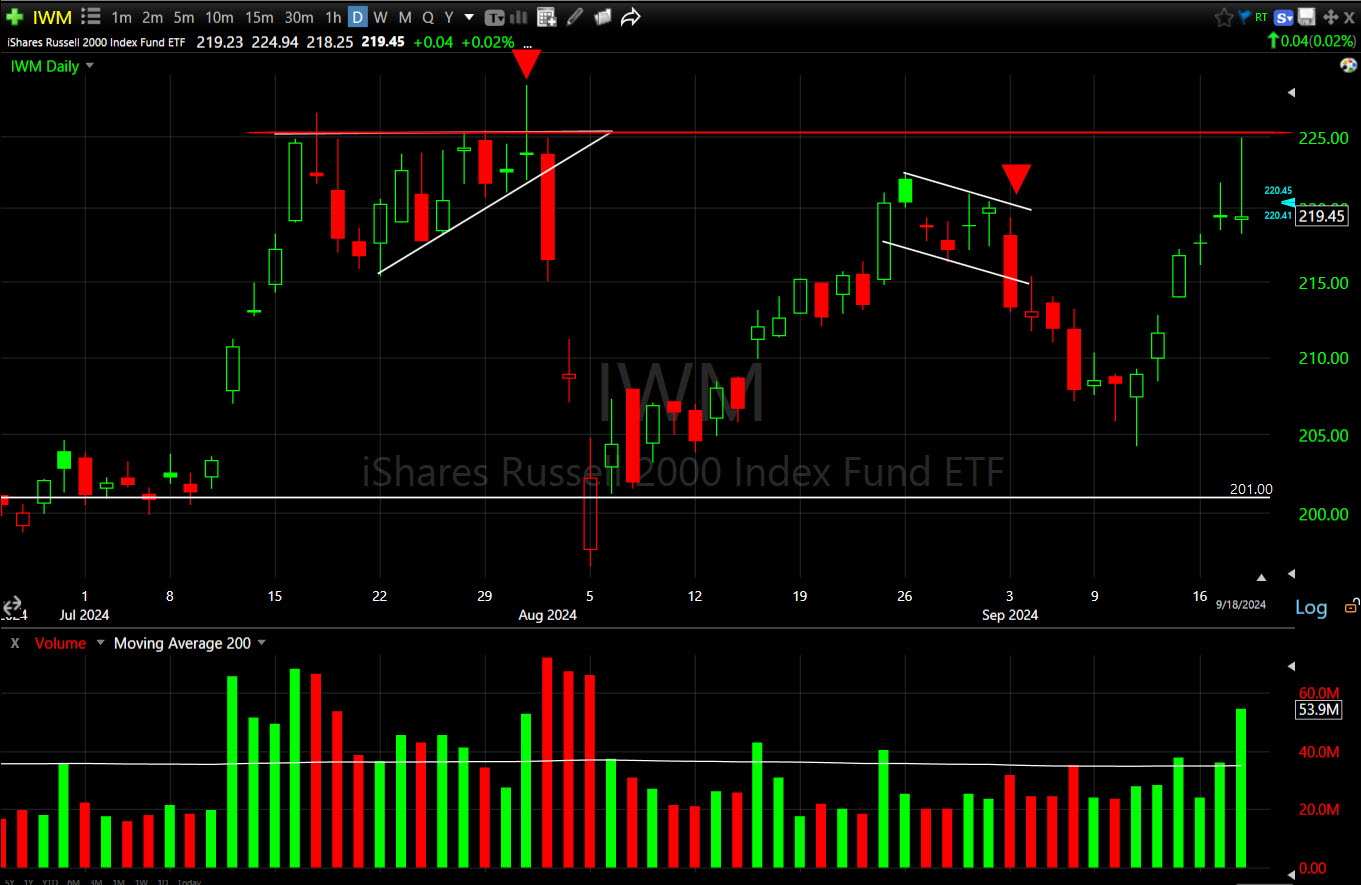 IWM (daily) – Remember yesterday I pointed out that this is the area the Most Shorted Index has run out of steam numerous times, including the last two failed breakouts, right around the $225 level.
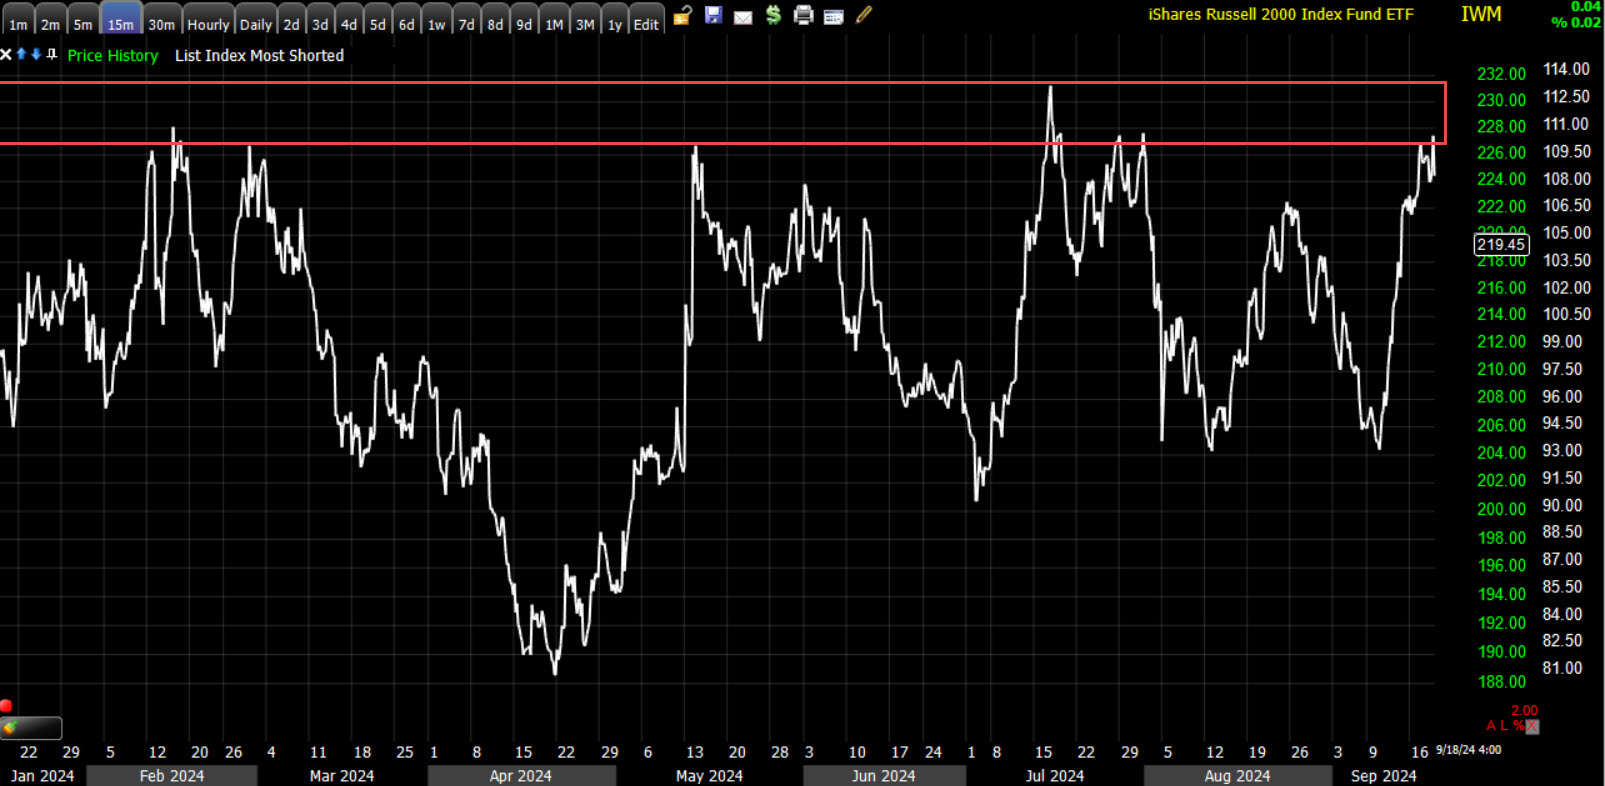 After shorts got a little ahead of themselves a little too early, the MSI is now in that zone where short squeezes have been stalling and Small Cap rallies with them.
VIX (+3.5%) held up pretty well today, despite the fact hedges started unwinding after the FOMC. VVIX ended -1.65% lower as we may see more hedges unwind tomorrow if the market doesn’t come down more sharply. The ABI is a non-factor at 46. However, VIX’s recent relative strength is starting to manifest in positive correlation with the SPX, now positive at 5-day correlation.
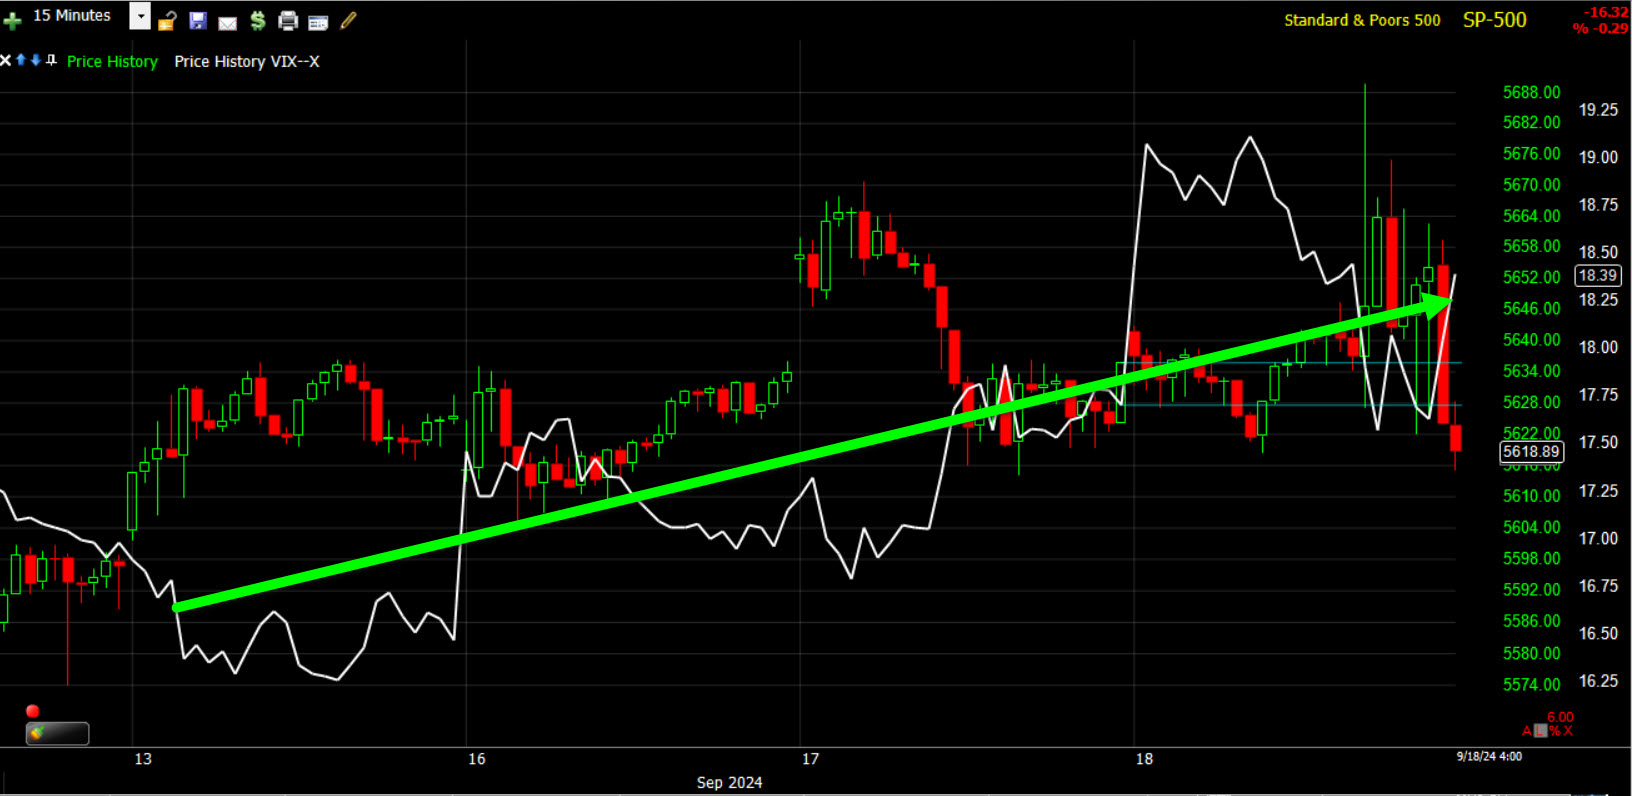 SPX/VIX (15m) positive correlation. The longer this goes, the more important the signal. I recall when I first discovered this in 2007 as the market was topping ahead of the Great Financial Crisis. I didn’t have a correlation indicator back then, I just eyeballed it. I remember the financial media saying it was a sign of bullishness on the part of investors. Years of backtesting has revealed that it is not a bullish sign, at least not of what’s to come, which is all I care about.
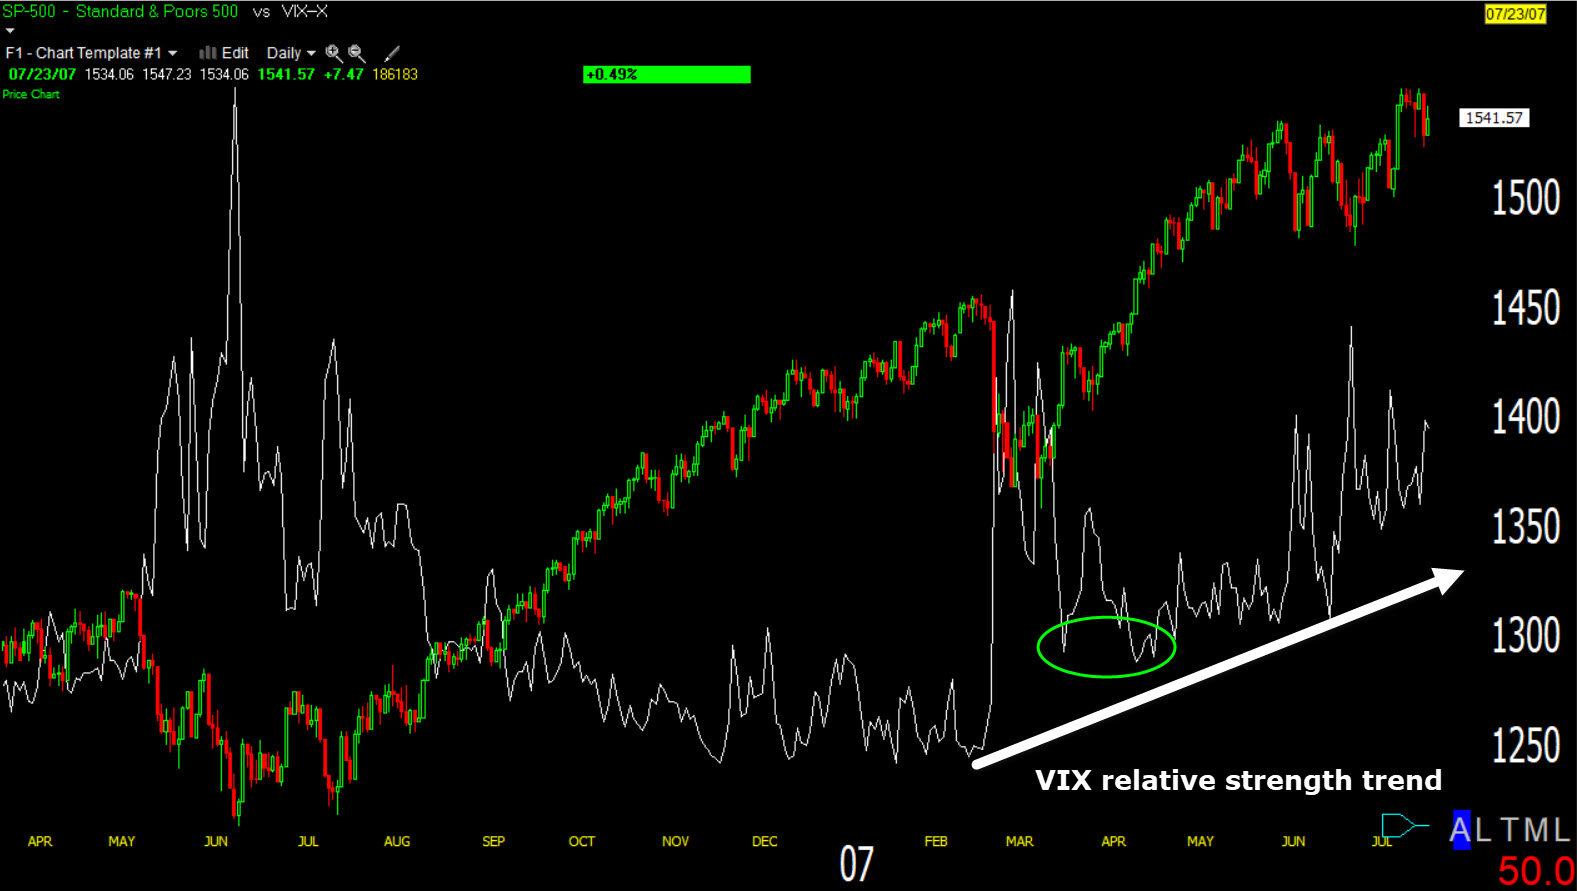 SPX/VIX (daily 2006-2007) – There are structural differences between volatility then and now. The last 15 years or so have seen a building perpetual short volatility trade that’s almost always on.
First, VIX sees a decent move up and resets to a higher baseline (green) such as we’ve recently seen, then volatility displays notable relative strength and positive correlation (white). The SPX topped later that year in October, after the Fed’s first rate cut of the cycle – 50 basis points on September 18th, 2007.
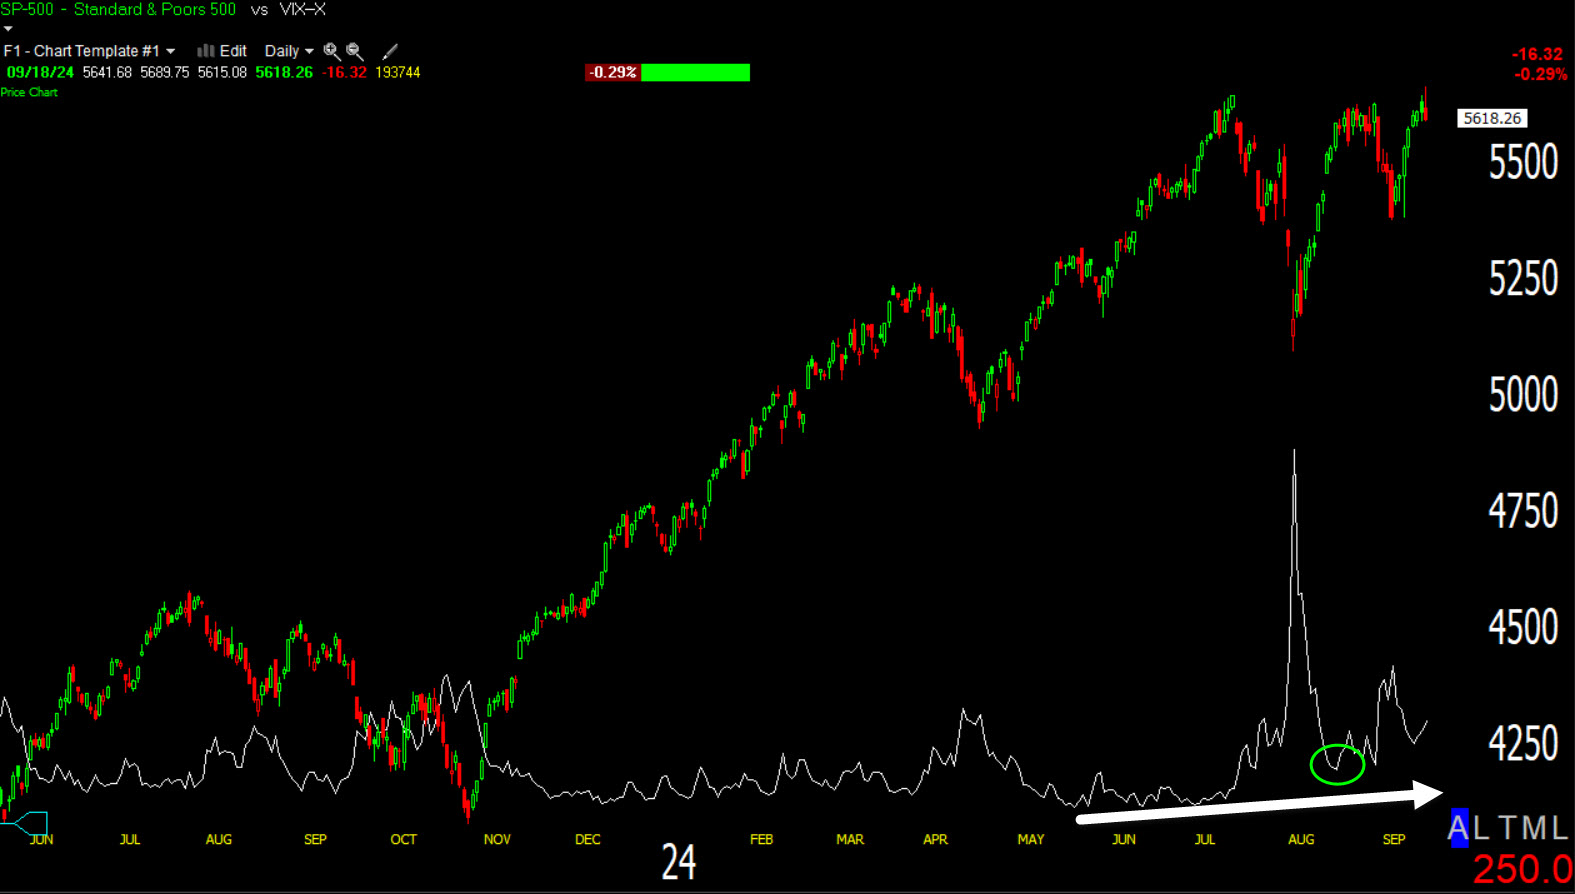 SPX/VIX now – VIX resetting to a higher baseline (green) and while it’s not as obvious on this price chart, VIX has been displaying a trend of relative strength (white) longer than the white arrow shows. It’s actually most of 2024.
S&P sectors
Ten of the 11 S&P 500 sectors closed lower. The Energy sector managed to stay atop the leaderboard most of the day. The rate-sensitive and defensive Utilities sector was at the bottom of the leaderboard most of the day. The Technology sector joined it at the bottom of the leaderboard after the FOMC. 3C charts have been indicating underlying weakness there since the Tech sector helped lift the market from the middle of last week.
The mega cap growth index (MGK -0.5%) trailed the Equal Weight S&P by a modest 30 basis point.
Semis (SOX -1.1%), however, were more noticeably weak after the FOMC/Powell. The group also helped the market lift last week with weak underlying money flow on 3C charts.
Materials ⇩ -0.43 %
Energy ⇧ 0.19 %
Financials ⇩ -0.31 %
Industrial ⇩ -0.08 %
Technology ⇩ -0.91 %
Consumer Staples ⇩ -0.38 %
Utilities ⇩ -0.76 %
Health Care ⇩ -0.17 %
Consumer Discretionary ⇩ -0.20 %
Real Estate ⇩ -0.29 %
Communications ⇩ -0.08 %
Internals
Decliners (1443) have a tiny edge over Advancers (1283) on heavier Volume of 945 mln. shares at the NYSE.
There is no Dominant price/volume relationship and no 1-day oversold internals.
Treasuries
Treasuries knee-jerked a bit as well. The interesting thing is that Treasury yields, which dropped initially on the FOMC, moved higher with the 10-yr yield, settling the session higher than where it was before the 2:00 p.m. ET policy decision. The Treasury market could be pricing in some inflation angst in a curve-steepening trade.
The 2-yr yield settled today’s session at 3.60%, up one basis point, while the 10-yr yield settled at 3.69%, up four basis points. They had traded down to 3.54% and 3.64%, respectively, in the initial wake of the policy announcement.
Expect your savings rate to fall by a half percent tomorrow morning, while APR’s on credit cards stay right where they are.
As I always say, stocks will knee-jerk and often retrace that initial FOMC knee-jerk. You want to watch what the FX and bond market do. From last night,
“There’s going to be a lot to take in tomorrow’s FOMC. Stocks’ reaction is not as a reliable indication of the outlook as the currency and rates markets, so keep an eye on the Dollar and yields.”
Currencies and Commodities
Speaking of the U.S. Dollar Index, it knee-jerked lower on the policy directive, and retraced it all and then some before the close.
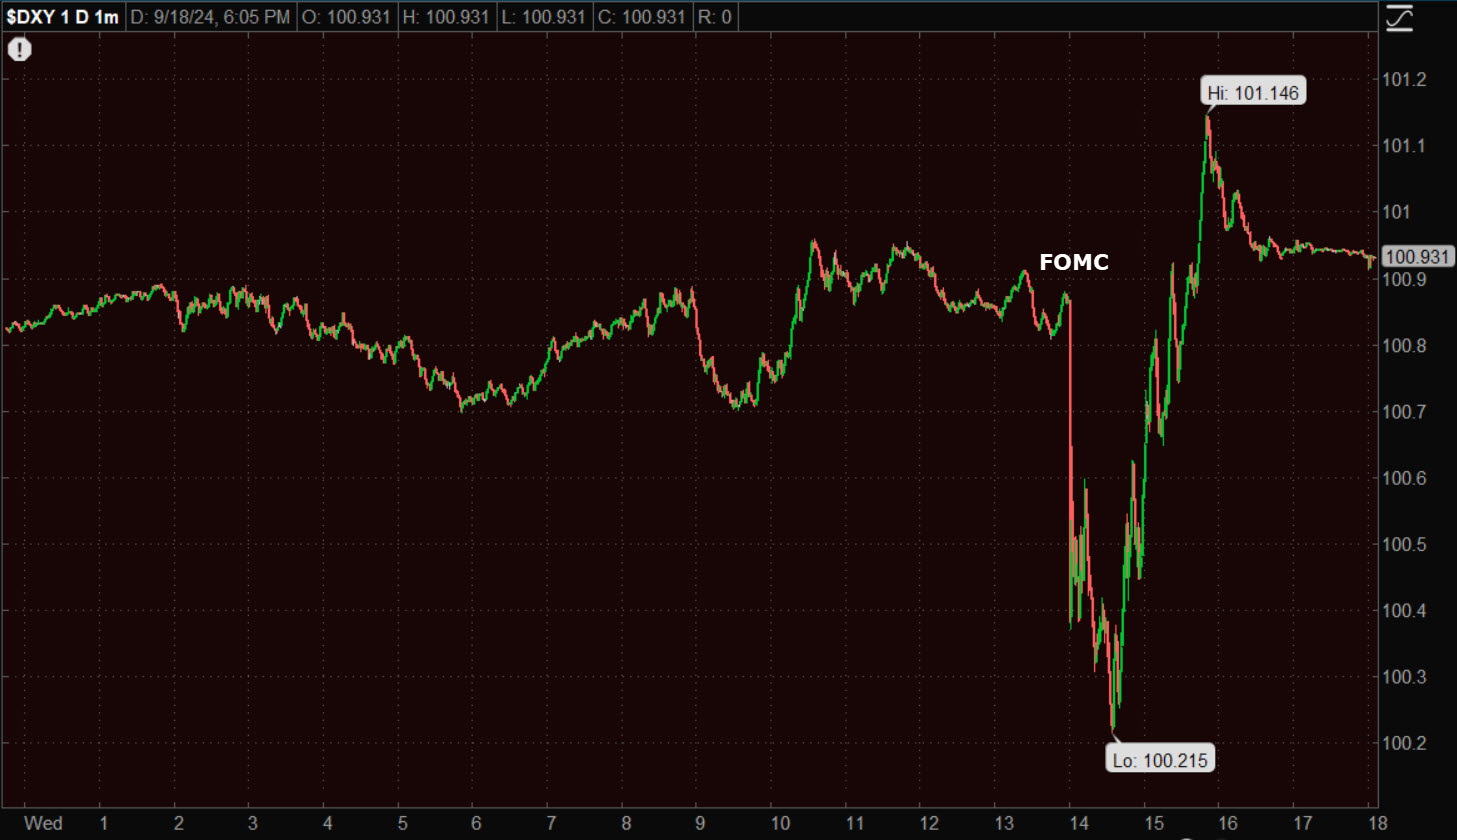 Dollar Index (1m) the first reaction lower is dovish, the second is unusual in that the full 50 bp rate cut reaction was retraced and then some. That typically translates as a hawkish reaction, but in this case it may also be an expression of concerns of reigniting an inflationary bump. I don’t see the probability of a major inflationary move, but a bump like the first half of this year is entirely within the realm of reasonable possibilities. A 50 bp cut out of the gate makes it even easier to ignite.
Ironically, this reversal in the Dollar saved USD/JPY from another potential breakdown.
WTI Crude oil closed -1.2% lower to $69.15/bbl.
On a side note, Israel triggered explosions in Hezbollah operatives’ handheld radios (walkie-talkies) today, killing 14 and wounding 450. This comes after a similar operation, blowing up Hezbollah pagers yesterday, which suggests Israel is about to invade Lebanon to broaden the war with the first strike being to diminish Hezbollah’s command and control capabilities.
According to news wires:
Israeli cabinet has given PM Netanyahu and Defence Minister Gallant the authorization to undertake military action against Hezbollah — even if it leads to an all-out war.
Furthermore, the Israeli army announced it’s transferring the elite 98th Division from the Gaza Strip to the northern border with Lebanon with about 10,000-20,000 soldiers, the paratroopers and commandos will now join the 36th Division under the Northern Command. If Iran gets more involved in a more front and center way and oil prices jump, the Fed may find it’s jumbo cut backfiring as inflation jumps. Remember that CTAs are short oil and hedge funds are the most bearish of oil on record. That’s a lot of potential short covering/short squeeze in oil just waiting for a spark.
Gold futures settled +0.2% higher to $2,598.60/oz. Gold initially broke out of the small bull flag on the FOMC, but the reversal in rates and the Dollar (both higher) pressured gold to give up the gains.
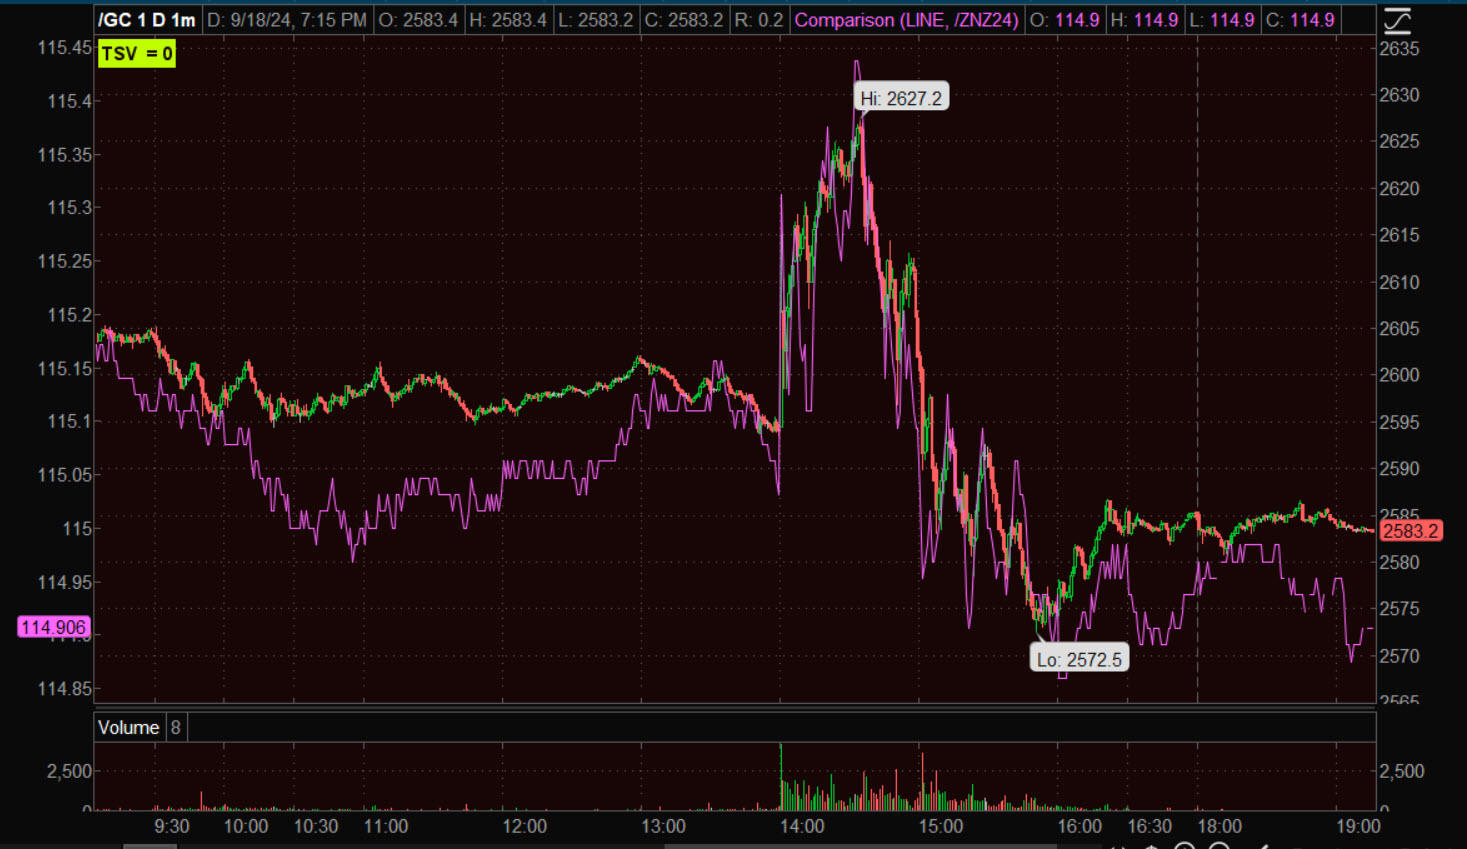 Gold (1m) and 10-yr Treasury futures (purple).
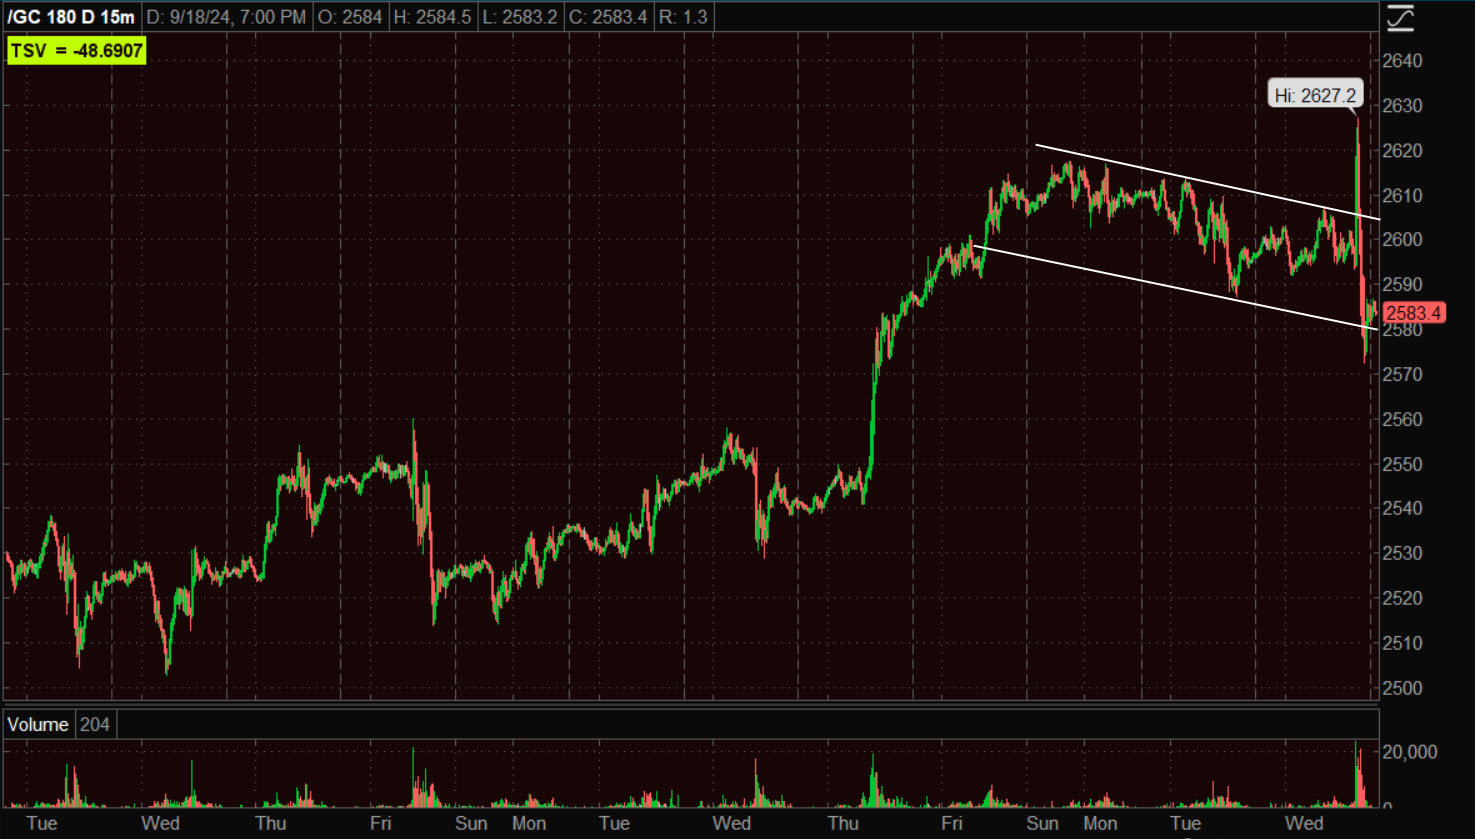 (15m) This is technically a small “Failed Breakout, Fast Reversal” scenario. I’m not bothered by it in the least. I would like to see gold hold support at $2500. If Gold does pull back that far (this is a small pattern), I’d view a pull back to $2500 as a buying opportunity all day long.
Bitcoin actually looked pretty decent today.
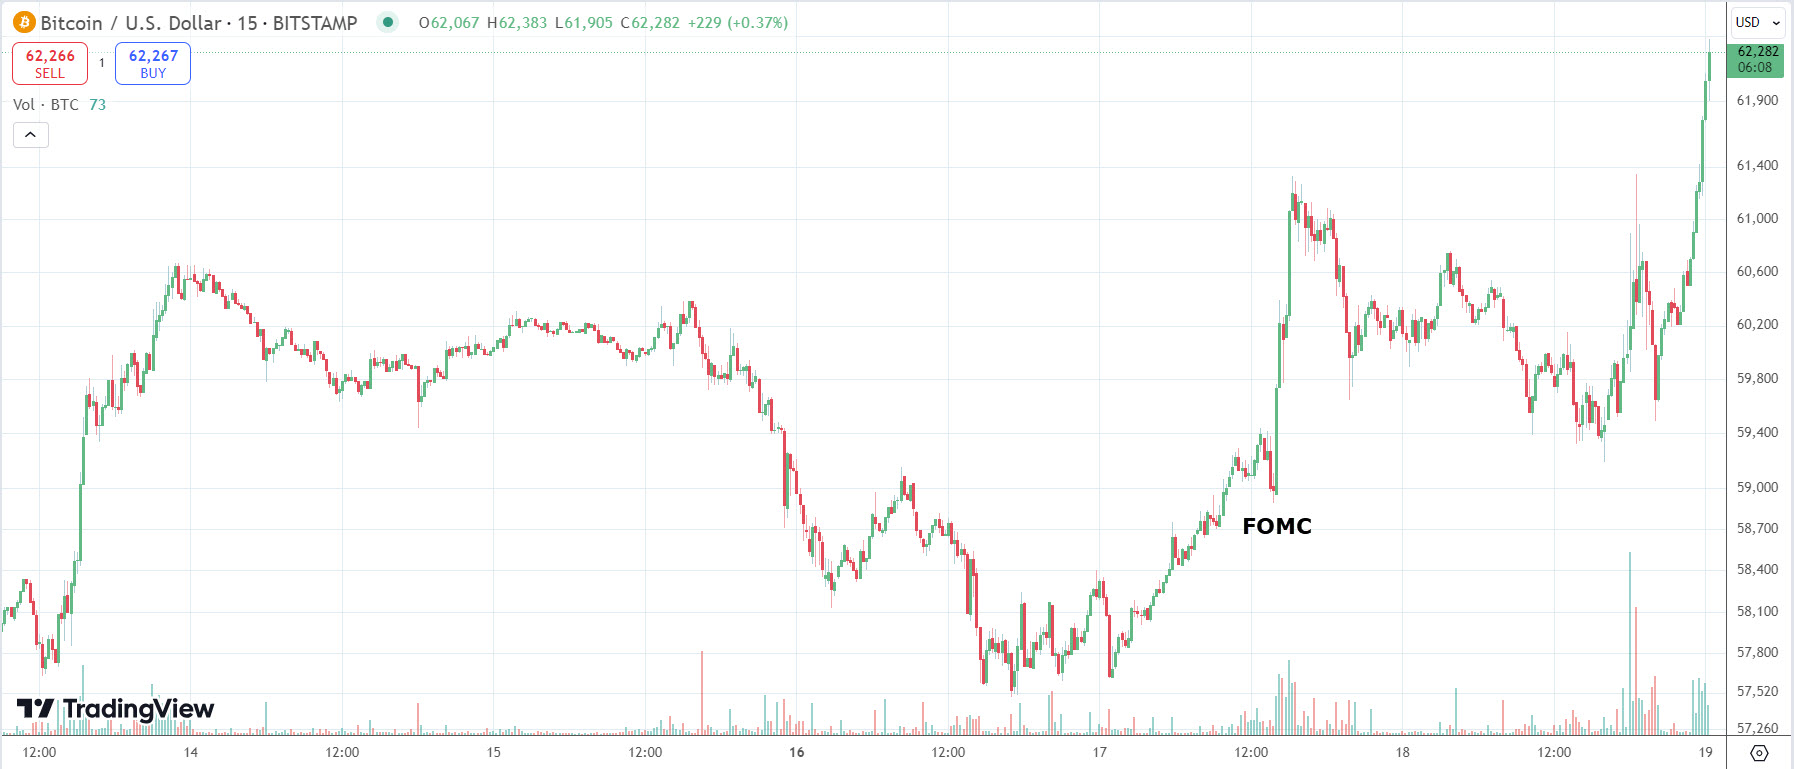 (15m) – There wasn’t much of a knee-jerk reaction and fade, and price is making a higher high. Volume could be better on the advance, but not bad.
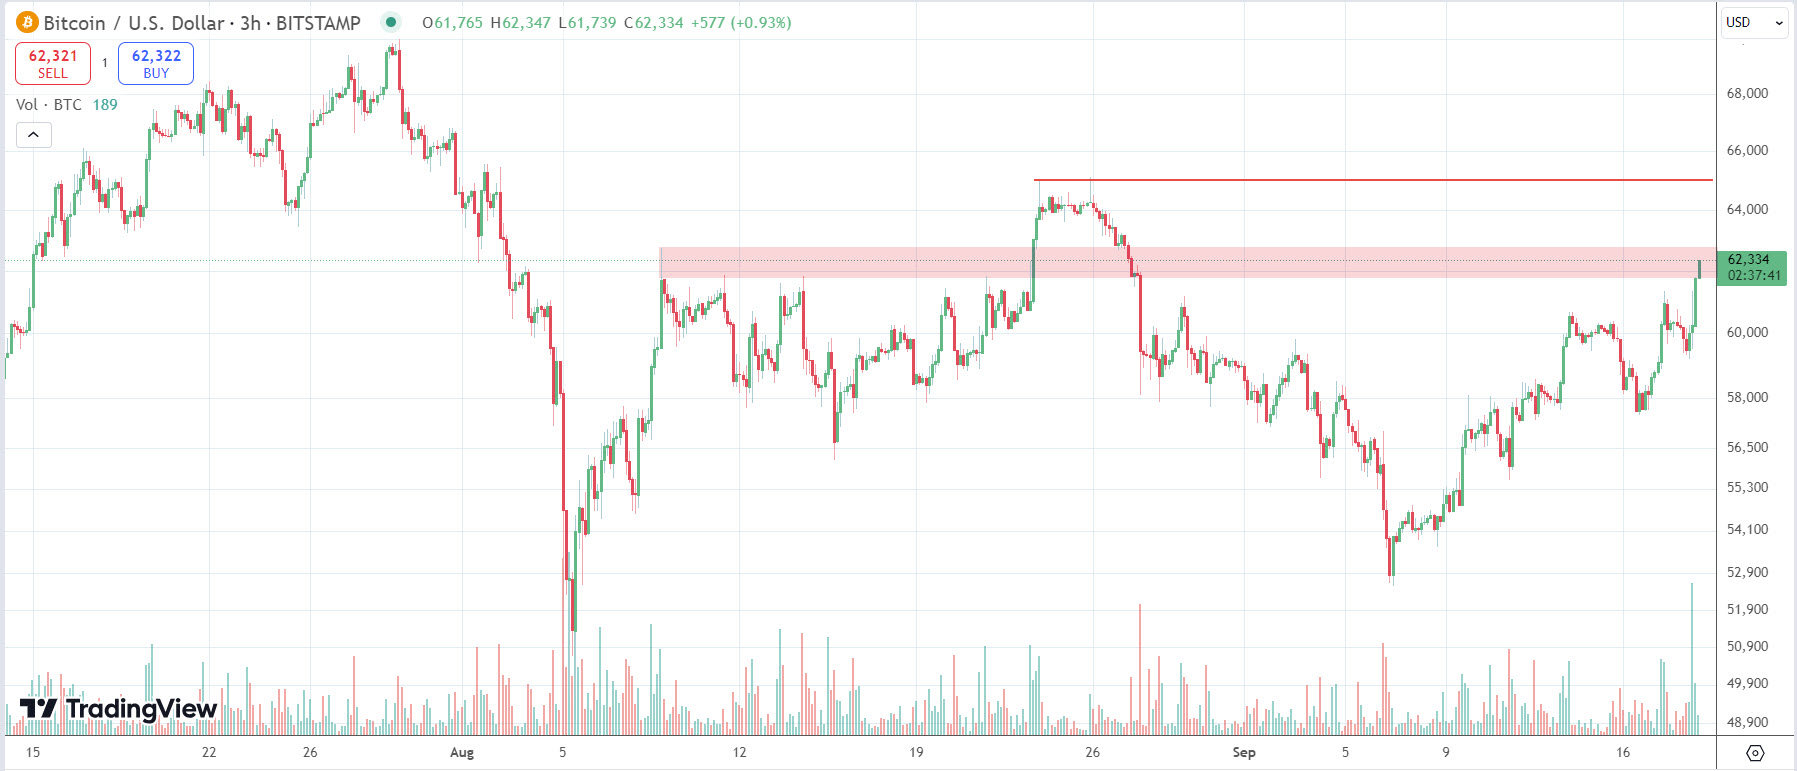 (3H) It still has work to do before getting interesting, but I think rate cuts could be helpful. The only thing I can see as a strong driver for cryptos is liquidity/easier financial conditions, as cryptos are a speculative asset so when there’s not a lot of money sloshing around in the system, cryptos don’t get those speculative flows like they do when there is. Still, we’ll have to see if BTC can push through $65k on some more impressive volume.
Summary
The stock market is near record highs hoping for a soft landing. The long bond is looking much more apprehensive, perhaps even starting to lean, “hard landing”. Between the two, you know which one’s opinion I value more. The same as when we were watching the reaction to the FOMC today.
The price/volume action is looking classic toppy.
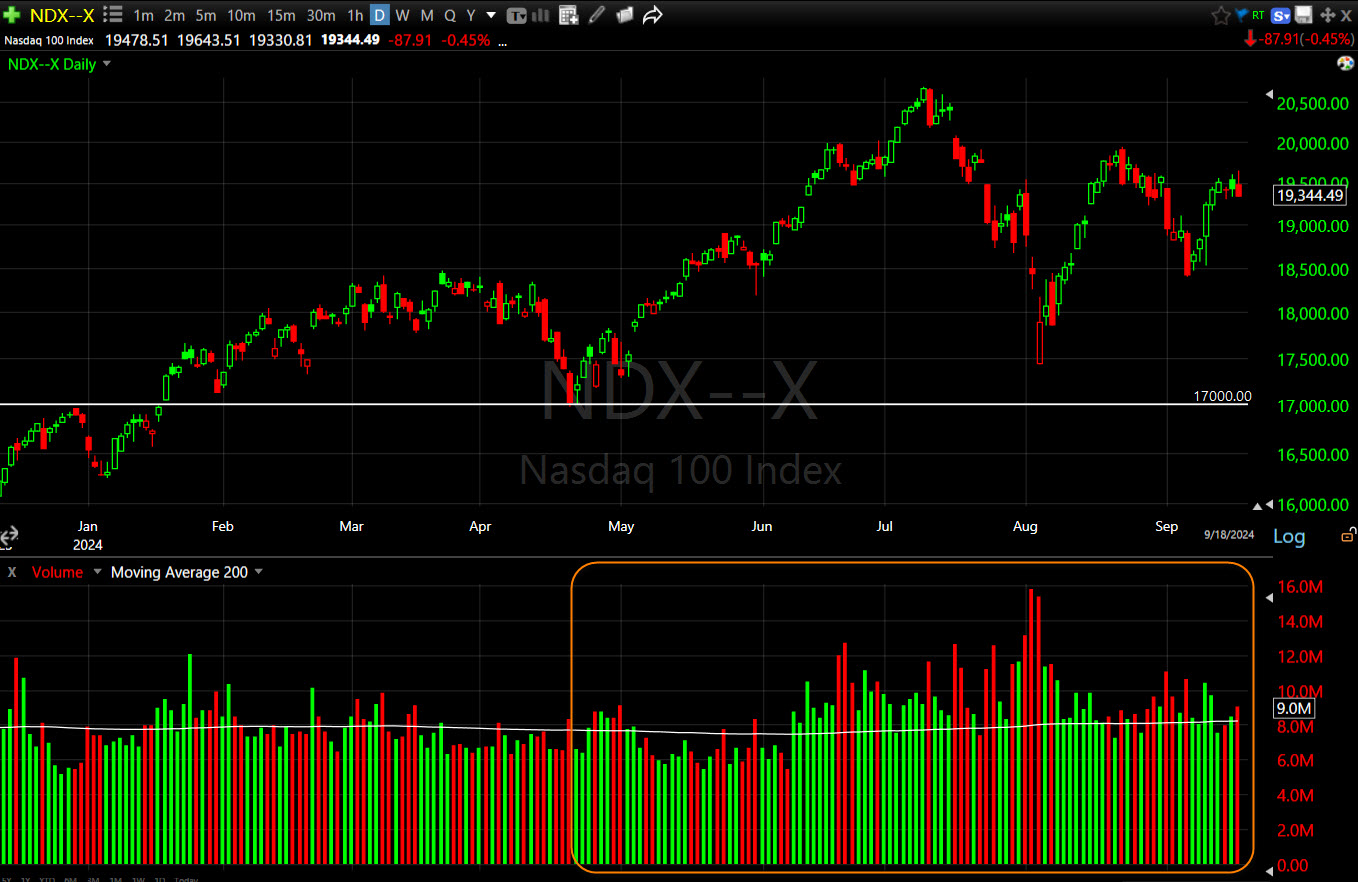 NDX (daily) – This $14k level is catching my eye as a top’s neckline, perhaps a H&S. The price/volume activity is classic toppy too, since at least May.
It’s more easily seen on QQQ’s volume chart…
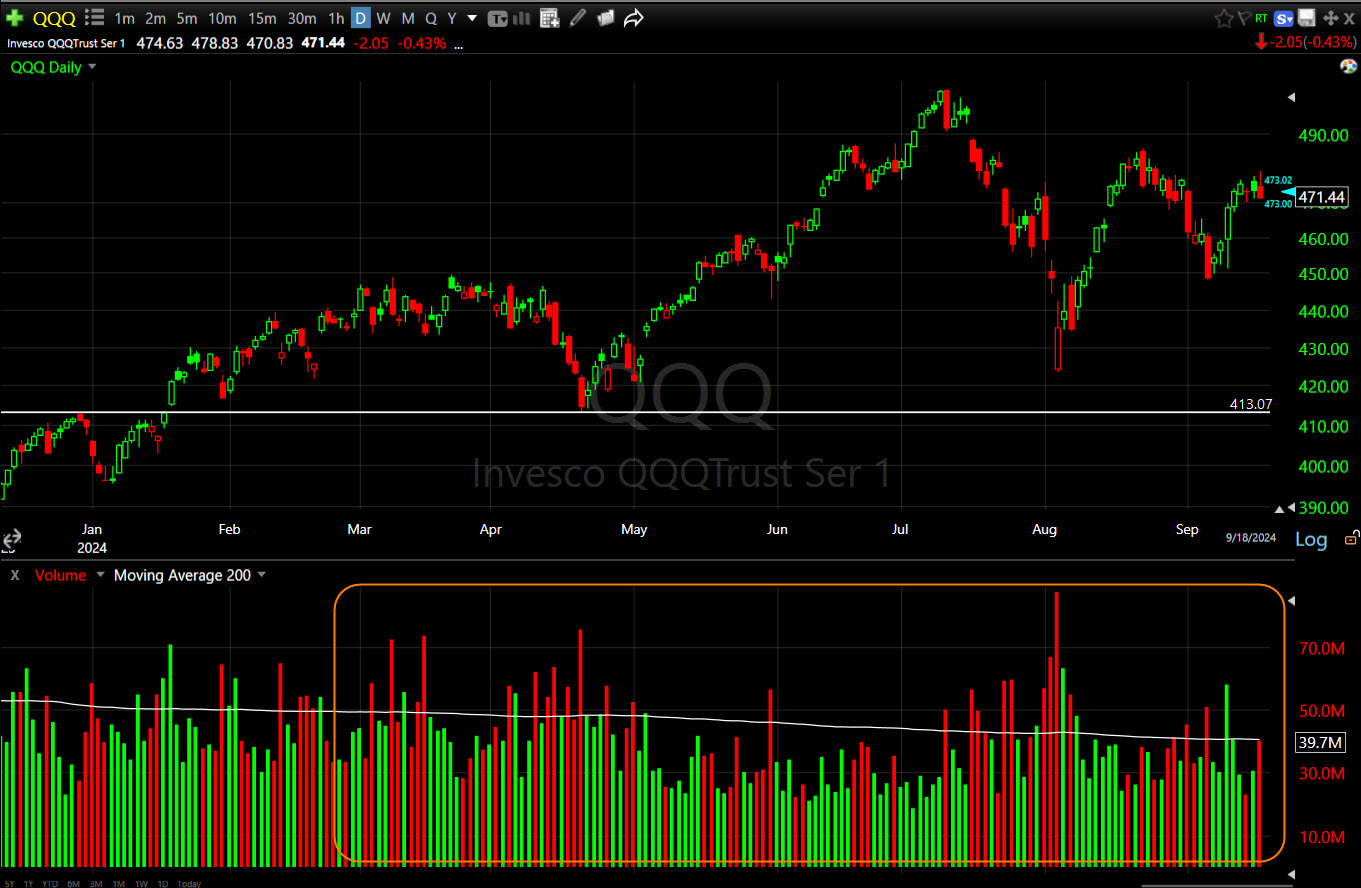 QQQ (daily) and here it goes back even further… Declining/Light Volume on Price Advances, and Increasing/Heavy Volume on Price Declines. Not good.
I have very rare occasion to pull out super-long timeframe 3C charts, but now is one of those times.
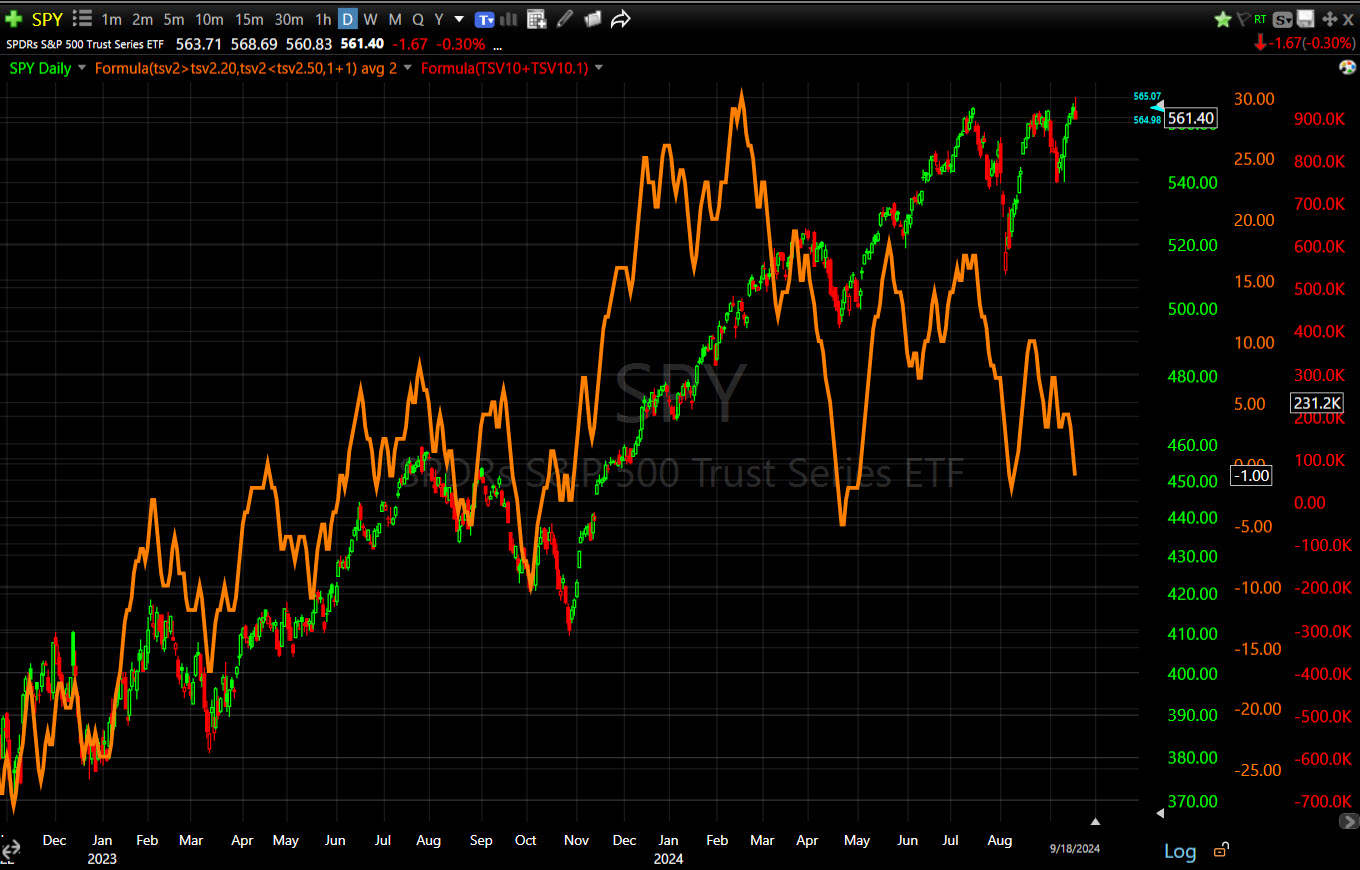 SPY (daily)
The last time there was a negative divergence even remotely close to this was the 2021 top before the 2022 bear market.
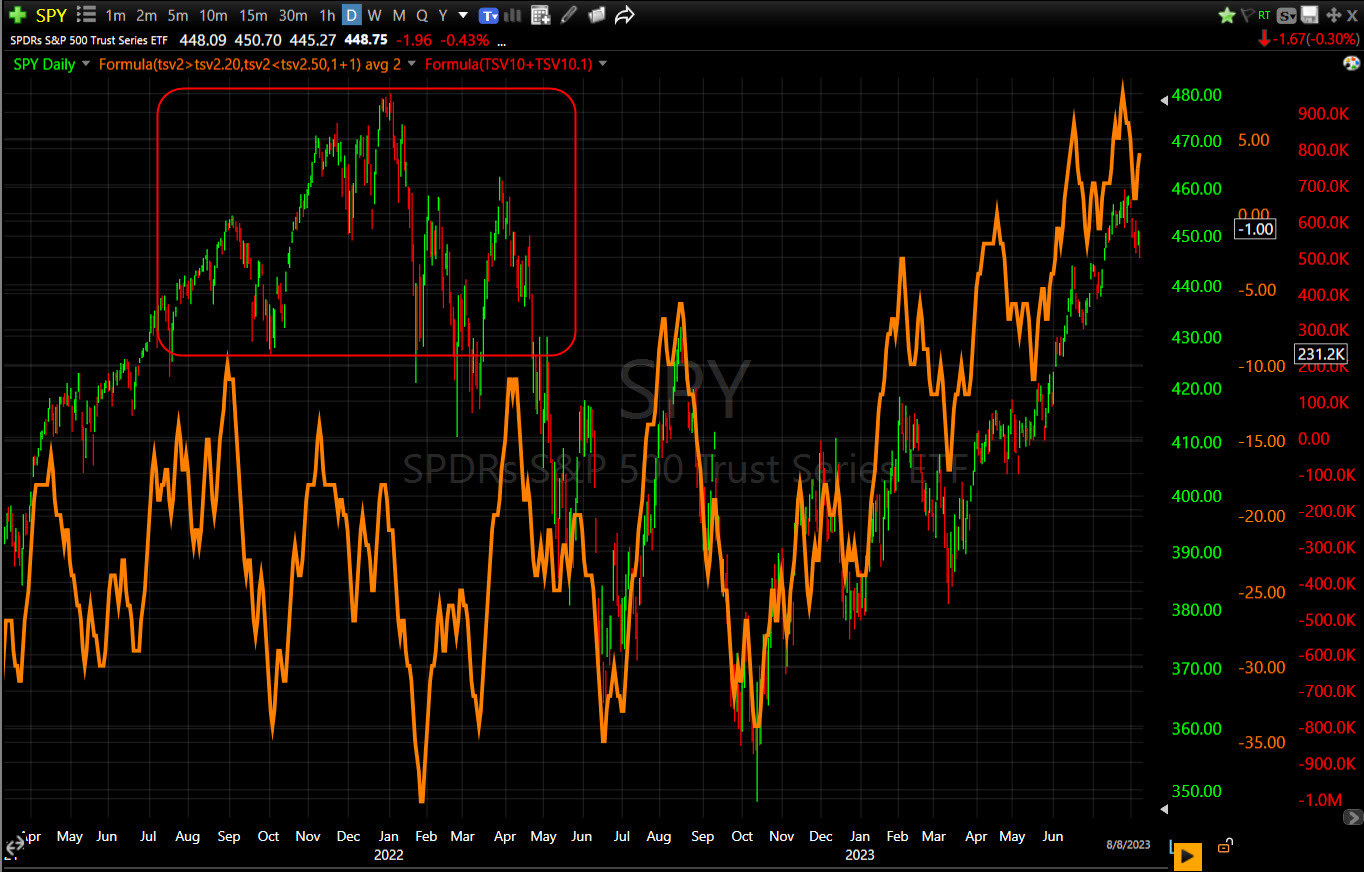 SPY (daily 2021-2023)
The current divergence is likely to be far larger than it currently is before it’s done. Does that mean we’re headed into a bear market? Not necessarily. It means that smart money does not have nearly the conviction they had. They have information the rest of us don’t that they pay good money for. They also have deep pockets that move markets. 3C tracks their footprints in the sand.
We now exit Fed media blackout so expect to get more color this week and next week from various Fed officials. Their opinions are represented as an anonymous Dot in the SEP’s dot-plot. The market will be watching for more color from them as they emerge from media blackout.
Overnight
S&P futures are up +0.45% tonight, seemingly getting a lift from the Dollar-Yen, up +0.9%.
 ES (1m)
The U.S. Dollar Index is up +1.2%. Despite the boost to the Dollar-Yen, this kind of gain generally hasn’t been helpful for stocks.
WTI Crude Oil futures are down -1% to $69.20/bbl.
Gold futures are down -0.8% since settlement at $2577.30/oz.
The 2-yr yield is up +5 bp, the 10-yr is up +4 bp and 30-yr up +3 bp! Well this is interesting.
Looking ahead to Thursday, we get receive the following data:
- 8:30 ET: Weekly Initial Claims (consensus 232,000; prior 230,000), Continuing Claims (prior 1.850 mln), Q2 Current Account (prior -$237.6 bln), and September Philadelphia Fed (consensus 3.0; prior -7.0)
- 10:00 ET: August Existing Home Sales (consensus 3.90 mln; prior 3.95 mln) and August Leading Indicators (consensus -0.3%; prior -0.6%)
- 10:30 ET: Weekly natural gas inventories (prior +40 bcf)