This is a nightly Wolf On Wall Street-Trade subscriber post. You can still subscribe at www.WolfonWall Street-Trade.com @ 2008 prices, before the Technical Take’s Subscriber and Discord Room goes live. The Technical Take Subscriber prices will still be a bargain, but obviously inflation has made the expense of running the site and providing daily real-time stock market insights, more expensive than they were in 2008. Take advantage of this chance to beat inflation while you still can. Enjoy the post!
August 1, 2024
The stock market settled near session lows, leaving the major indices with solid declines.
There are a lot of reasons being given for today’s Sea of Red and Flight to Quality, but it all started in the overnight and pre-market session. As I wrote in the pre-market A.M. Update this morning,
“S&P futures are up +0.5% and look somewhat shaky from overnight trade. NASDAQ futures are up +0.4% and have lost their edge overnight, despite ongoing optimism about rate cuts, along with buying in mega cap and semiconductor shares after Meta earnings.”
Things got uglier from there with a cornucopia of weak economic data that spurred fears that the Fed is waiting too long to cut rates as economic activity is clearly weakening:
- Initial Jobless Claims surged to the highest in a year, which may weaken discretionary spending.
- Continuing Jobless Claims are trending higher and were the highest since November 2021.
- S&P Global US Manufacturing PMI dropped into contraction for the first time since Dec 2023. New orders declined for the first time in three months, while Prices Paid rose. Both New Orders and Employment were the worst since the lows of the Covid lockdowns.
- ISM Manufacturing, already in contraction, showed a faster pace of contraction in the manufacturing sector. This was the fourth straight month (and 20th out of 21) that economic activity in the manufacturing sector contracted. It was the weakest manufacturing report since November 2023 and near levels from post-COVID lockdown lows.
- Total Construction spending was soft across both the private and public sectors, reflecting weaker demand and a softening economy.
Growth concerns steered price action in the bond and equity markets. Stocks slid after this morning’s data, which also sent Treasury yields tumbling on weaker economic growth expectations.
The carry trade was almost certainly a factor…
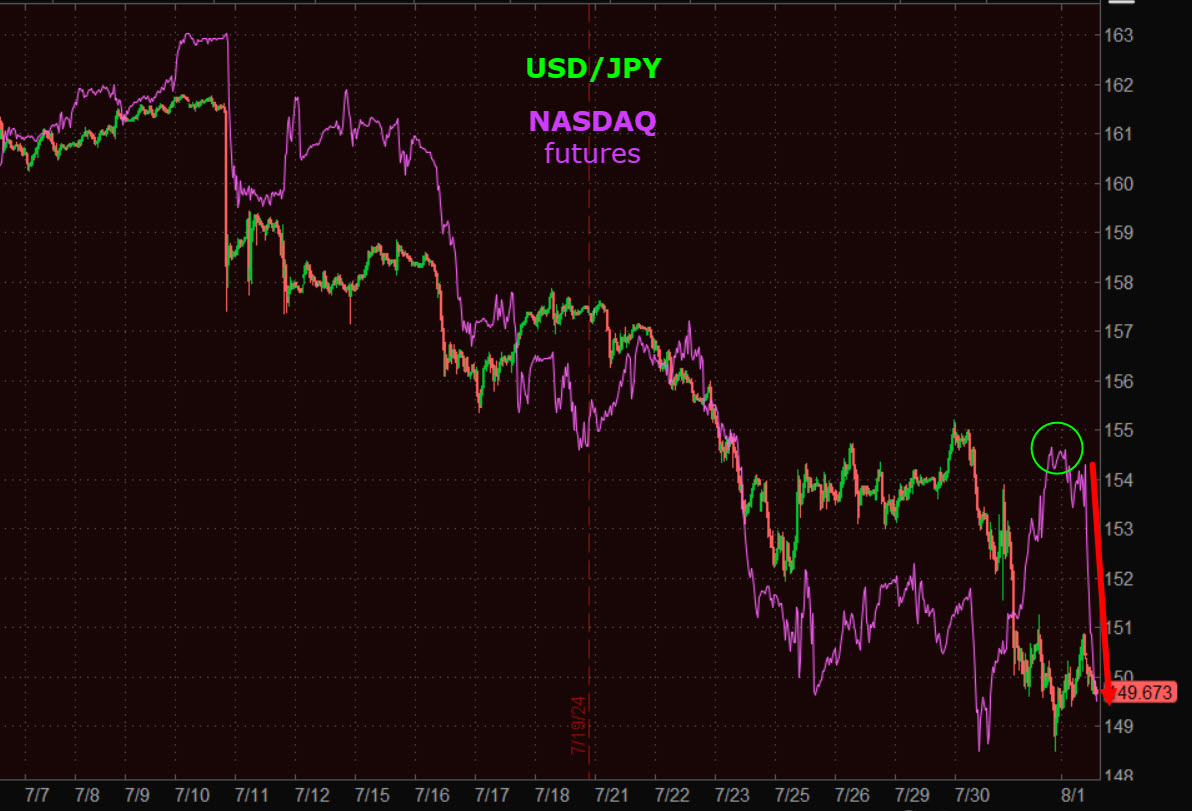 Recall that as stocks were surging higher Wednesday, the Dollar-Yen was sinking lower. Today we saw NASDAQ-100 (and the other averages) catch down.
Averages
While everything, including Dow Transports (-1.7%), closed lower, the NASDAQ-100 and Small Cap Russell 2000 were the worst performers. The expected Small Caps’ failed breakout that occurred today, put a stake through the heart of those hoping there would be a sustainable rotation to Small Caps. I won’t go into all the reasons I didn’t think this would be the case. I think you know.
S&P-500 ⇩ -1.37 %
NASDAQ ⇩ -2.44 %
DOW JONES ⇩ -1.21 %
RUSSELL 2000 ⇩ -3.03 %
The S&P found support at its 50-day Tuesday, jumped Wednesday, and erased most of it today with a huge bearish engulfing candle to end back at the 50-day SMA. But…
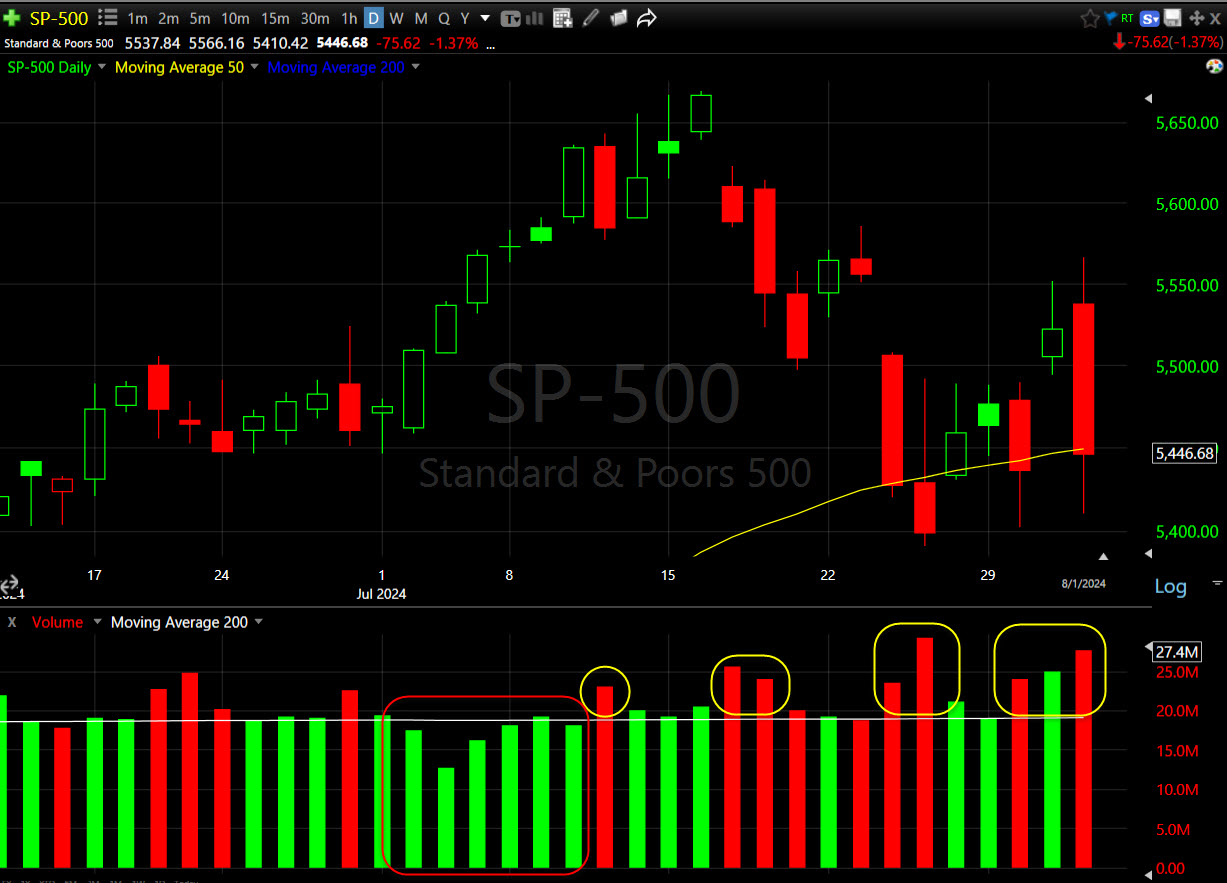 Look at that volume trend. And this kind of heavy red sell-side volume in the light volume summer months!
The Dow posted a failed breakout from a bullish ascending triangle consolidation…
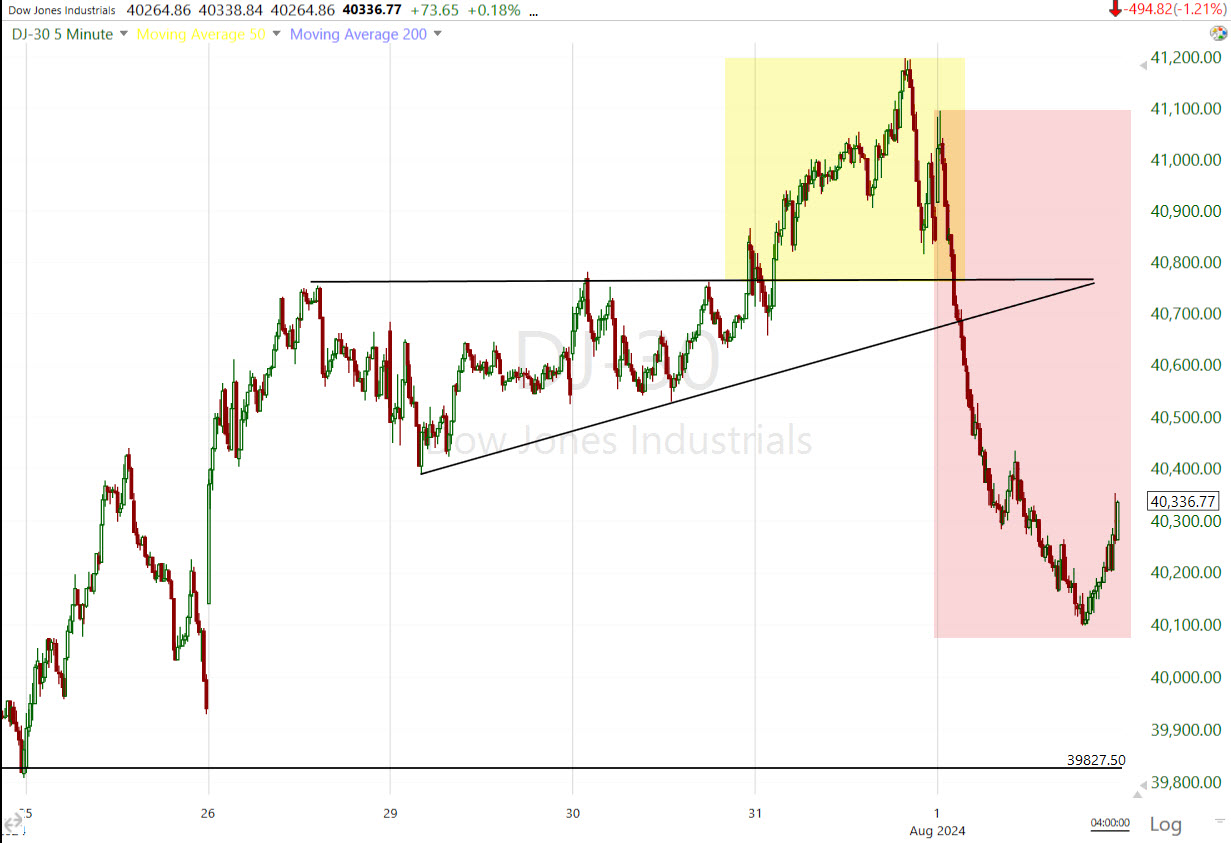 The breakout was exactly where it should have been, but failed moves lead to fast reversals.
Transports were knocked down again from that massive zone of resistance…
![]() Dow Transports (15m)
Dow Transports (15m)
For those believing and hoping for the soft-landing, the market itself is saying, “No”. This is the kind of performance you see from Transports when the market is entering or anticipating an economic expansion…
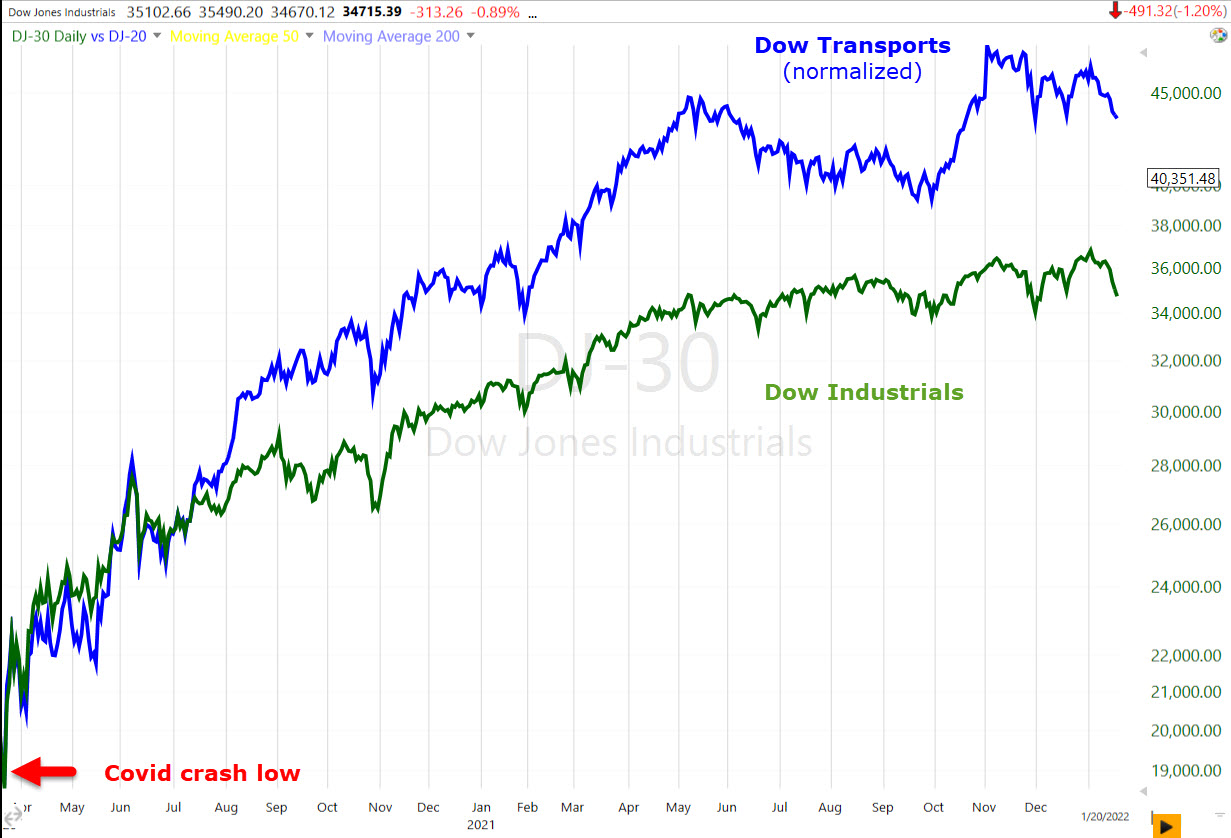 Transports lead.
However, this is what we have…
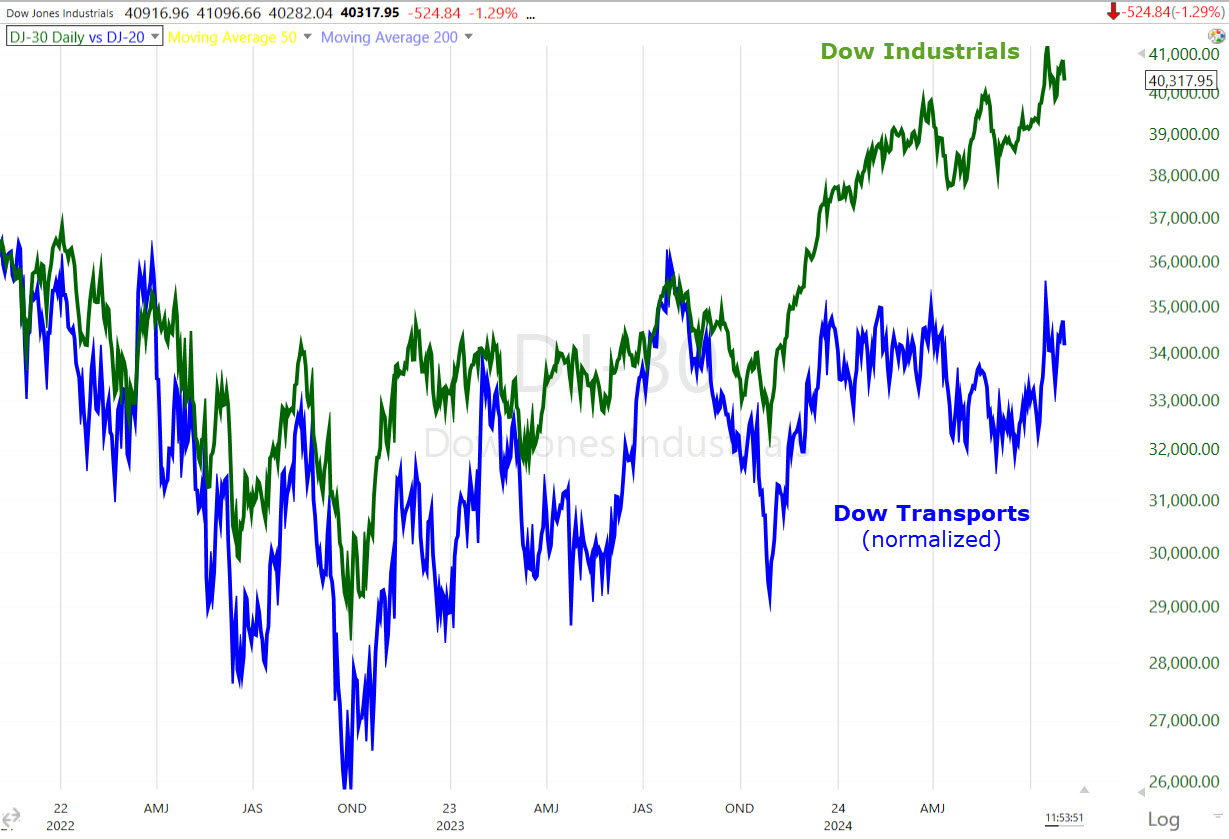 Transports lagging.
The NASDAQ-100 found technical support Tuesday at its 100-day and jumped yesterday.
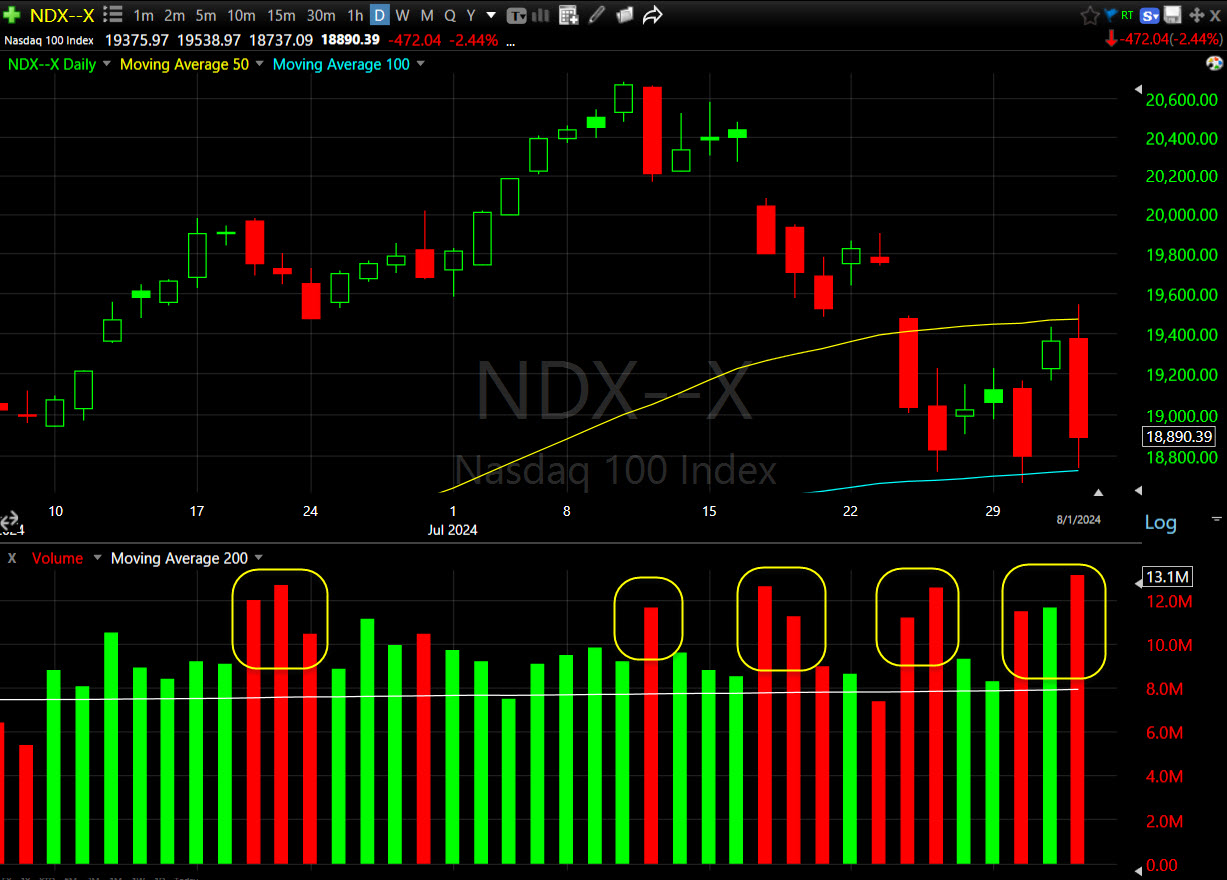 And gave nearly all of yesterday’s gain back with a bearish engulfing candle finding resistance at the 50-day, and support at the 100-day. And look at the recent volume.
The bulls’ hopes that Small Caps would continue their run and rotation into a leadership role took a heavy beating today with another perfectly timed breakout, but a failed breakout and fast price reversal.
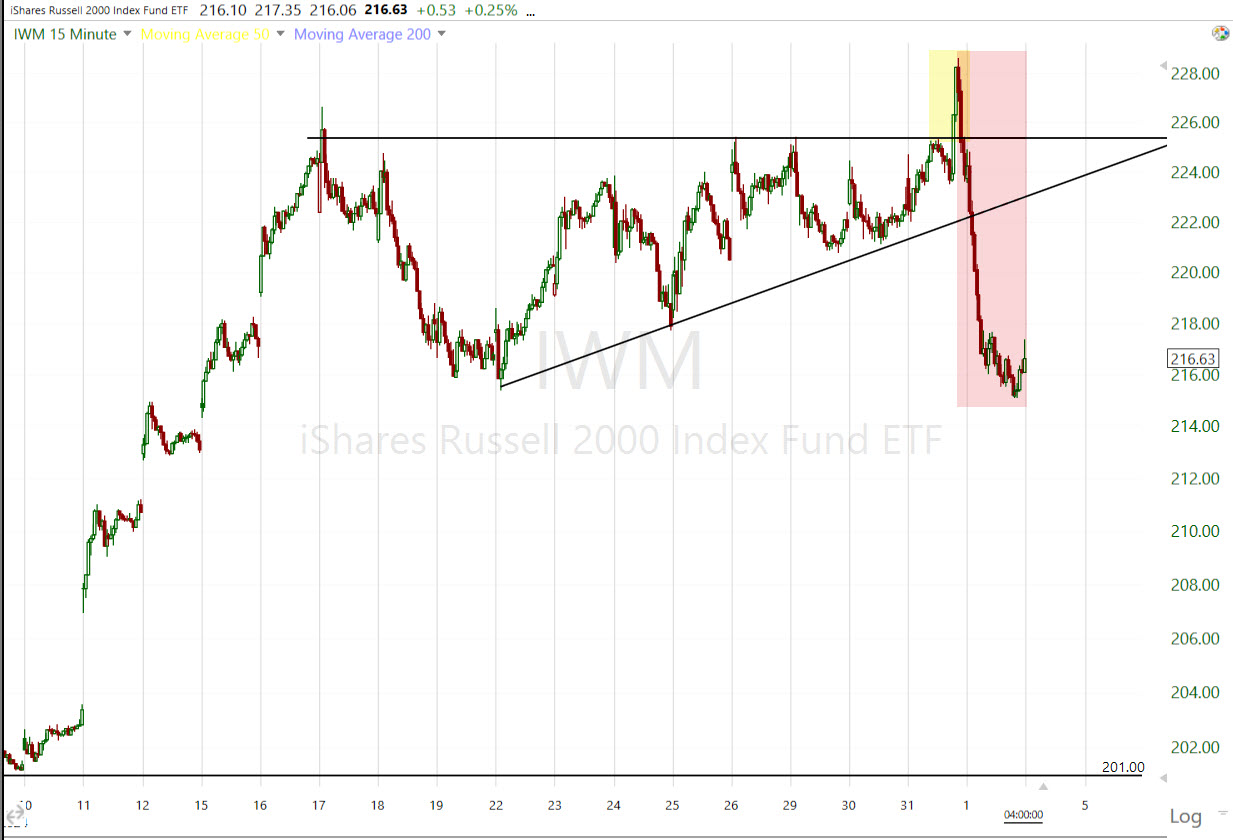 IWM (15m) – The breakout was perfectly timed… about 2/3rds the way into the consolidation, but of an 11% measured move, IWM didn’t even make one-and-a-half percent before failing, and a fast price reversal.
On a daily chart, it’s even uglier…
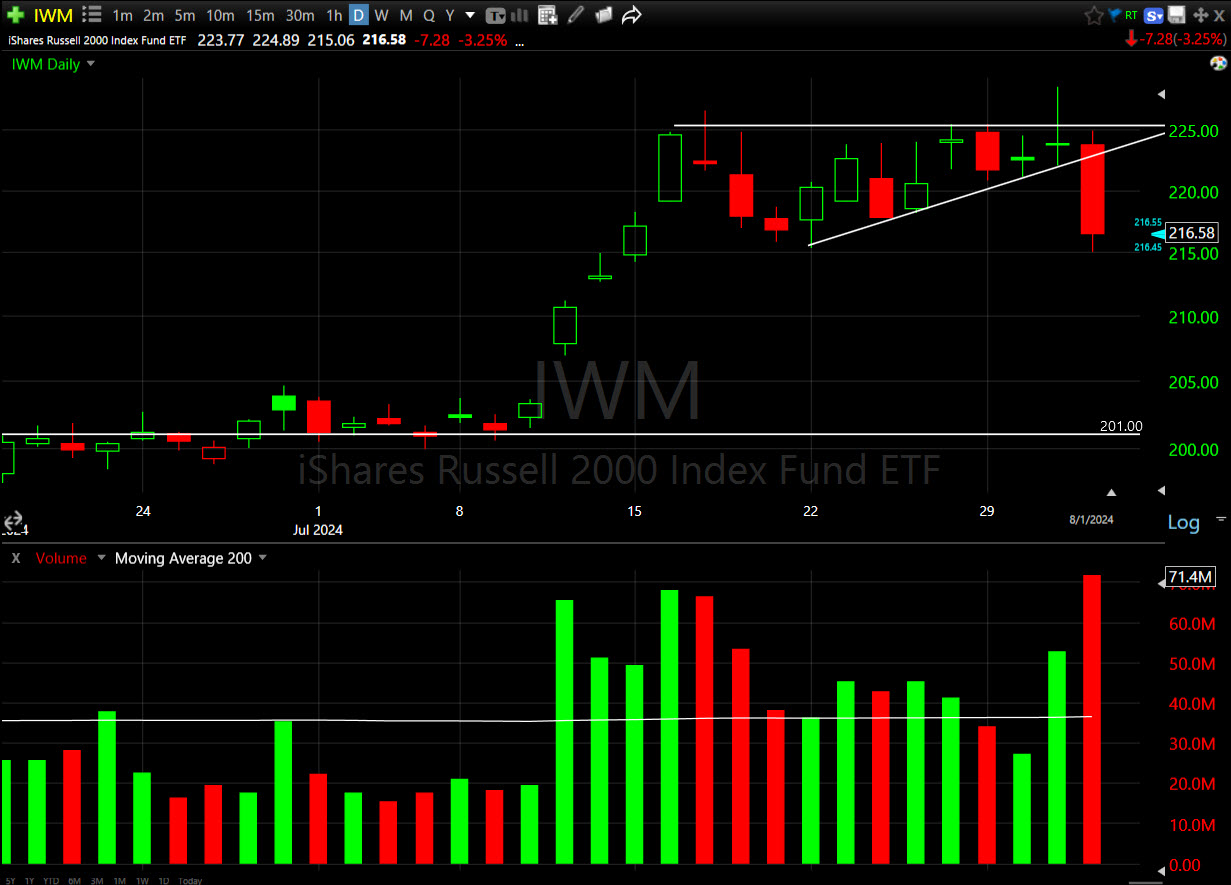 Look at that price candle today, closing near session lows, and look at the size of the volume.
The short covering Small Caps needed to rally simply was not there as the Small Cap Index tried to breakout…
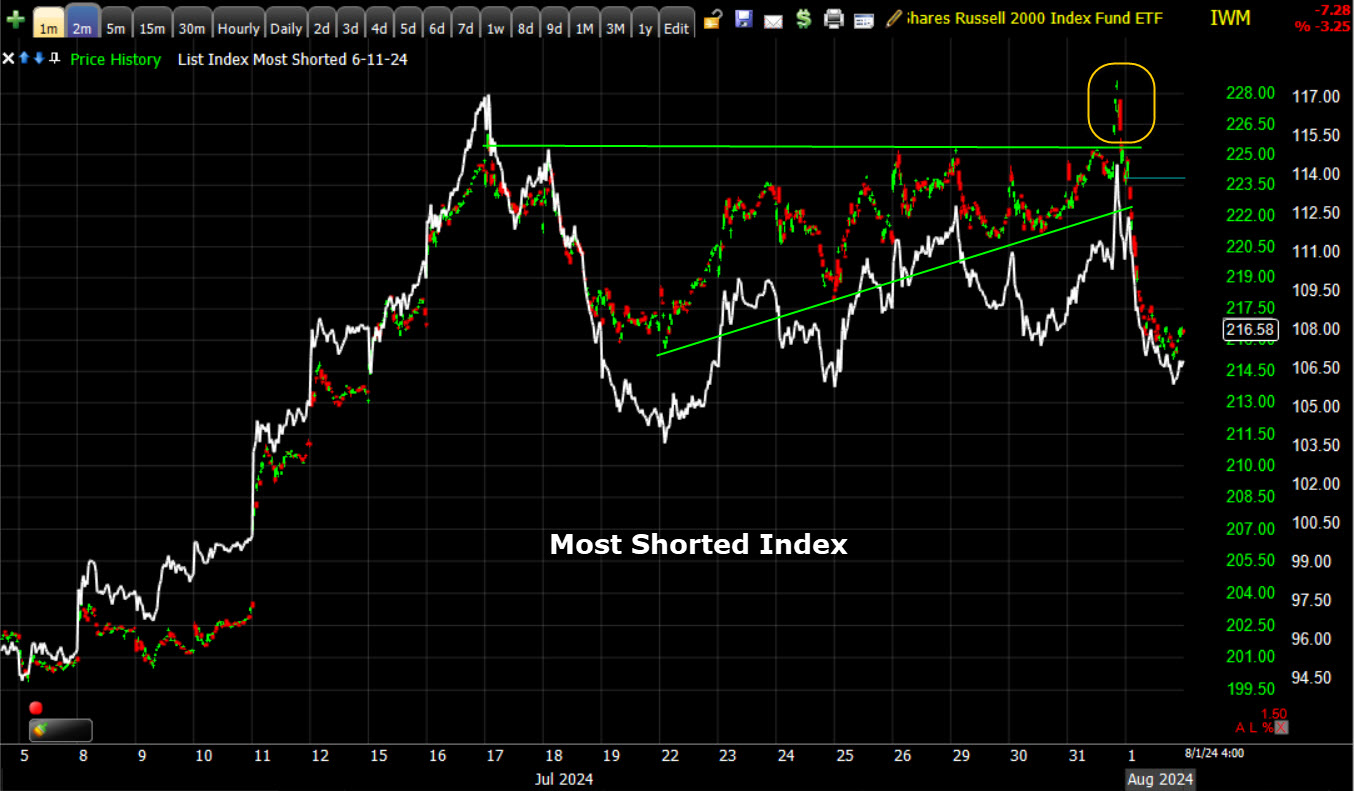 IWM & MSI (2m) There was no gas left in the short-squeeze tank as the MSI didn’t even come close to making a higher high.
VIX (+13.6%) made a slight higher high, bringing the gain since the first ABI signal to the typical average at 52%.
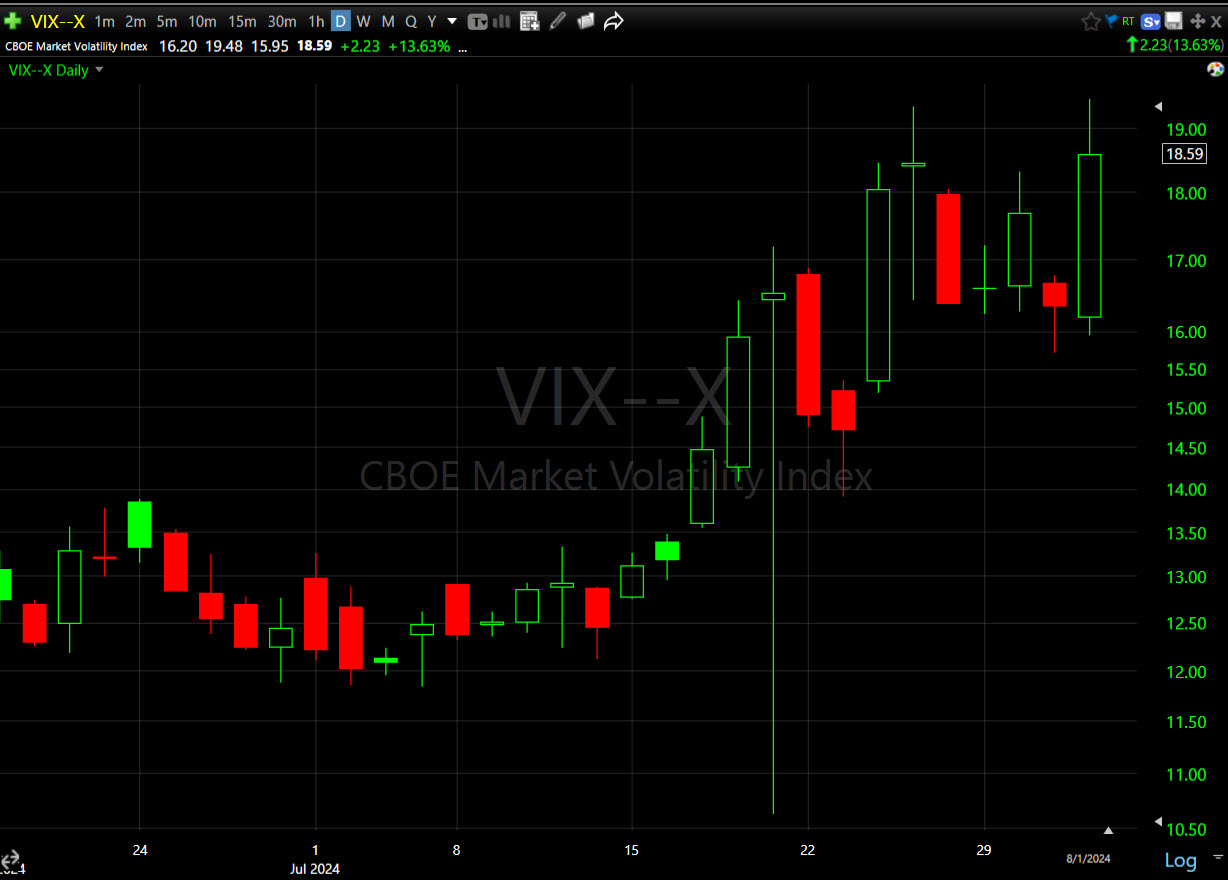 VIX (daily) closed off the best levels of the day of +24.4%, which is likely a reflection and reaction to the SPX and NDX landing back at technical support. However, with most of the averages closing at or near session lows, VVIX (+17.96%) seems to be anticipating more volatility ahead.
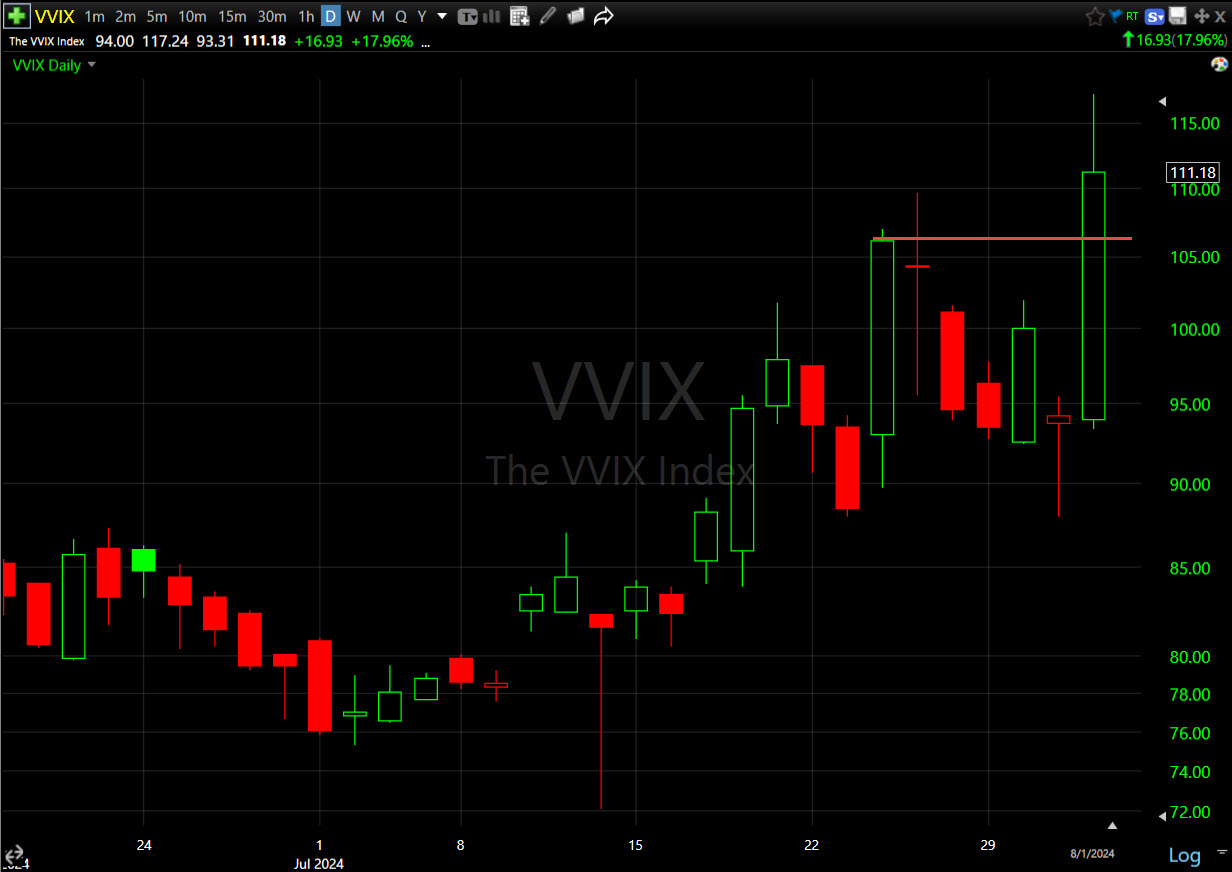 VVIX (the Volatility of VIX) with a more solid move higher, leading VIX in anticipation of more volatility ahead.
It’s been just over a month since the first ABI signal. Typically the volatility surge is good for about a month on average, but there are exceptions, like the early 2018 VIX surge of over 500% with a volatility surge signal that lasted several months. The ABI is currently at 24, coming down from 43 on July 17th. I don’t know if we’ll get another ABI signal or not, but with Small Caps’ failed breakout today, the odds of another signal went up.
S&P sectors
5 of 11 sectors ended higher. The drop in yields and an investor flight to safety supported rate sensitive, and defensive areas of the market like the Real Estate, Utilities, Health Care and Consumer Staples sectors.
The only other non-defensive sector to outperform was the Communications sector due to a solid gain in shares of Meta Platforms (META +4.8%), but even that was tarnished with META well off the early +11.2% morning high, then closed notably lower after having found technical support at its 50-day SMA…
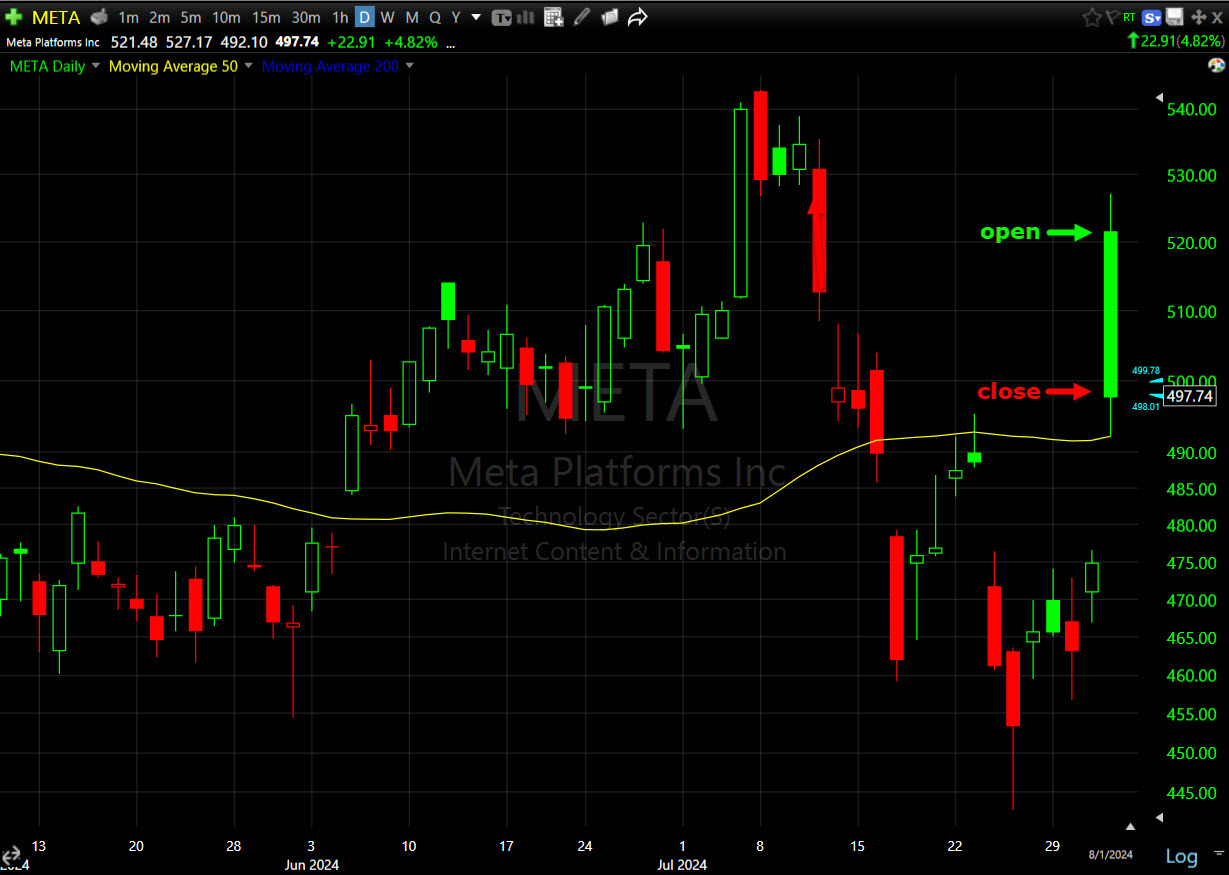 META (daily) and 50-day SMA; closing -5.5% off the morning’s opening high.
The heavily-weighted Technology sector registered the largest decline, dropping 3.7%.
Weakness in the Semiconductor space weighed on the Tech sector and led the PHLX Semiconductor Index (SOX) to close -7.1% lower to retrace all of yesterday’s gains and then some, and close at the lowest level since the middle of May.
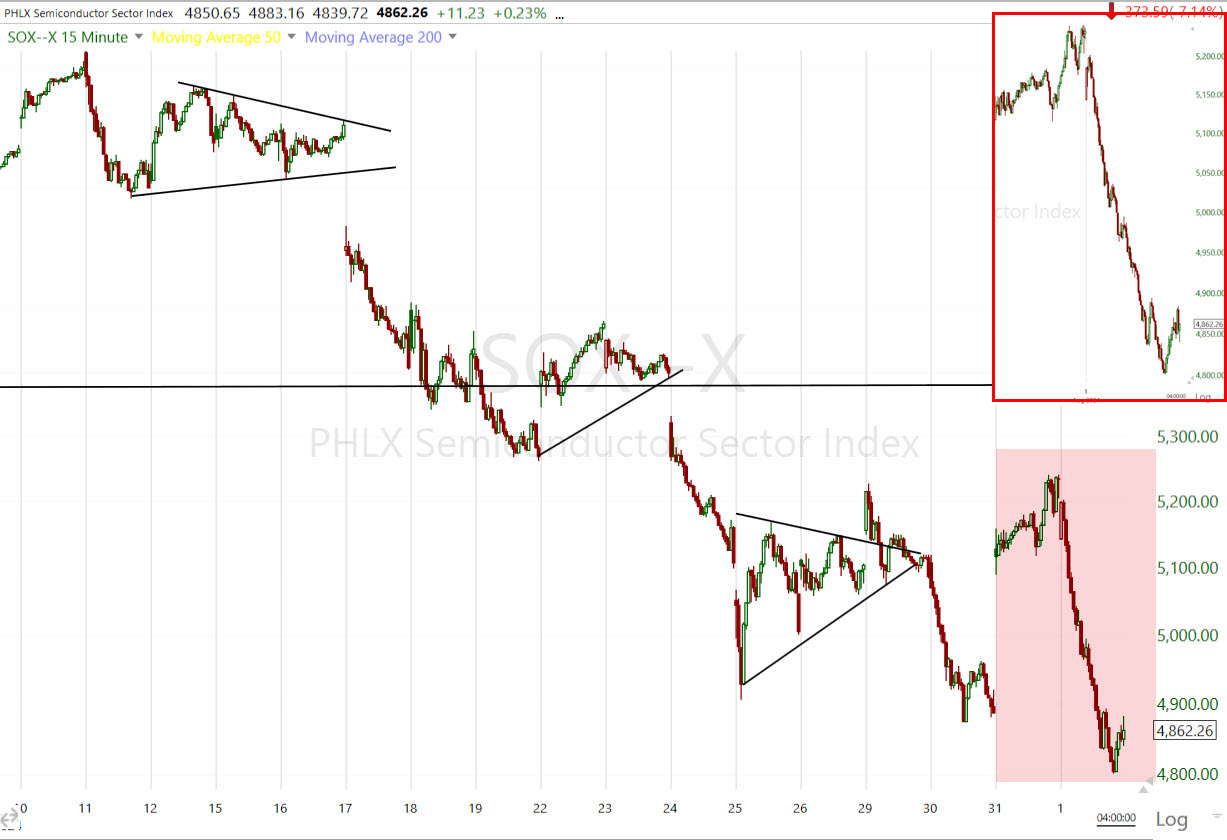 SOX Index (15m) – From the open, price dropped near vertically, slicing below the 100-day SMA that provided support yesterday.
The mega cap index (MGK) lost -1.65% after having found technical resistance at its 50-day (back-test). The mega-caps underperformed the Equal Weight S&P by 55 basis points – not much as many stocks went risk off.
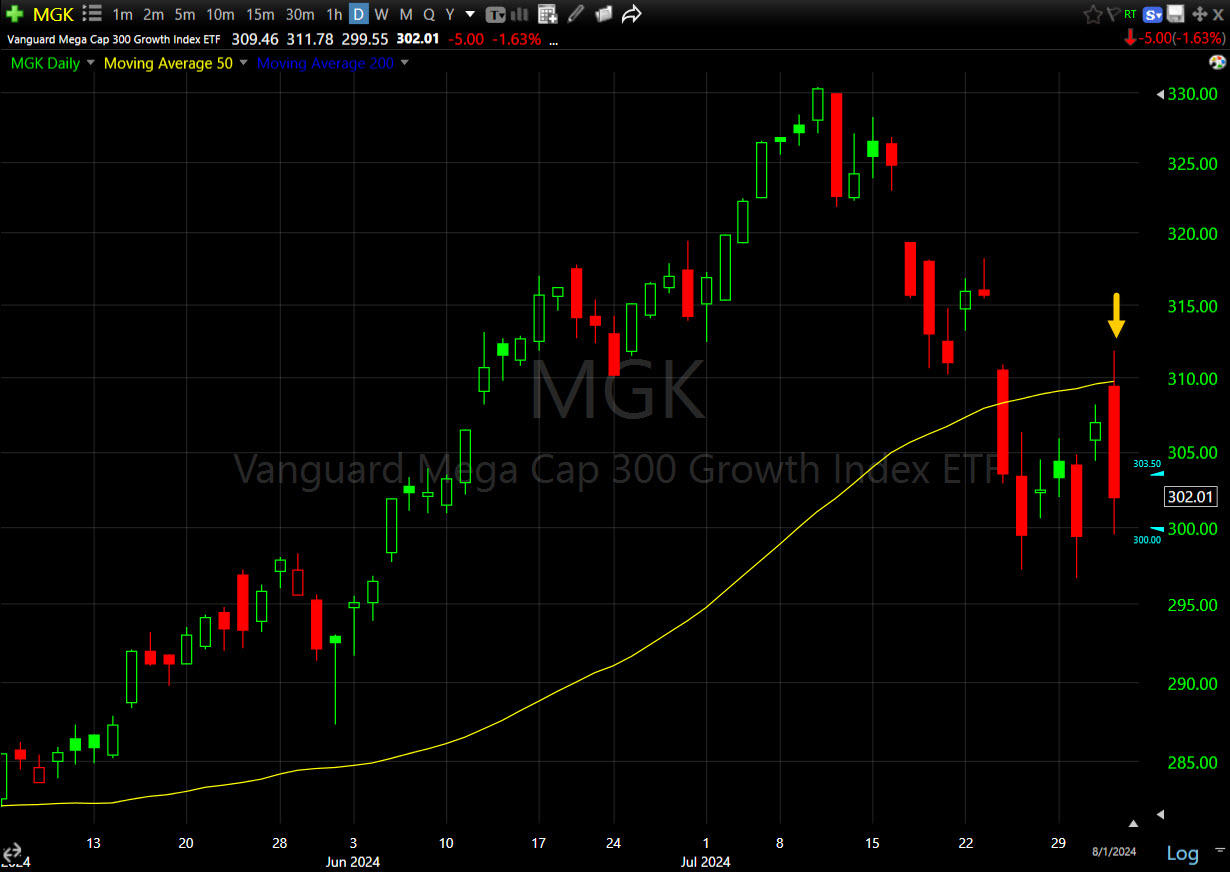 Mega Cap Index (MGK Daily & 50-day SMA) Another, “You Shall Not Pass” moment for the mega cap index at the 50-day acting as resistance, leaving the gap just above unfilled. All of those 3C divergences throughout Tech in June and July, are coming home to roost.
The Magnificent 7 mega-cap stocks lost $430 bln. in market cap today.
Materials ⇩ -0.40 %
Energy ⇩ -2.65 %
Financials ⇩ -1.42 %
Industrial ⇩ -1.85 %
Technology ⇩ -3.73 %
Consumer Staples ⇧ 0.92 %
Utilities ⇧ 1.80 %
Health Care ⇧ 1.02 %
Consumer Discretionary ⇩ -2.45 %
Real Estate ⇧ 1.55 %
Communications ⇧ 0.41 %
What’s happening is an old pattern I’ve seen more than once. It’s quite simple. Market leaders fail.
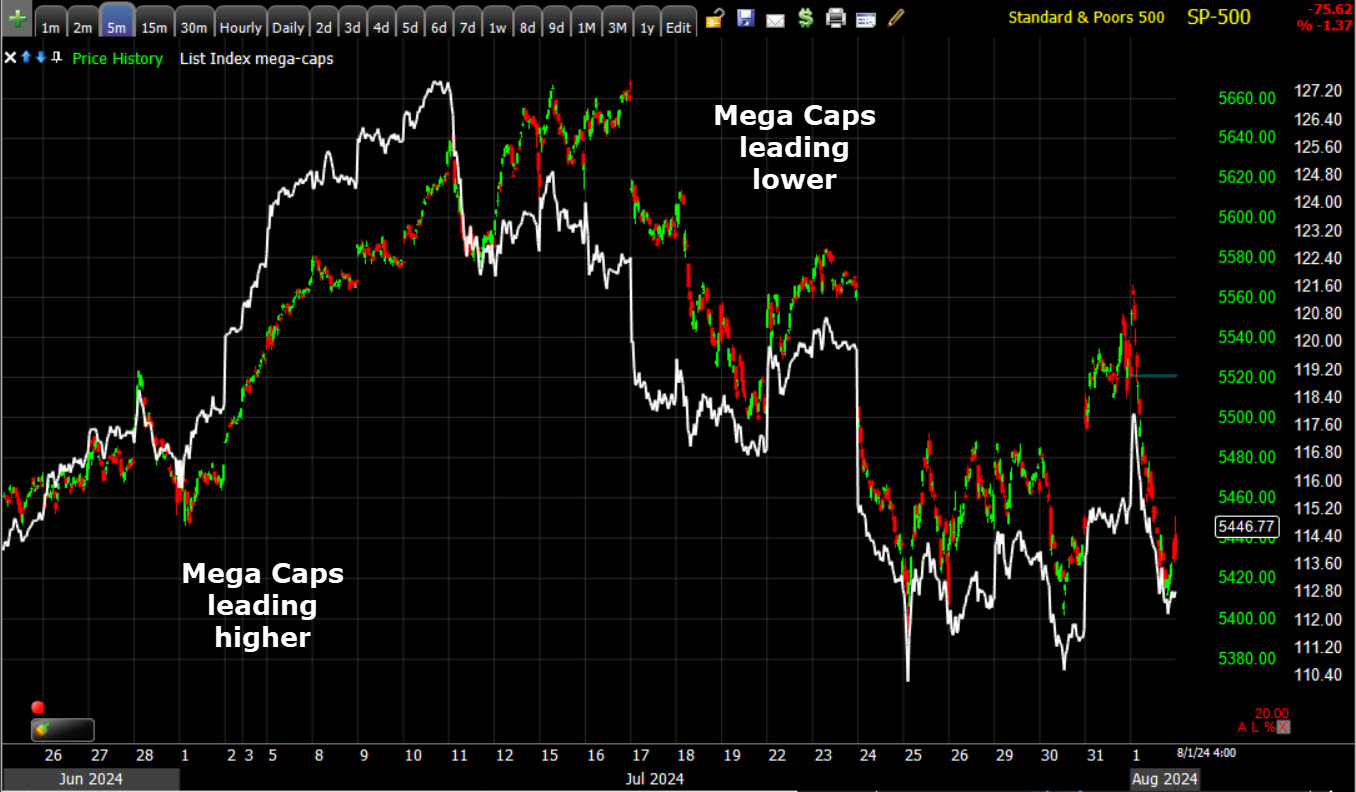 SPX (5m) and my Equal Weight Index of Mag-7 stocks.
There’s often some attempt for other stocks to rotate in to leadership. It’s usually Small Caps that are viewed as deep value as they did next to nothing during the broader market rally, as it has been several times in the past in a late stage, failing bull market….
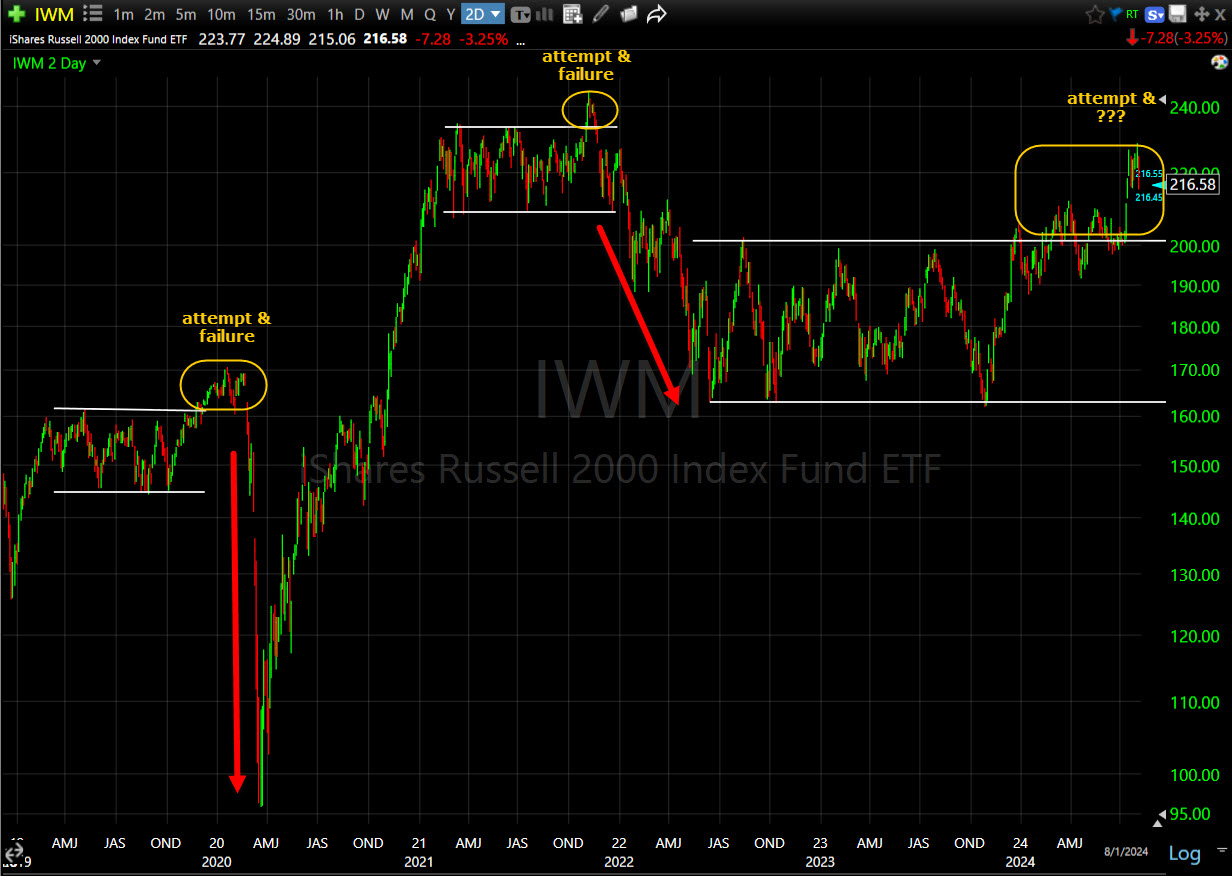 IWM (2-Day)
But, before that outright failure, investors try to protect their portfolio, remaining long, but making a mad dash for the Defensive sectors in a flight to quality/safety…
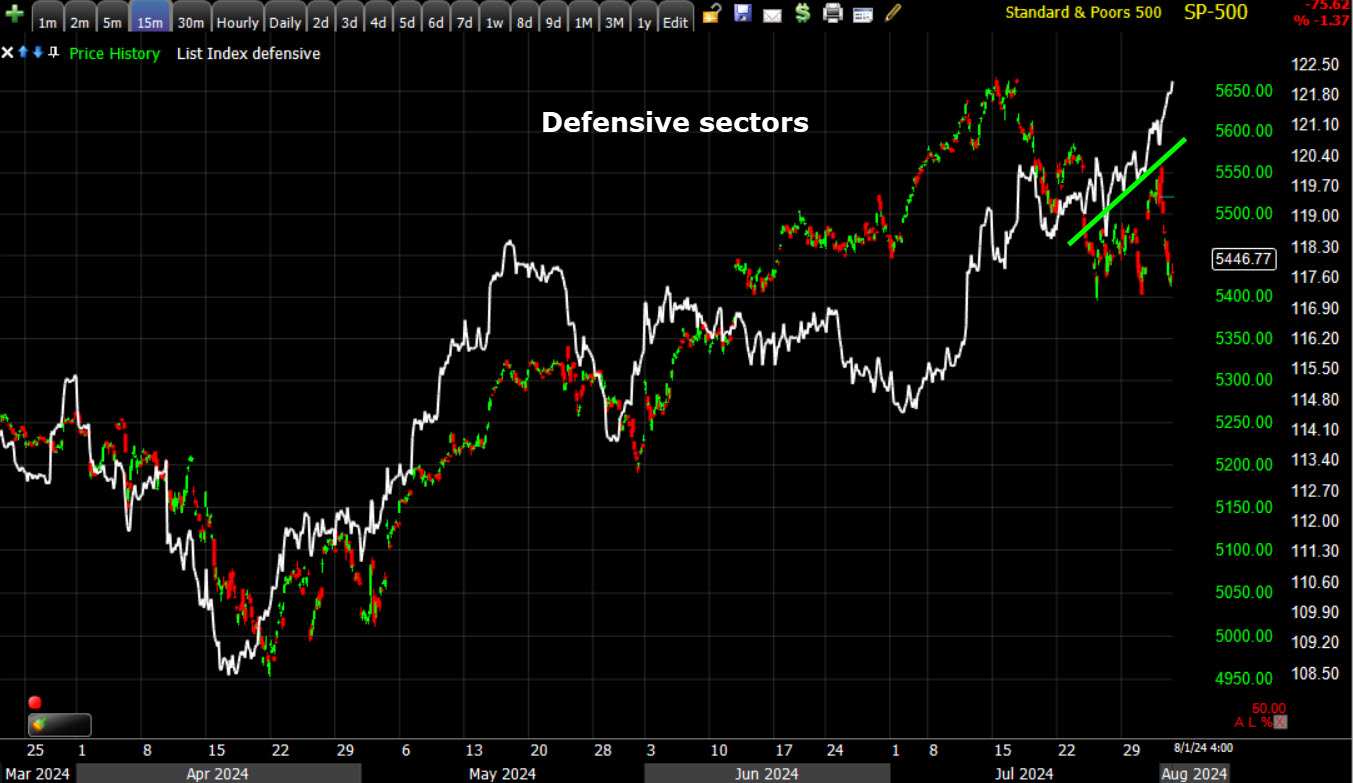 SPX (5m) and my Equal Weight Index of Defensive sectors. The defensive sectors see money flowing in to them as yields drop reflecting the weakening economic environment. It makes sense. If consumers are hurting, what are they still going to spend money on? The necessities… Consumer Staples like toilet paper and peanut butter; their utilities – the electric and water bills; and Health Care. So investors flock into those sectors.
I‘ve seen this before. ..
When the market starts to run into trouble, we often see a rotation to defensive sectors, like we did in the early part of the 2018 market sell-off…
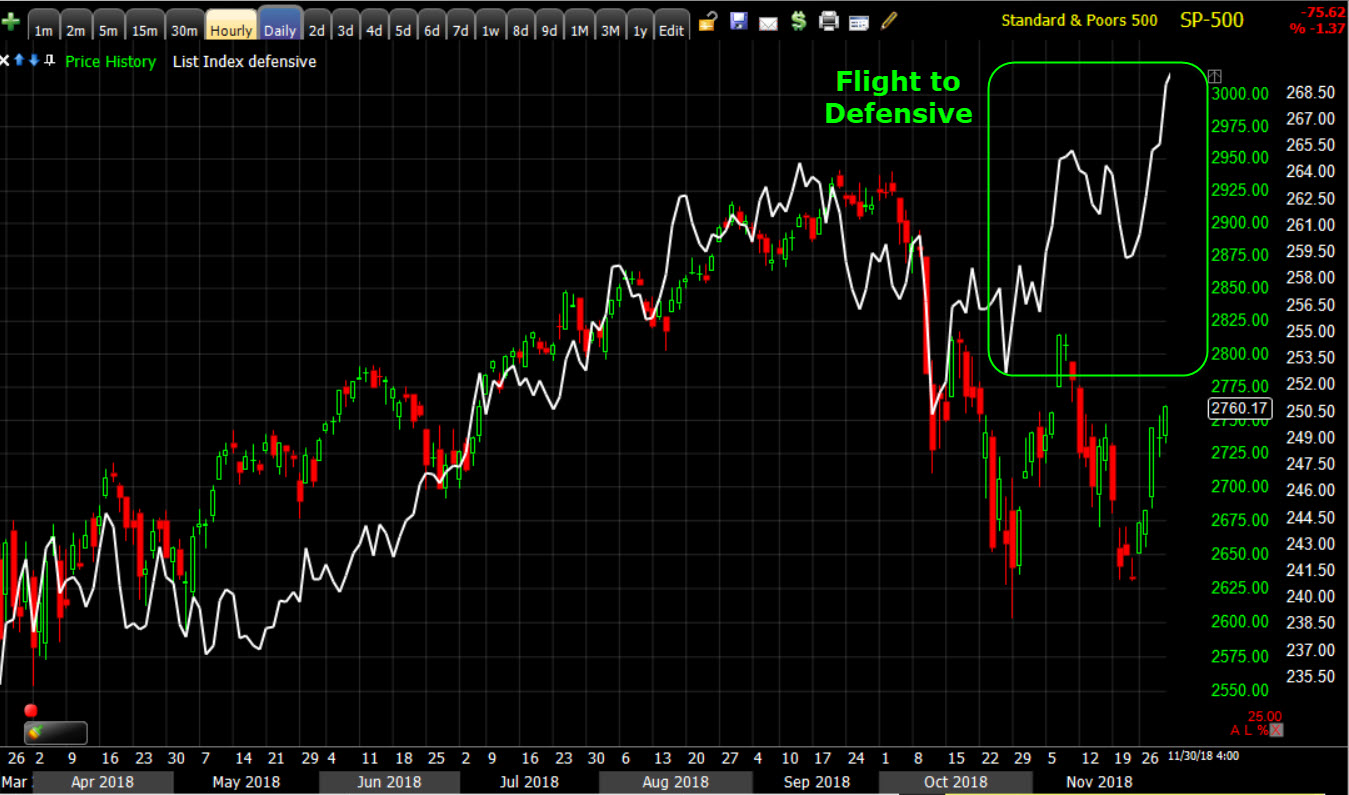 SPX (daily 2018) – Investors get nervous and move to the defensive sectors.
But when things really go risk-off…
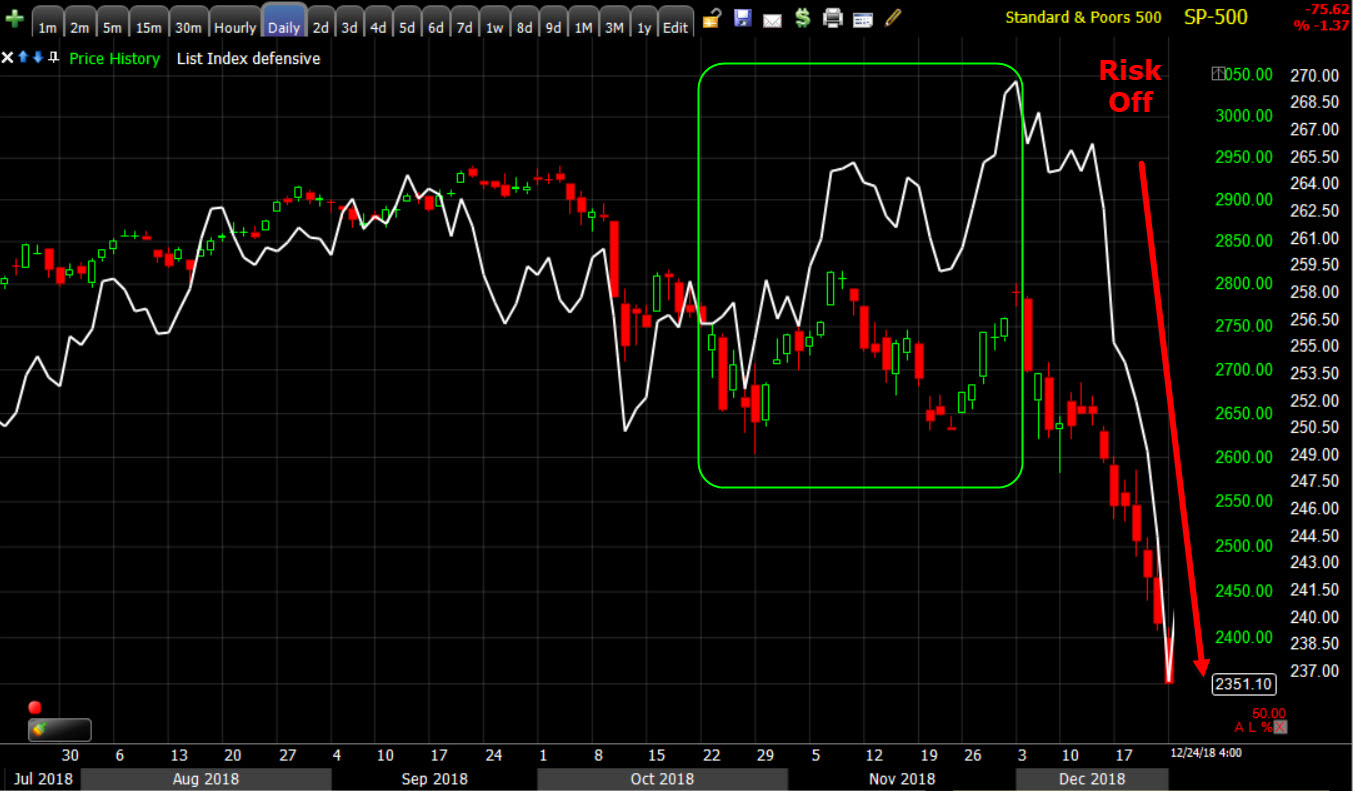 Everything comes down.
The same pattern happened in 2011 with the European sovereign debt crisis, as well as the U.S. credit rating downgrade and fears of a double-dip recession; and the same thing happened in 2007 ahead of the Great Financial Crisis.
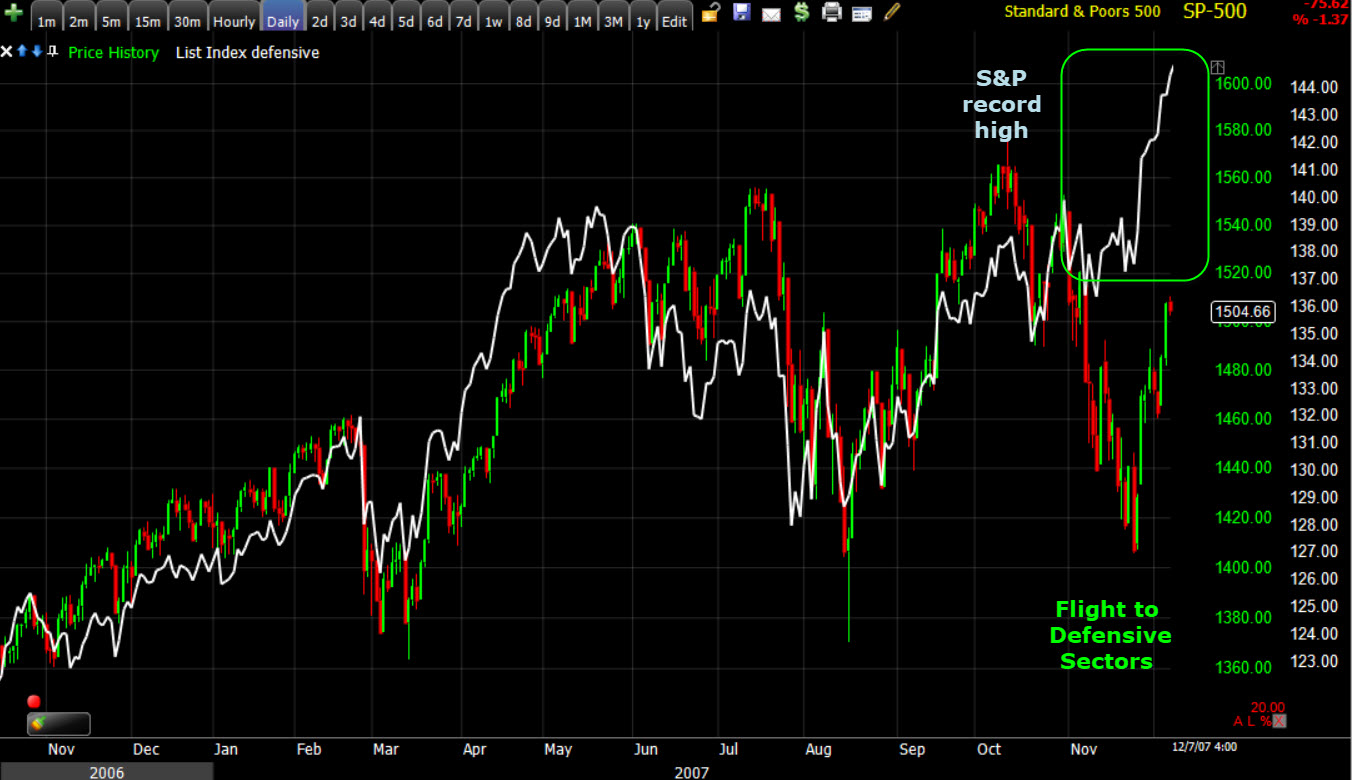 S&P (daily 2007) & Defensive Sectors’ “Flight to Safety”.
Here’s what happened next…
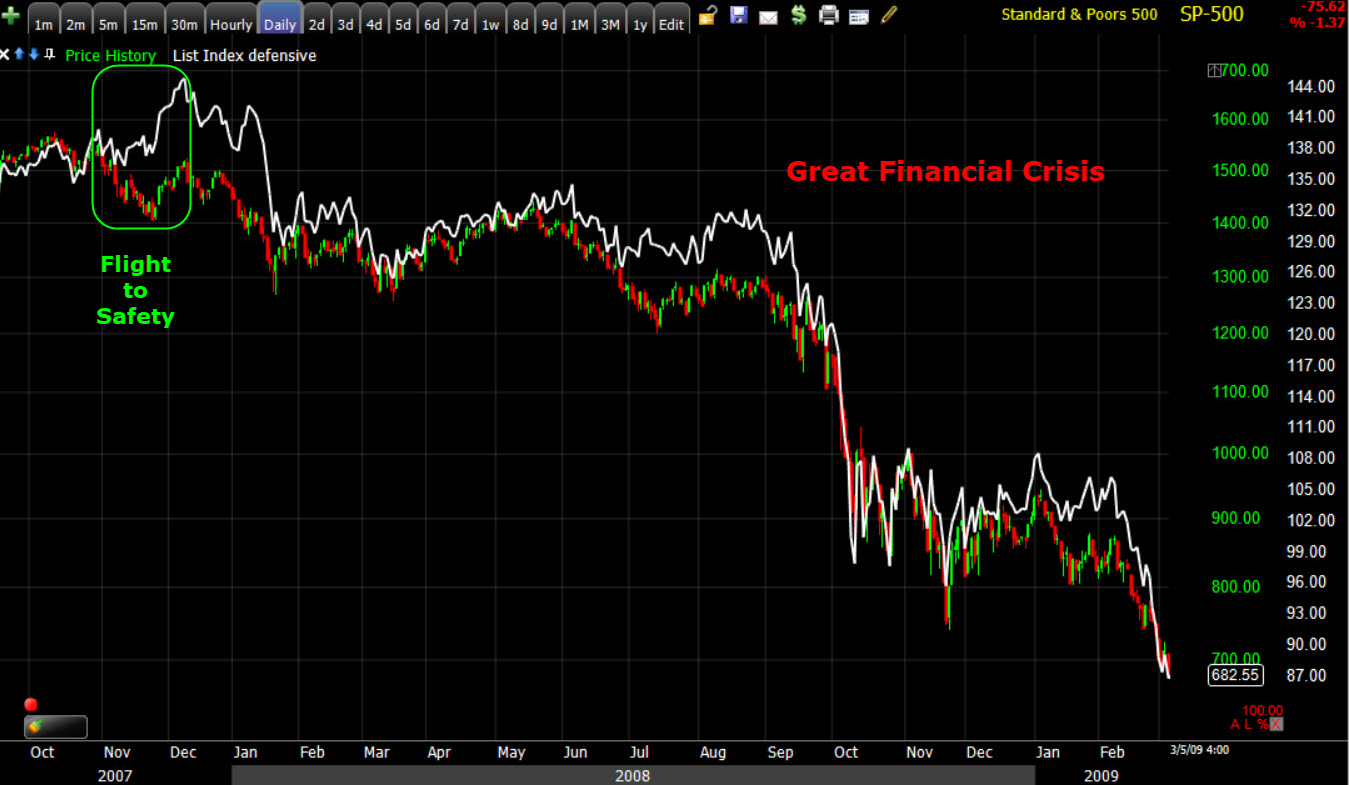 S&P (daily 2007-2009) and Defensive Sectors- Everything goes risk off.
Internals
NYSE Decliners (1812) outpaced Advancers (911) by nearly a 2-to-1 margin. Volume was heavy at 1.1 bln. shares, especially for summer.
The Dominant price/volume relationship wasn’t across the board, but dominant in the Dow and NASDAQ, coming in at Close Down/Volume Up. There is no 1-day oversold internals condition.
Treasuries
The Fed-sensitive 2-yr yield settled a staggering 18 basis points lower at 4.16%. The economically sensitive 10-yr yield settled below 4.00%, down 13 basis points to 3.98%.
If you recall my 3 Phases, Phase II is when the character of the market changes because investors start worrying more about an economic recession. With the 10-yr yield back under 4% for the first time since February, it seems to me we’re re-entering Phase II, which we saw briefly earlier this year before inflation picked up the first half of the year – recall the worst start to a new year in 2 decades in January?
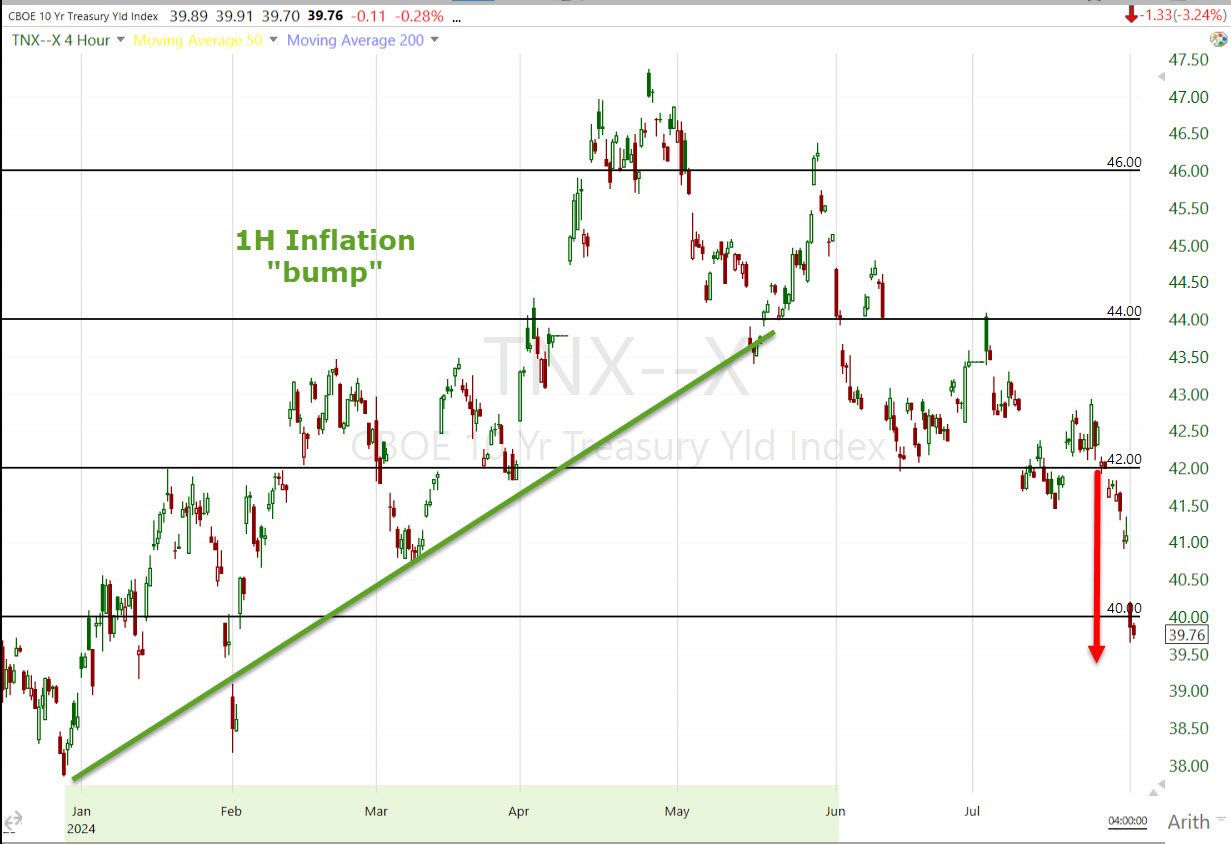 10-yr yield (4H) look how sharply yields are dropping.
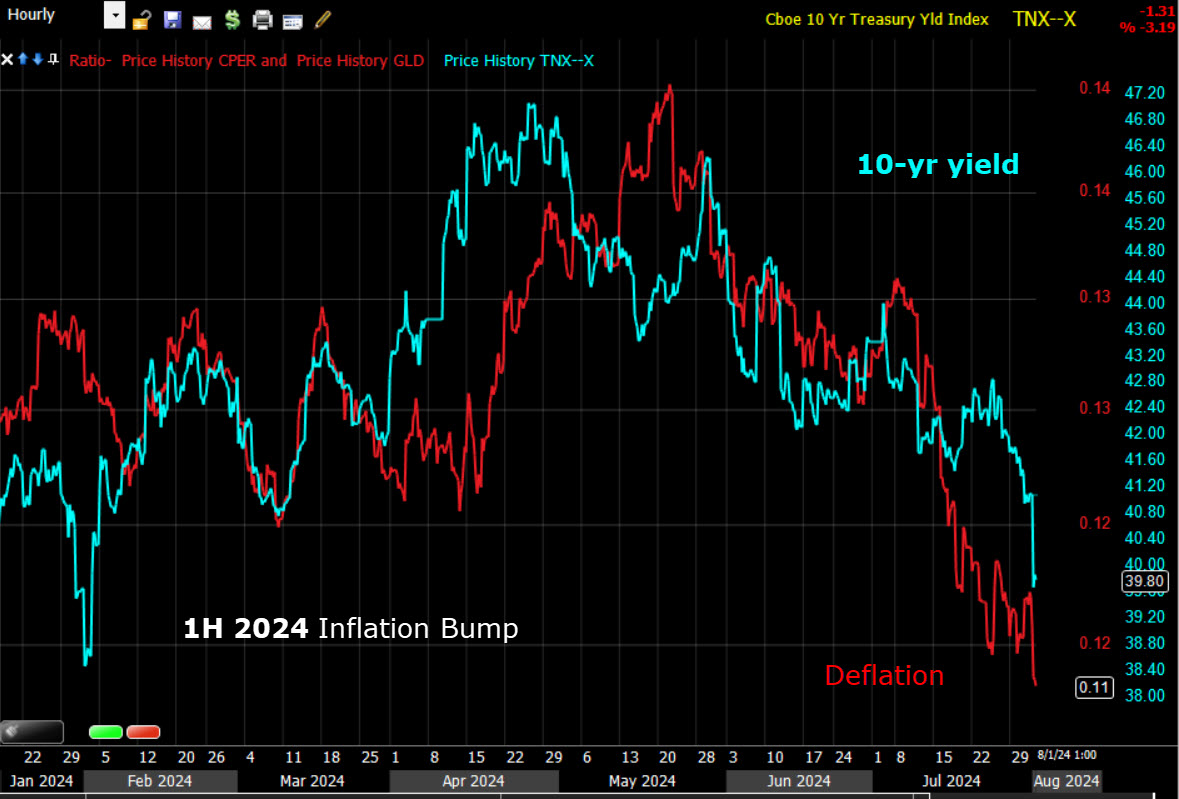
The Copper/Gold Ratio is saying the same…
In last night’s post-FOMC Daily Wrap, I wrote:
“The Fed is looking at things in more balanced manner… The Fed is no longer overweighting the inflation side of its mandate like it had been, but considering Jobs as well. That is a nuanced transition that is in-line with the comments heard from various Fed officials leading up to today’s decision.
Powell did emphasize the Employment side of the Fed’s mandate, saying that the Fed was ready to move if easing in Labor market goes beyond ‘gradual’ and that the Fed would not want to see ‘further material cooling’.
Initial Claims tomorrow morning could be market moving as they have been coming in, well, not so hot. And this is right in front of Friday morning’s key Payrolls report. I’d think the Fed already has that information (Payrolls), but I can’t say for sure, but under the right conditions, it would make sense why the Fed was reluctant to say what the market has already priced in at 100% odds, and why suddenly the Fed is more concerned with the dual mandate including employment, and not just what has been the focus – inflation.”
That’s being reflected in the bond market with the sharp, almost parabolic drop in yields, and that drop didn’t lift stocks today. Bad news used to be Good news for the market on rate cut hopes. Today, Bad economic news was Bad news for the market… a notable transition from what we have seen for quite some time.
High Yield Credit (HYG) had been gaining and out performing the benchmark S&P-500 recently, because of the drop in yields. Today we got a huge drop in yields, but HYG went RISK-OFF, rather than trading higher, and lost -0.75%. That may not sound like much if you’re not familiar with HYG’s lower beta, but you can see it on a price chart…
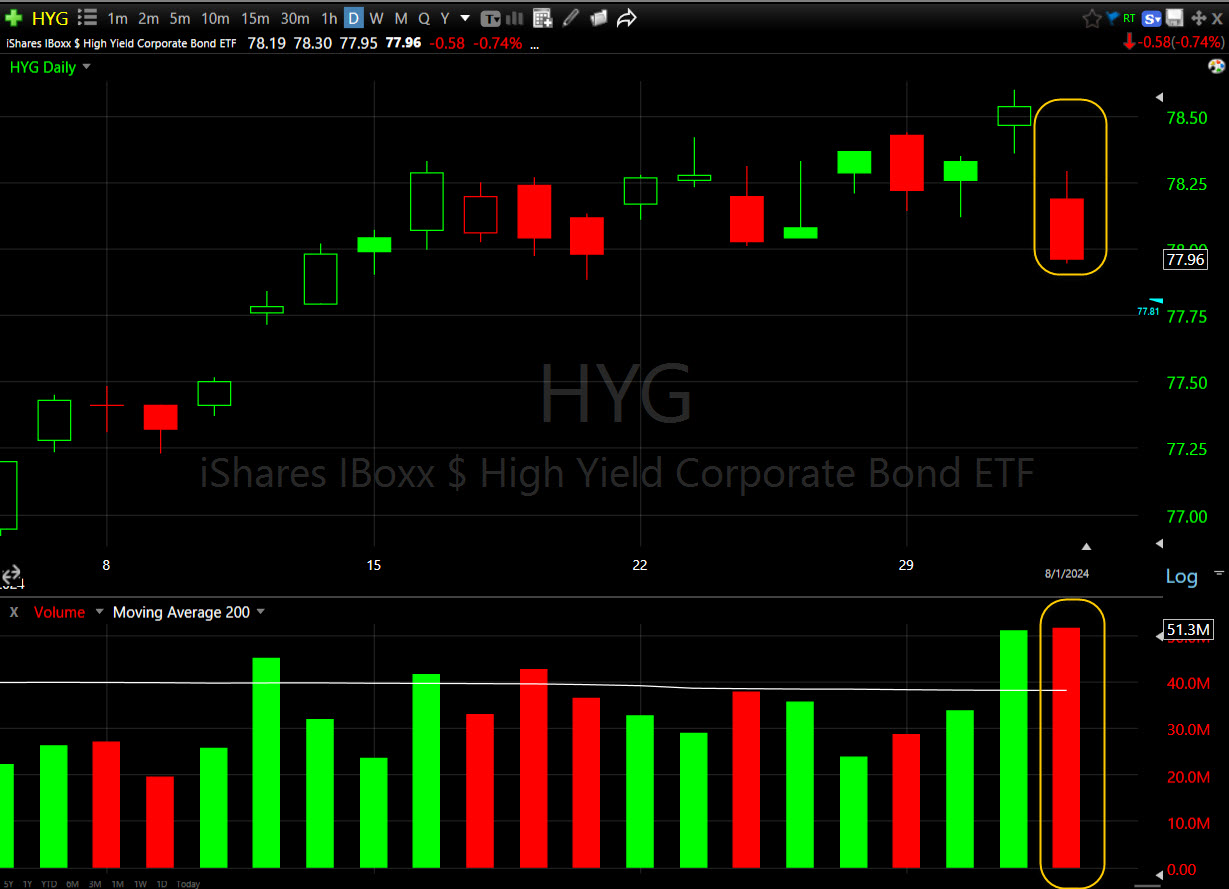 HYG (daily) – And you can see it in volume.
Currencies and Commodities
The U.S. Dollar Index was up about +0.3%.
Despite Mid-East Geopolitical risk, WTI Crude oil closed down -2.05% as investors worry about demand, and this despite 5 weeks of larger than expected inventory draws.
Gold futures settled +0.3% higher to $2,480.80/oz, holding near all-time highs as investors await tomorrow’s payroll readings. Remember what I’ve been saying all year… Gold is set to really run as both nominal yields and inflation come down in recessionary conditions.
We’re starting to see that sharp steepening in yield curves that is the imminent warning (as compared to curve inversion, which is a general warning) of recession…
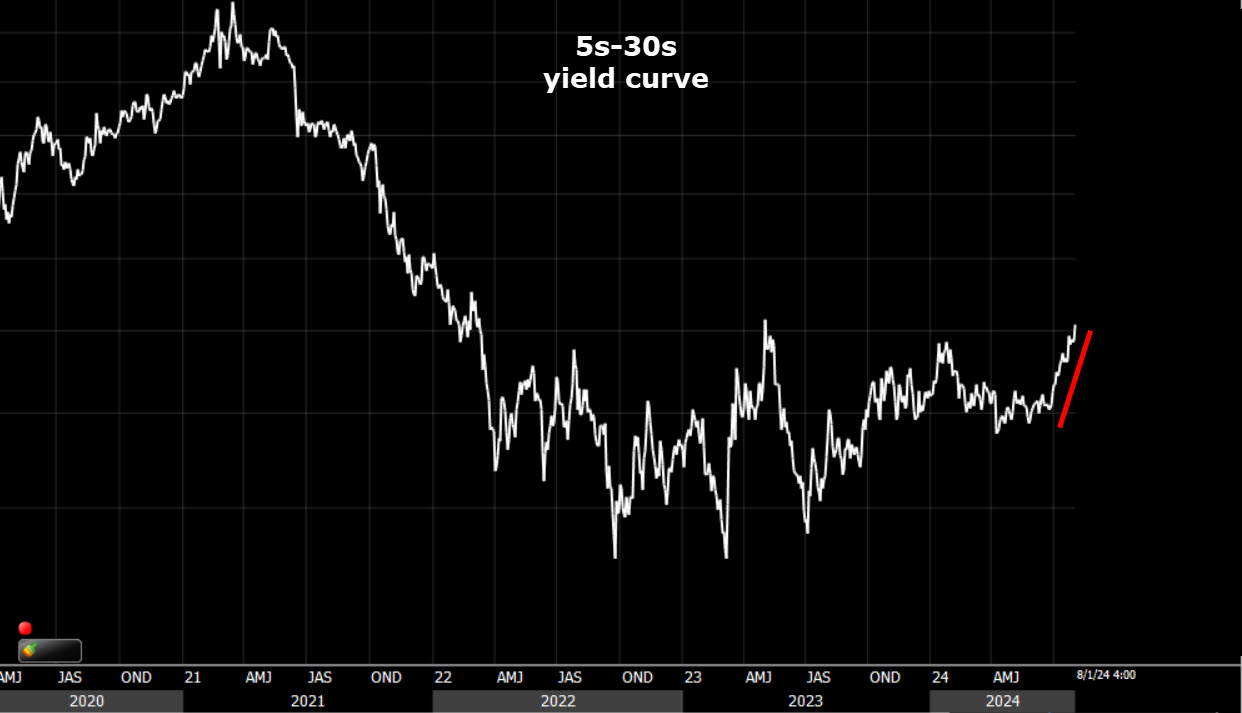 5s-30s yield curve flattening sharply into inversion, and now steepening sharply.
Bitcoin followed through with more downside this week, trading down to $62,200 before finding some support.
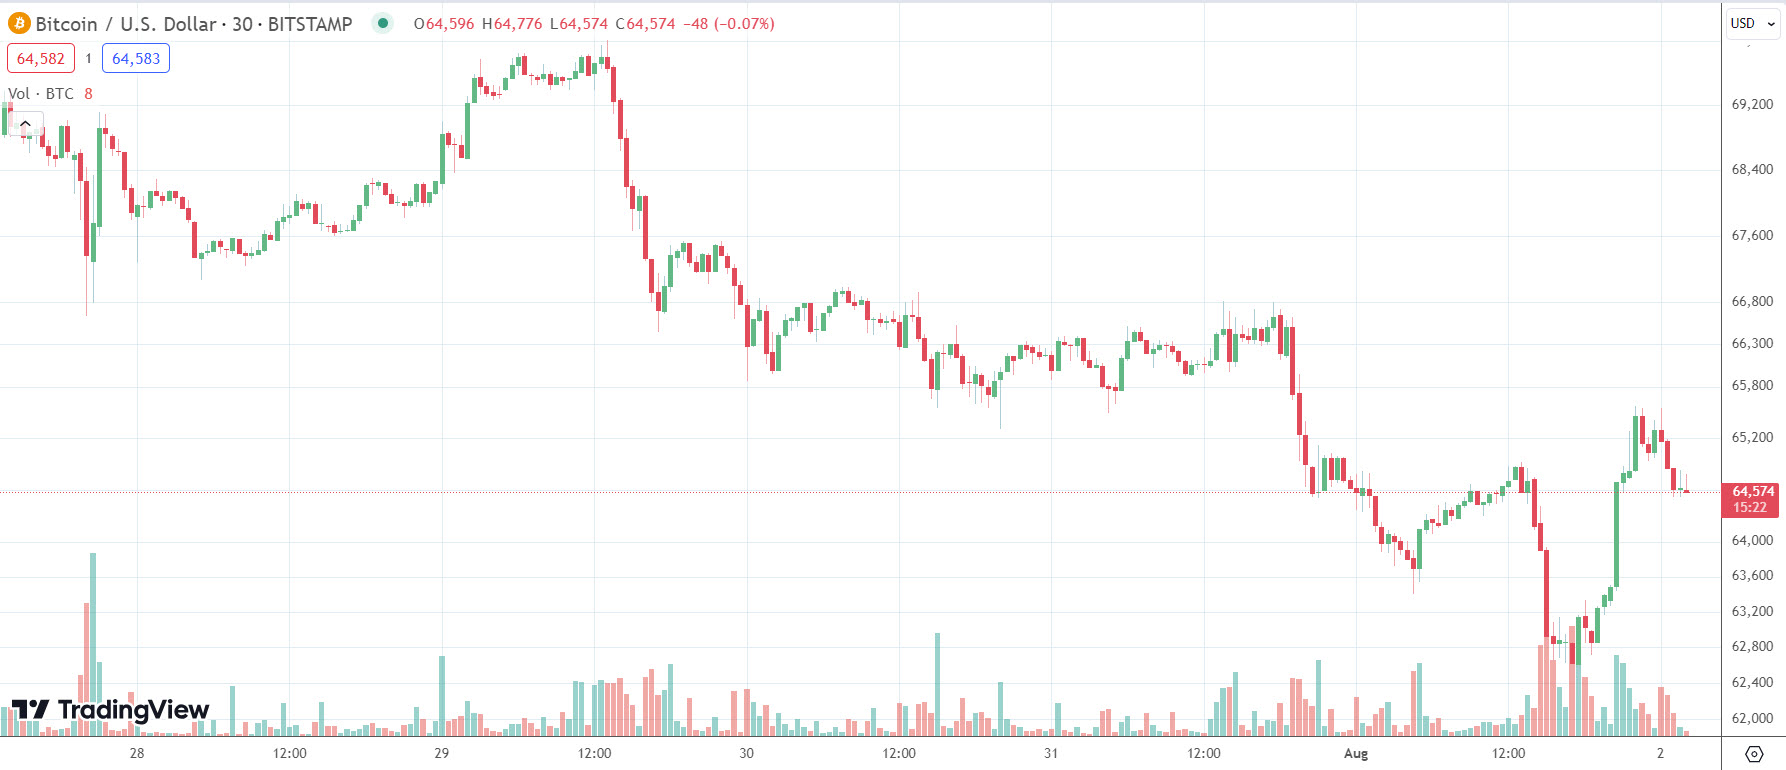
BTC/USD (30m)
Summary
I don’t have much to add, other than the fact that I’ve been writing about the concentration of top-10 stocks being the highest since the Great Depression for months, and the higher bar for this earnings season since early July.
Goldman Sachs trader Brian Garrett noted earlier, this has been the most volatile earnings season since the financial crisis.
Overnight
After reporting earnings after the close, Apple is down -1.1% and Amazon is down -8.35%.
S&P futures are down -0.95% and NASDAQ-100 futures are down nearly -1.5%.
VIX futures are up over 5%.
The U.S. Dollar Index is nearly flat (-0.03%)
WTI Crude Oil futures are up +0.35%
Gold futures are up +0.6%.
BTC futures are up+0.8% after finding some support.
Market participants will be focused on the July Employment Situation report tomorrow, which is released at 8:30 ET, and implications for Fed policy. Other data include June Factory Orders at 10:00 ET.