The averages were mixed in thin trade ahead of the week’s fulcrum events. In my view, that’s primarily Nvidia’s earnings Wednesday after the close, but even in a slower week for economic data (2 weeks ago) the market had some strong reactions to what I’d consider tier 2 data, most of which I’d rarely pay much attention to.
The macro data this week is relatively thin and it included: Existing Home Sales report for April and the FOMC Minutes (Wednesday), the Weekly Initial Jobless Claims report, New Home Sales report for April and Flash PMIs (Thursday), Durable Goods & Consumer Sentiment (Friday); and lots of Fed-speak with 15 officials scheduled to speak this week.
Index futures were roughly flat in pre-market just ahead of the open, but ramped on the cash open…
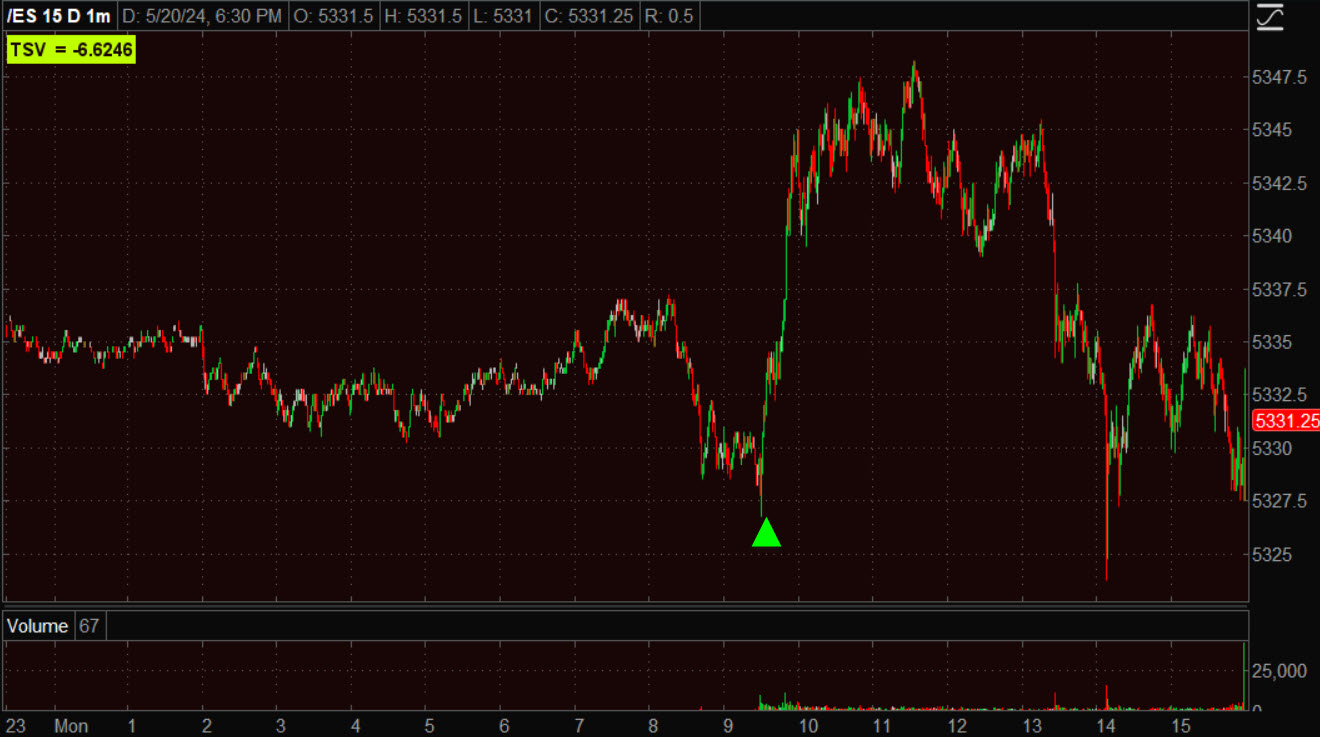 S&P futures (1m)
The support for the opening ramp was almost exclusively mega-caps in the early going, and semiconductors took the lead as the day went on…
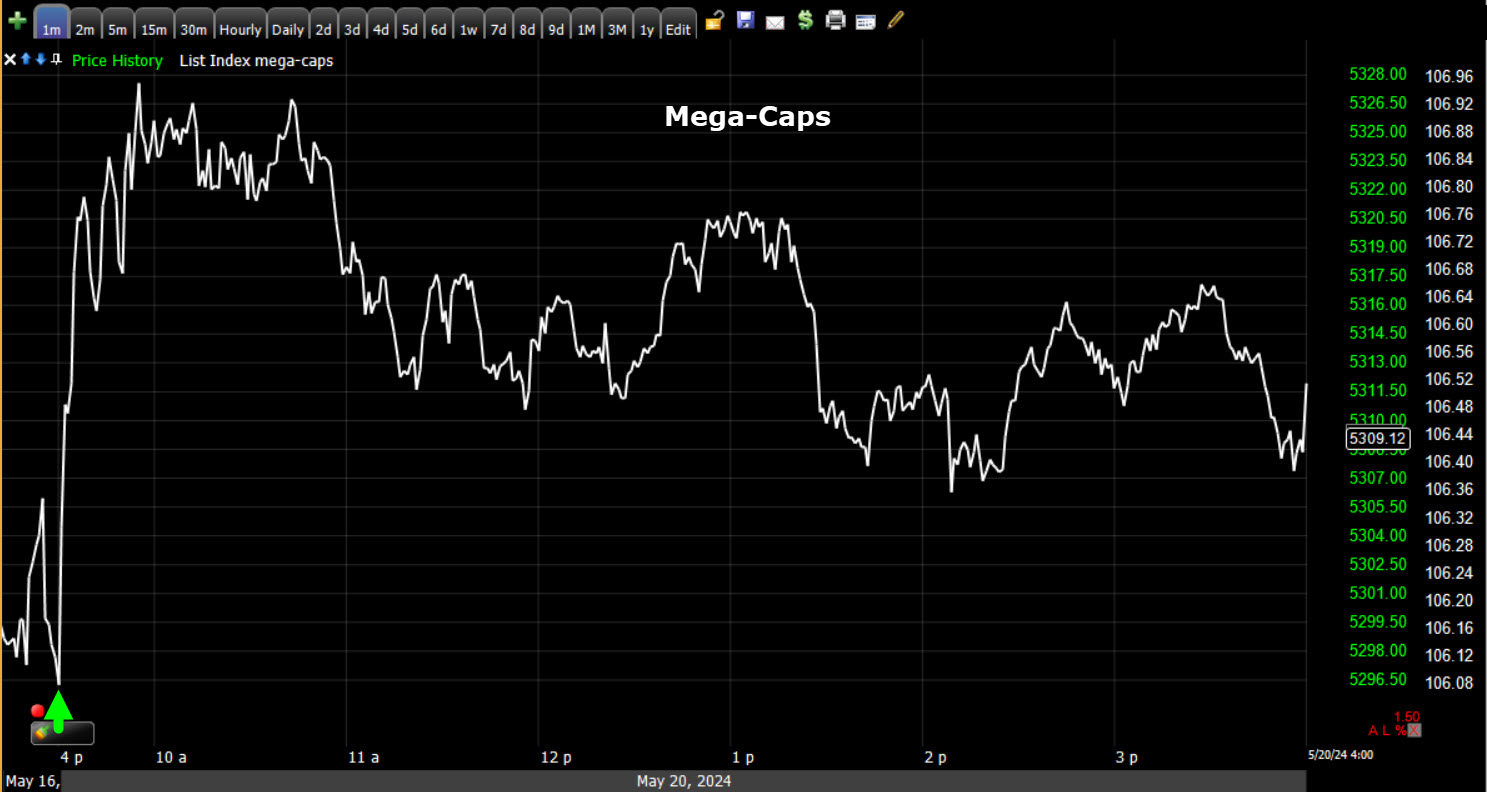 My Equal Weight Index of Mag-7 Mega-Caps (1m) with the open at the green arrow. The mega-caps faded a bit as the day wore on.
The most influential S&P sector led gains from the open – Technology. While mega-caps supported the cap-weighted averages, it was Semiconductors (SOX Index +2.15%) that led the Tech sector ahead of Nvidia’s earnings, sparked by several upgrades of stocks in the group. NVIDIA (NVDA +2.5%) was a winning standout from both semi and mega-cap spaces after several analysts raised their price targets in front of NVDA’s earnings report Wednesday afternoon. Microsoft (MSFT +1.2%) also logged a decent gain for the Technology sector after introducing Co Pilot+ PCs and in front of its Build Developers Conference, which starts tomorrow.
The Dow took a dive this afternoon after comments from JPMorgan Chase CEO, Jamie Dimon, speaking at JPM’s Investor Day, announcing that the company is not expecting to buy back a lot of stock at these levels and offering a pessimistic view of the future,
“I’m cautiously pessimistic. We have the most complicated geopolitical situation that most of us have seen since World War II, if you study history. We don’t really know the full effect of QT. I find it mysterious that, somehow, it had this beneficial effect, but it’s not going to have a negative effect when it goes away. I personally think inflation is a little bigger than people think and that rates may surprise people.”
There was no US economic data of note today and will be none tomorrow.
Averages
The NASDAQ-100 outperformed largely due to Tech/Semiconductors. The S&P-500 barely eked out a gain and ended the day just about where index futures started the day, giving back most of an earlier half-percent gain. Small Caps initially outperformed with the NASDAQ-100, but gave back about half of an earlier gain of +0.7%. The Dow and Dow Transports (-0.5%) were the worst performing of the majors.
S&P-500 ⇧ 0.09 %
NASDAQ ⇧ 0.69 %
DOW JONES ⇩ -0.53 %
RUSSELL 2000 ⇧ 0.31 %
The S&P gave up most of its earlier modest gains…
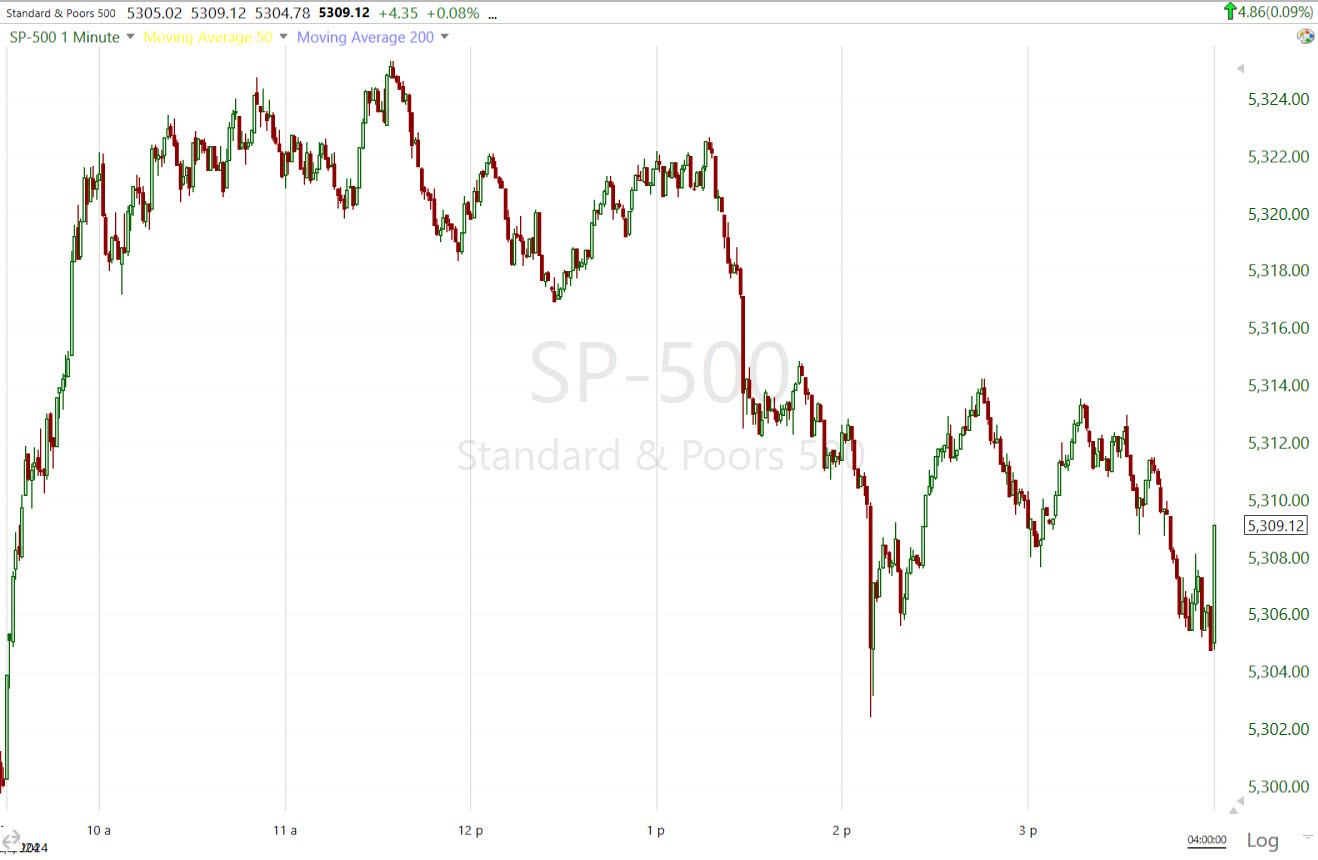 SPX (1m today)
but remains in an uptrend off the April low…
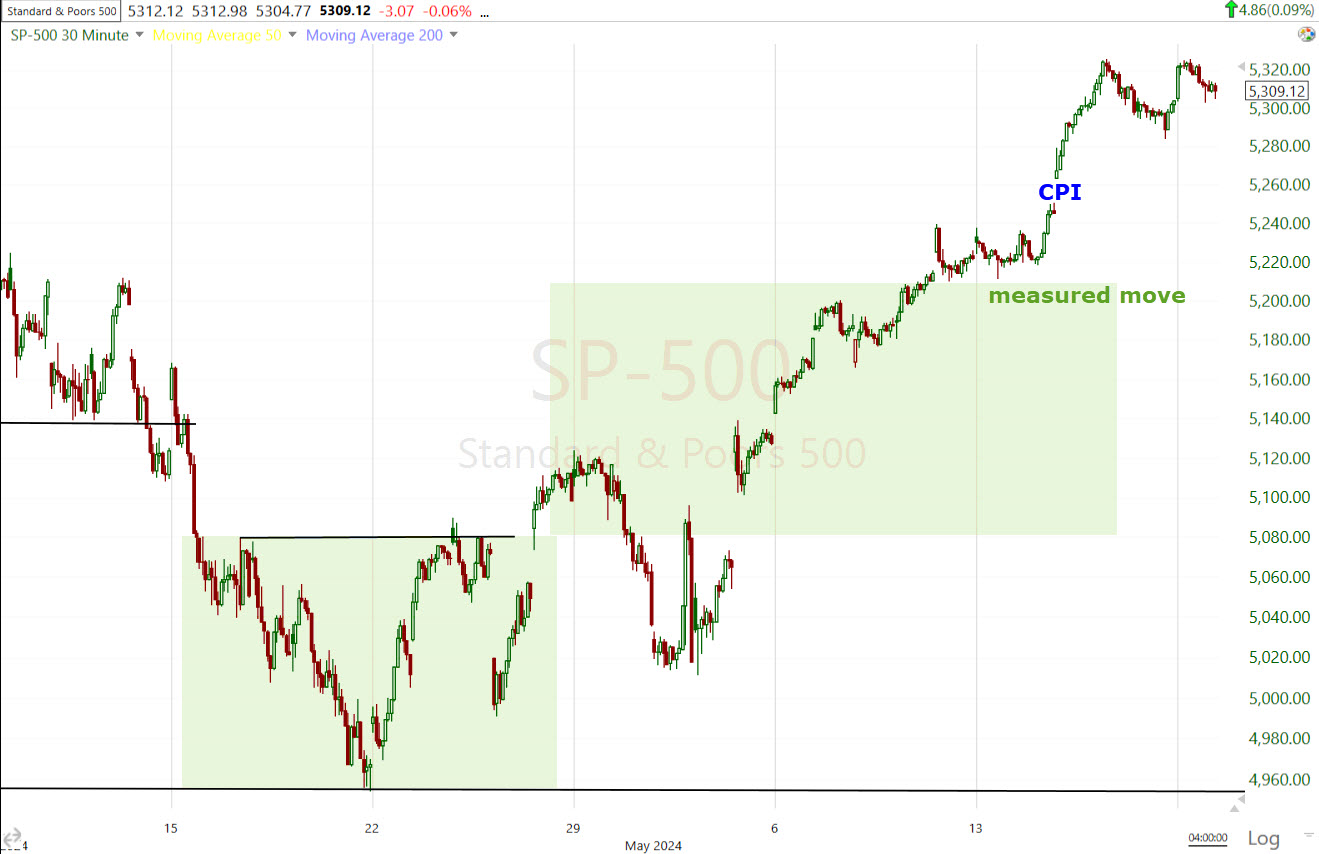 SPX (30m) measured move and CPI-related gain adding to it for the record high.
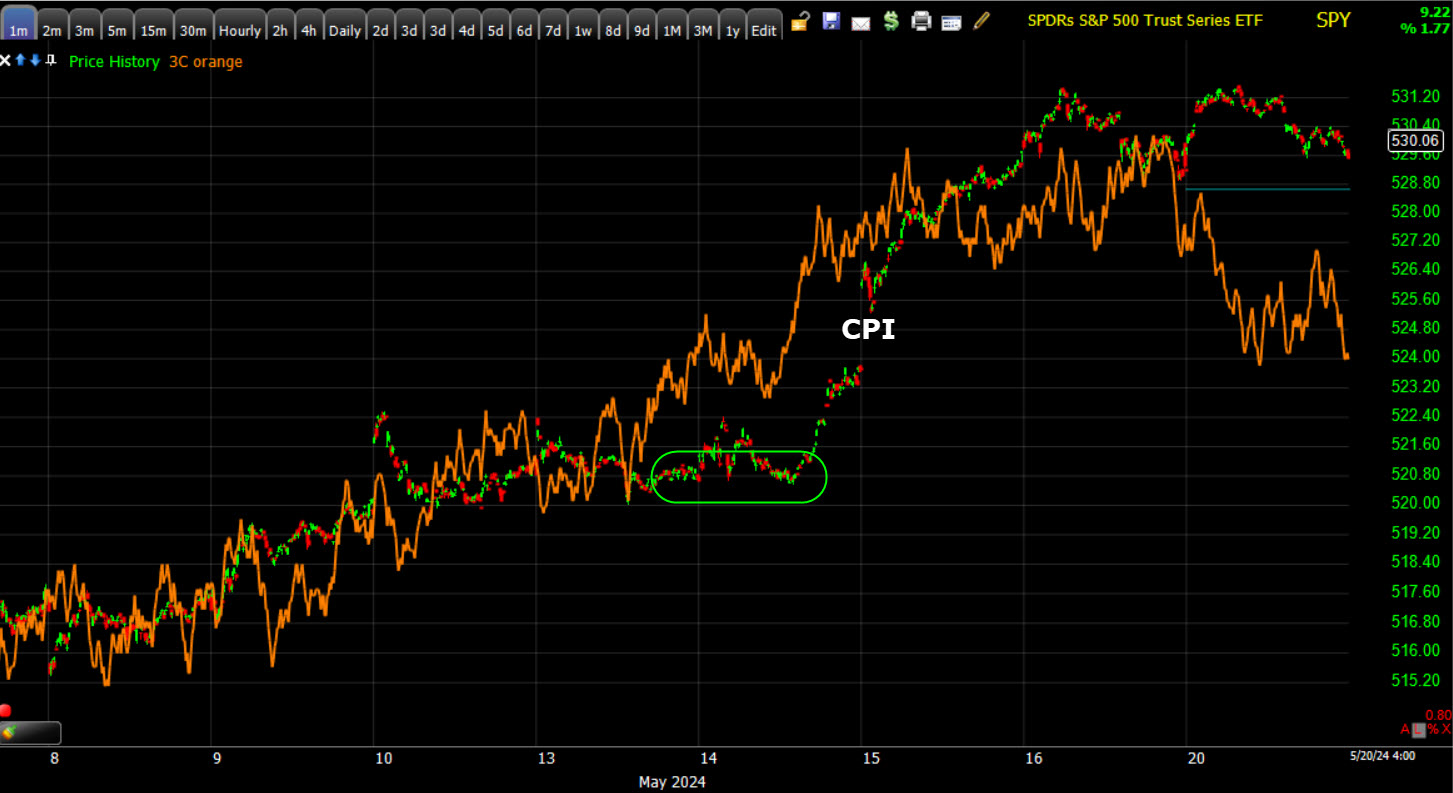 SPY (1m) 3C didn’t change a whole lot today, but was slightly more negative compared to recent price/3C action’s confirmation on the timeframe.
Only 10 of 30 Dow Jones Industrial Average stocks closed higher. JPM was the worst performing stock in the index. The Dow took a sharp turn lower just before noon and accelerated just after 1 p.m. as JPM faded.
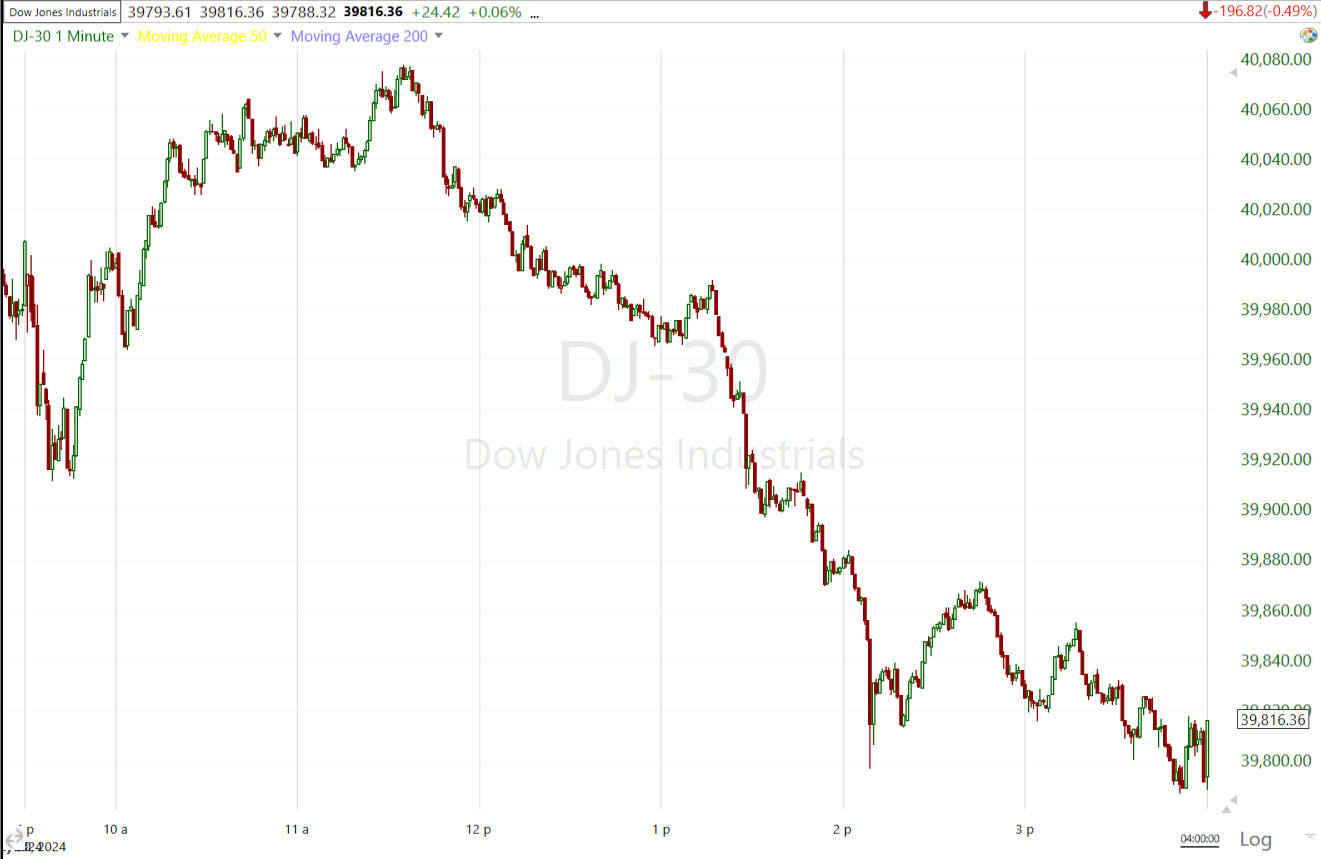 DJIA (1m) intraday tested above $40k for a second day before losing the level again.
As I was saying late last week, the early part of a breakout — if it is not very definitive and strong — is one of the most dangerous times for a breakout or new high, with the risk of a failed breakout/fast reversal.
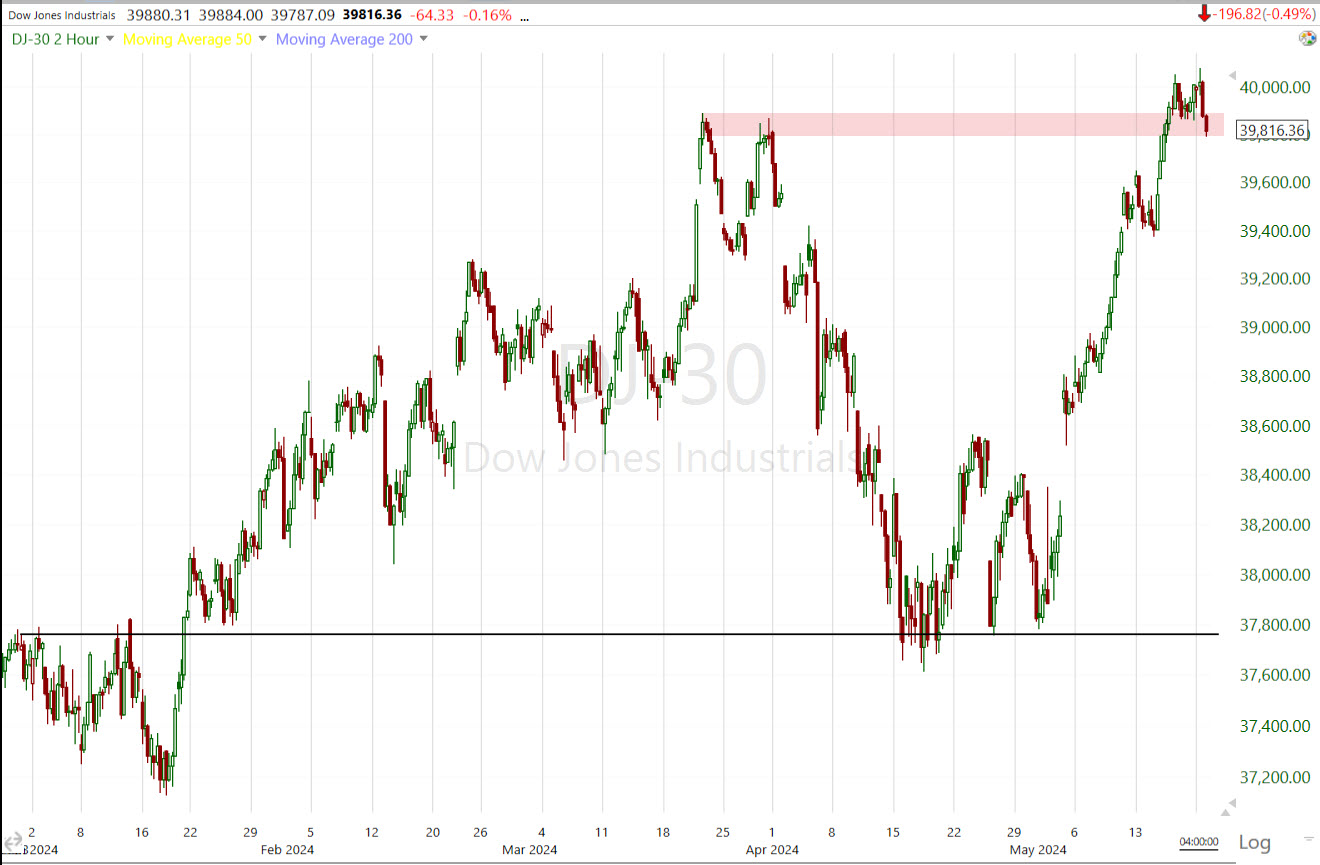 DJIA (2H) is flirting with a failed breakout as price closed just under the prior March highs. I would consider a move down to and below $39,400 as a failed breakout/new high and subject to the high risk of a fast downside price reversal. That’s a serious risk that’s just a little more than 1% lower than today’s close.
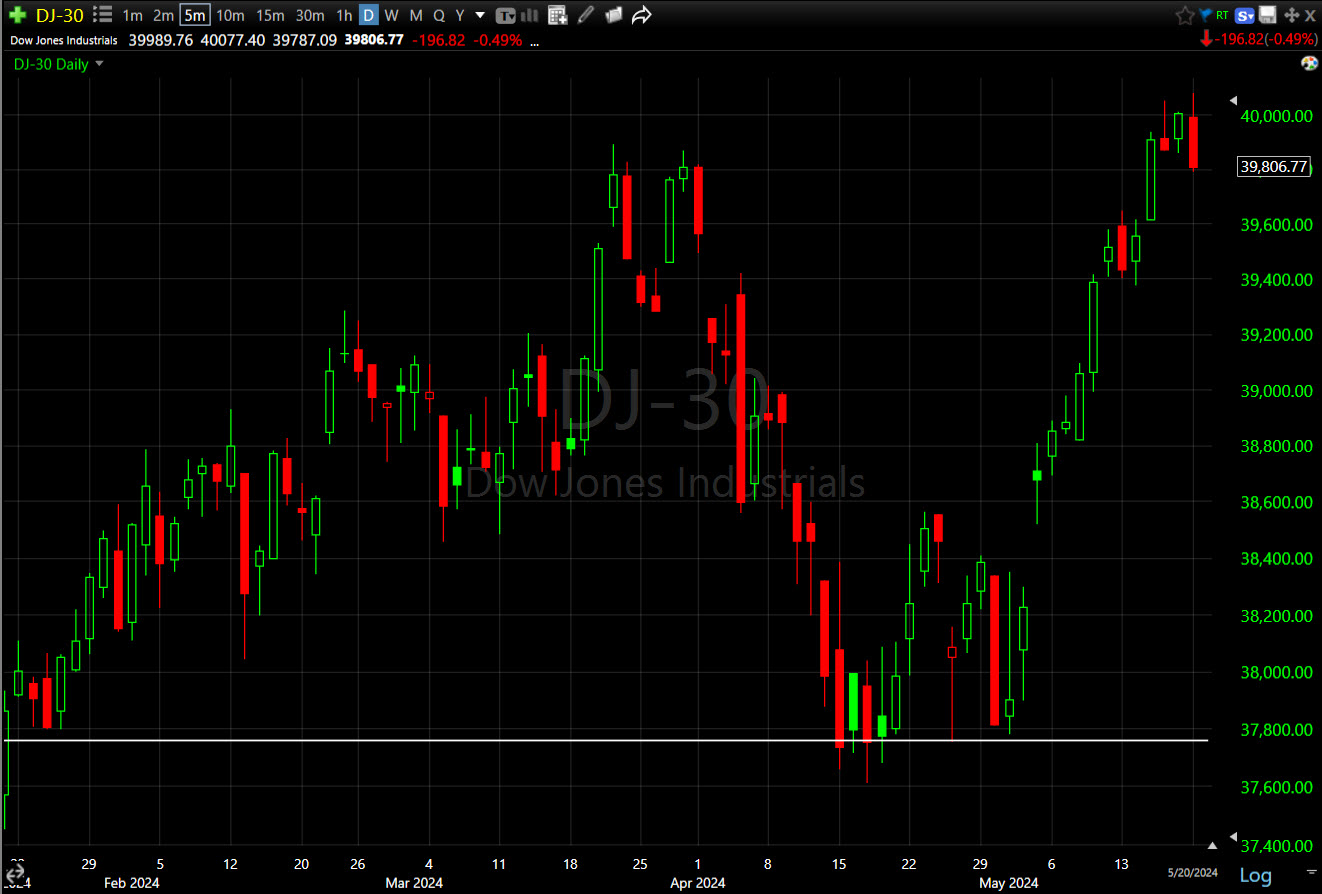 That left an ugly daily candlestick on the price chart of the Dow (daily) in the area of March highs.
Just 7 of the 20 Dow Transport components ended the day green. Transports are already lagging behind and not even close to a new record high, in fact they have not even made a higher high relative to last August, of the recent March highs. As warned earlier today, Transports are at risk of a failed breakout from a small range where the other averages put in inverse H&S and “W” bases off mid-April lows.
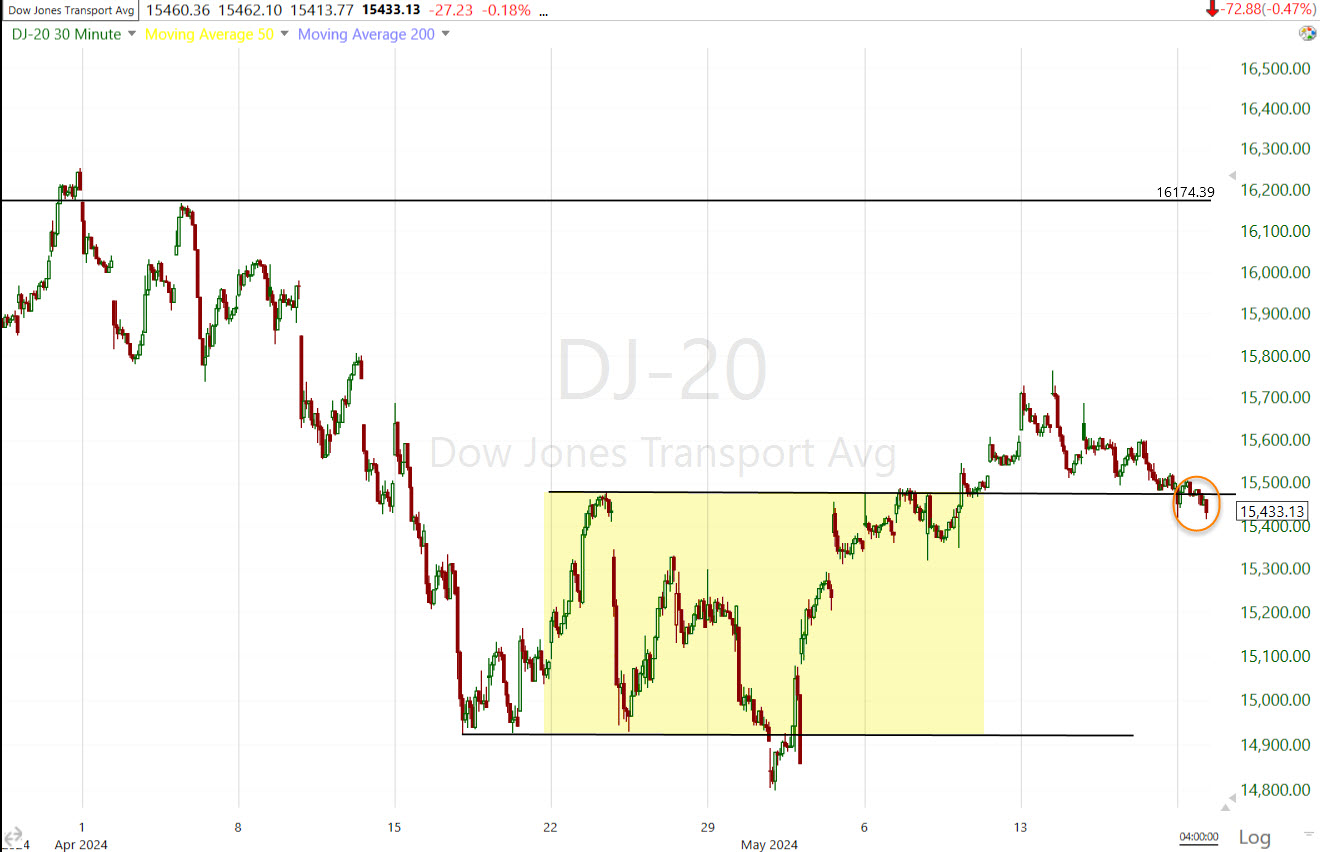 Dow Transports (30m) – I mention Transports because 1) they “should” confirm Dow Industrials, which they have not, and 2) because relative strength/weakness in Transports has a tendency to lead Dow Industrials. I wouldn’t call this a failed breakout yet, but price is flirting with a failed breakout and then, potentially a fast price reversal. In other words, a very similar situation to what the Dow faces about 1.1% lower.
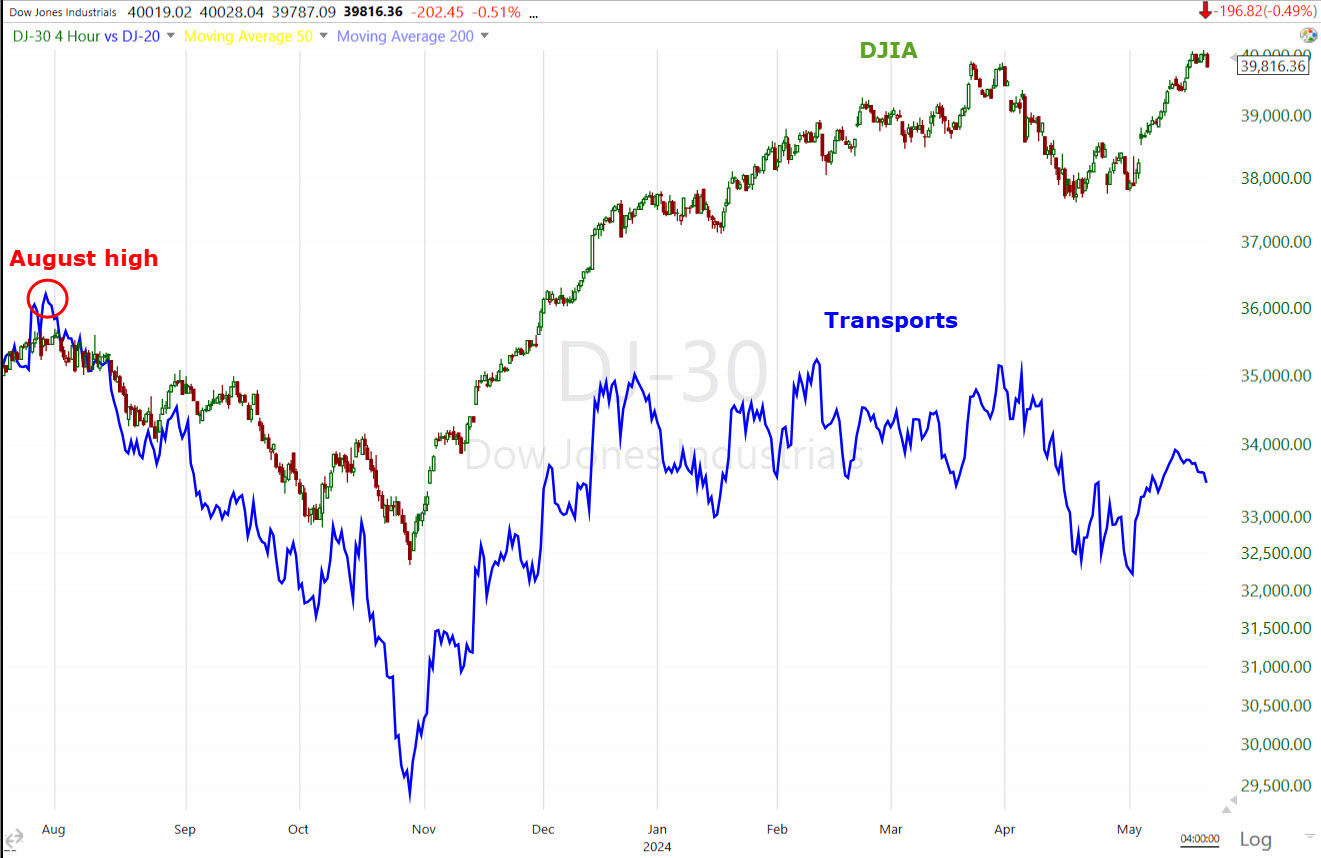 DJIA and Transports (4H normalized) Not only have Transports not confirmed the DJIA’s new record high (or any of them in 2024), they haven’t surpassed the high from last summer’s mid-sized H&S tops, nor the March high.
The S&P had the cleanest inverse H&S base off the April lows, but all of the averages’ estimated measured moves have been met or exceeded, and all open gaps in the majors have been filled. Dow Transports still have a gap +3.5% above, but I don’t feel that gap fill is necessary as it relates to market forecasts and the major averages’ tendency to want to fill gaps.
The meme stock (GameStop and AMC) short squeeze of last Monday-Tuesday produced a huge squeeze in my Most Shorted Index, but as suspected, hedge funds are not as exposed as they were in 2021 and the squeeze sparked by a handful of Roaring Kitty messages/tweets after radio silence since 2021, was short-lived.
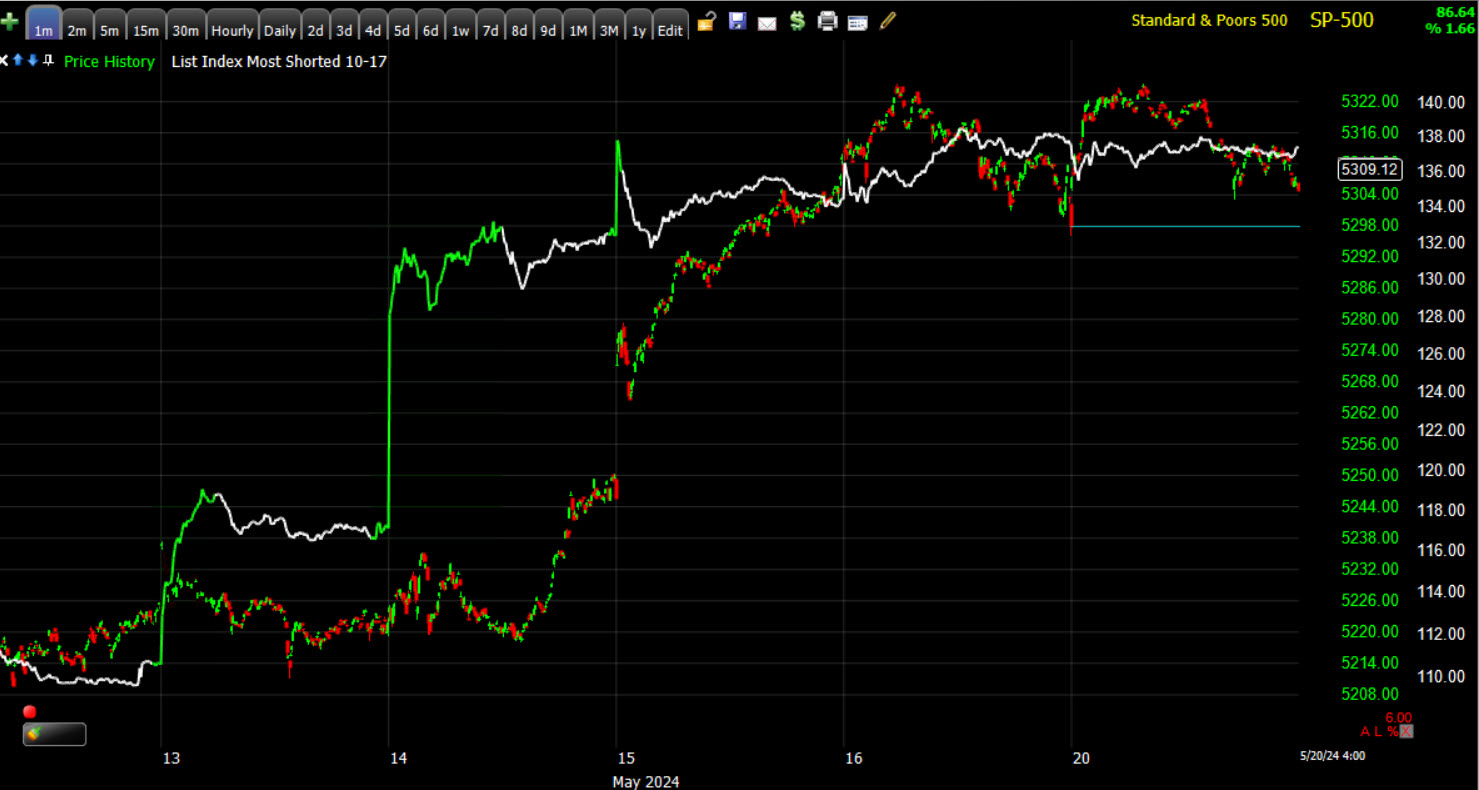 SPX (1m) my Most Shorted Index has done next to nothing since Tuesday’s close.
VIX (+1.3%) and VVIX (+1.3%) both displayed relative strength on the day. VVIX’s relative strength trend is much more developed than VIX as VIX has been steadily and intentionally sold for a couple of weeks.
Here’s an example of VVIX relative weakness as the market averages come into their April lows (VVIX is forecasting a market rebound off those lows). The S&P’s price is inverted for easier context….
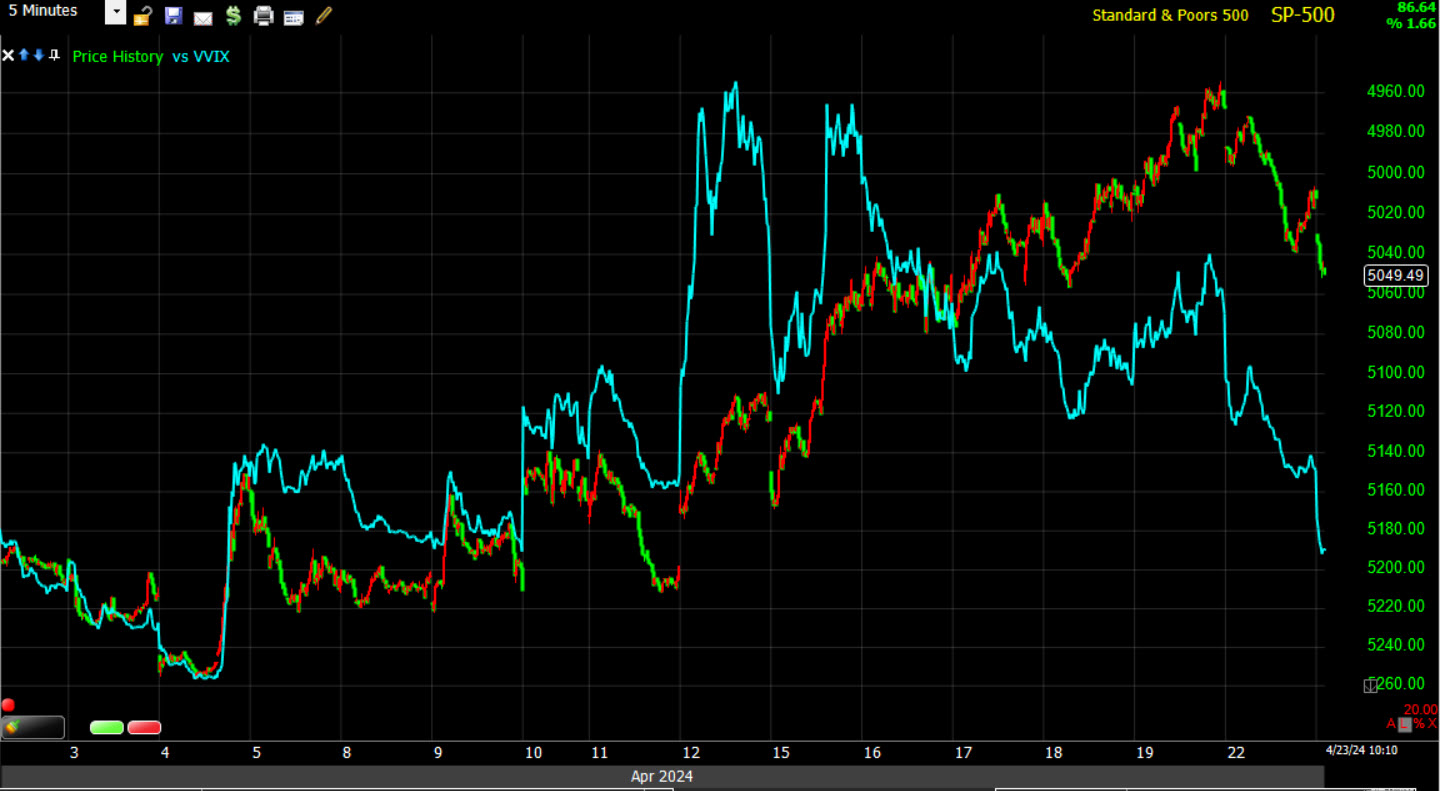 SPX (5m) coming into the April lows, while VVIX starts displaying relative weakness about a week ahead of time.
And now with the opposite situation, VVIX relative strength as the averages sit at or near record highs…
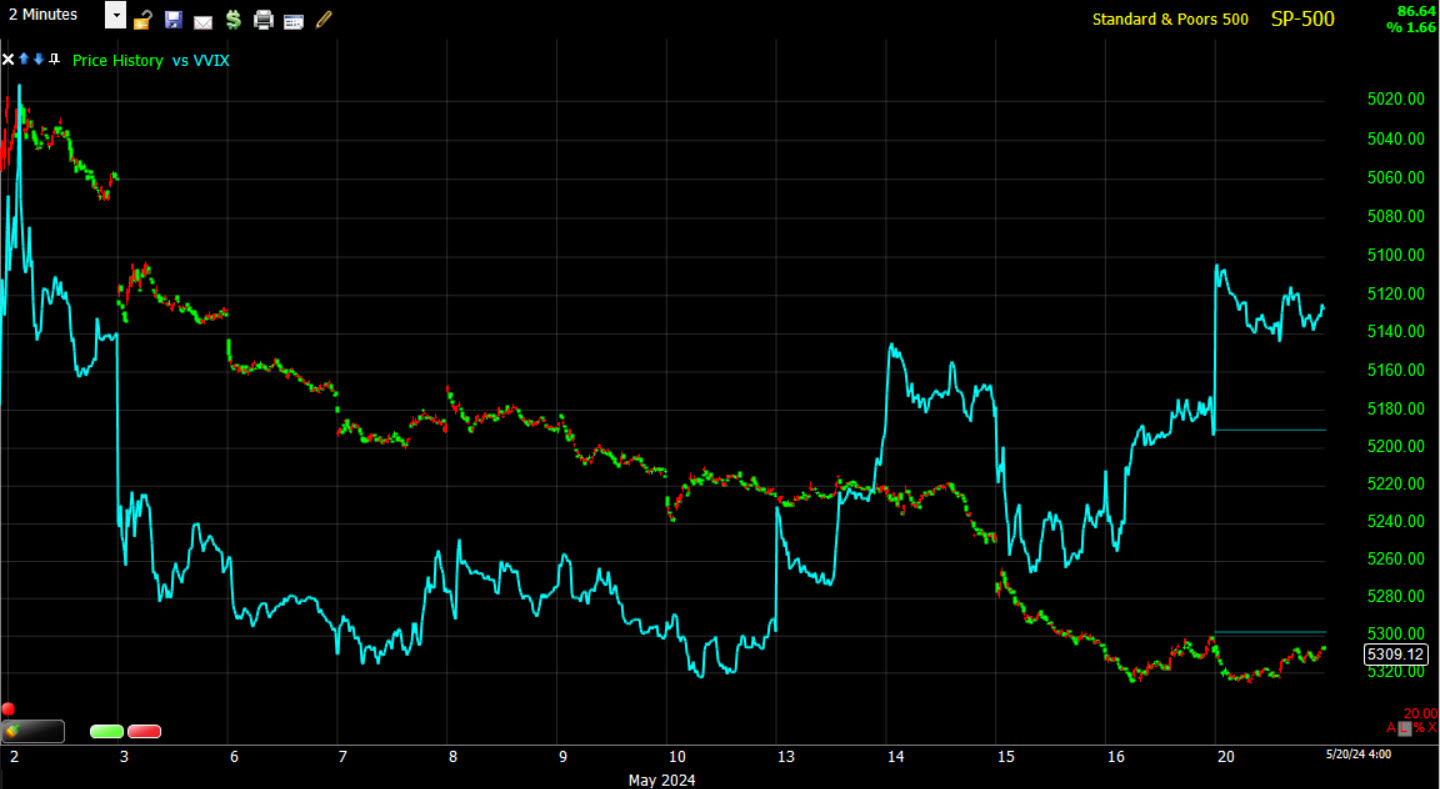 SPX (2m) at record highs and VVIX relative strength forecasting a high probability downside pivot for market prices.
VVIX ‘s relative strength trend is getting to the point in which I’d expect that we’re nearing the transition zone, but VIX typically follows suit in terms of relative performance first, and then the averages transition trend. I can’t account for the steady, intentional selling of VIX over the last couple of weeks when it comes to VVIX’s relative performance trend forecasting market averages’ price reversals. It’s an unusual situation. We’ll have to see how this plays out and/or if VVIX’s signal gets even stronger as it did today.
The Absolute Breadth Index came down to 30.
S&P sectors
S&P sectors were mixed throughout the session, ending with just 4 of 11 sectors in the green. The S&P 500 Technology sector led by a wide margin right from the cash open, benefitting from price action in its mega cap and semiconductor components.
No sector was down more than a half percent this morning. Losses in red sectors widened as the day went on. The heavily-weighted Financial sector logged the largest loss. This was due in large part to a sizable loss in JPMorgan Chase (JPM -4.5%) after turning lower in response to CEO Dimon’s comments.
The Consumer Discretionary sector was the next worst performer due to losses in Amazon.com (AMZN -0.6%) and Tesla (TSLA -1.4%). Declines in retailers (Retail sector -0.4%) followed last week’s weak Retail Sales report, and contributed to the underperformance of the Consumer Discretionary sector in front of earnings reports from some influential names in the space this week.
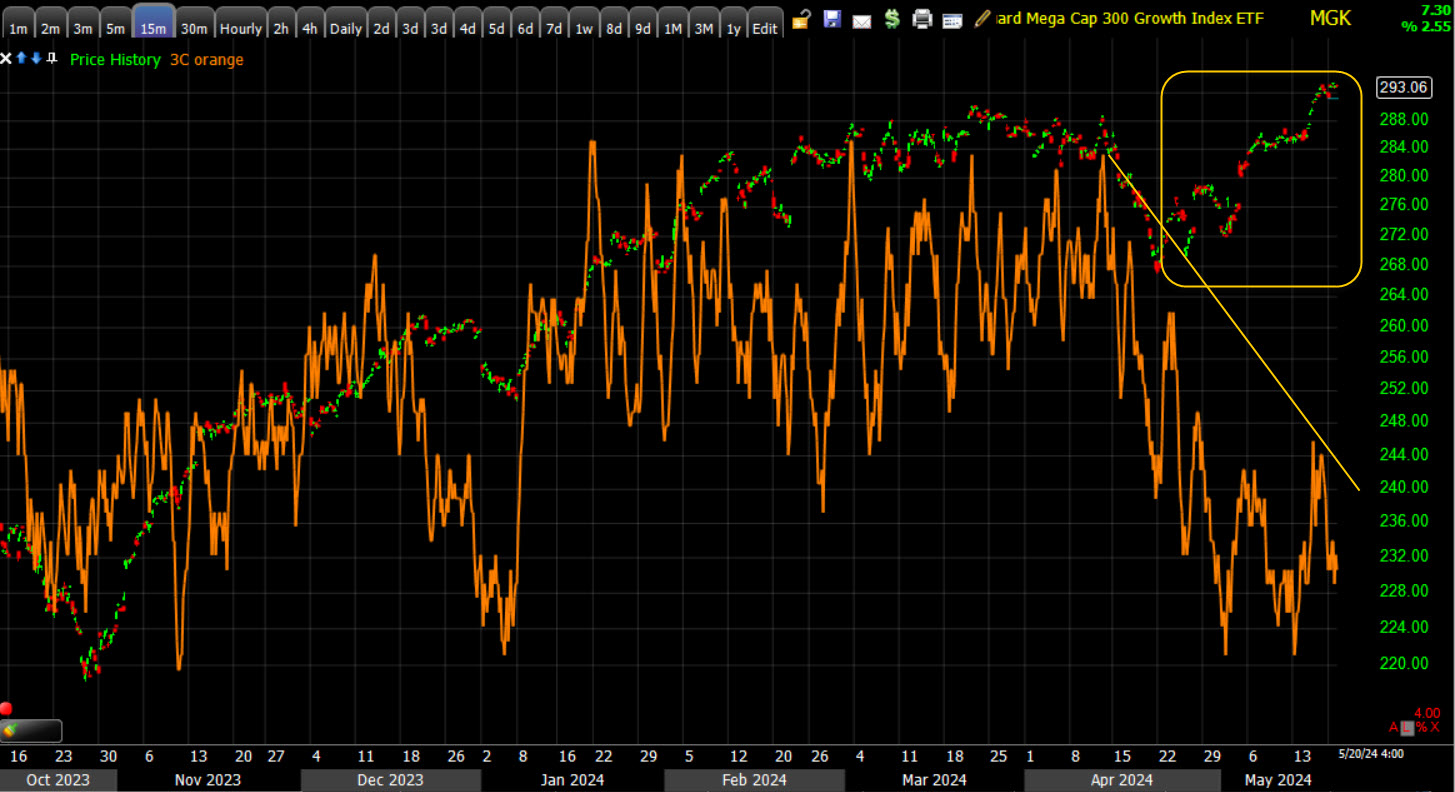
Mega-caps (MGK +0.65%) had a 75 basis point edge over the Equal Weight S&P. This still isn’t the 100-200 bp edges we have typically seen before and as mega-caps are coming into a leadership role. There are similar signs of distribution in mega-caps as there are in semis (3C charts below).
All 27 SOX Index components closed green with gains ranging from +0.25% (QRVO) to +5.75% (Teradyne). Micron (MU +2.95%) reached a new 52-week high after shares were upgraded to Equal-Weight from Underweight at Morgan Stanley, and Teradyne (TER +5.75%) was was upgraded to Buy from Neutral at Goldman.
Materials ⇧ 0.14 %
Energy ⇩ -0.65 %
Financials ⇩ -1.37 %
Industrial ⇧ 0.19 %
Technology ⇧ 1.18 %
Consumer Staples ⇩ -0.69 %
Utilities ⇩ -0.17 %
Health Care ⇩ -0.21 %
Consumer Discretionary ⇩ -0.74 %
Real Estate ⇩ -0.62 %
Communications ⇧ 0.29 %
Norwegian Cruise Line (NCLH +7.55%) was the top performing S&P 500 component after reporting earnings. Other cruise line stocks were trading higher in sympathy. Carnival (CCL +7.25%) and Royal Caribbean (RCL +4.1%) are also among top performing S&P 500 components.
I didn’t see any new selling into price strength (3C negative divergences) in semis today, but I also didn’t see any attempt to confirm today’s gain either.
 SMH/Semis (1m)
The mega-cap index shows a similar trend of selling into price strength for the rally off April’s low, and around the same time as semis.
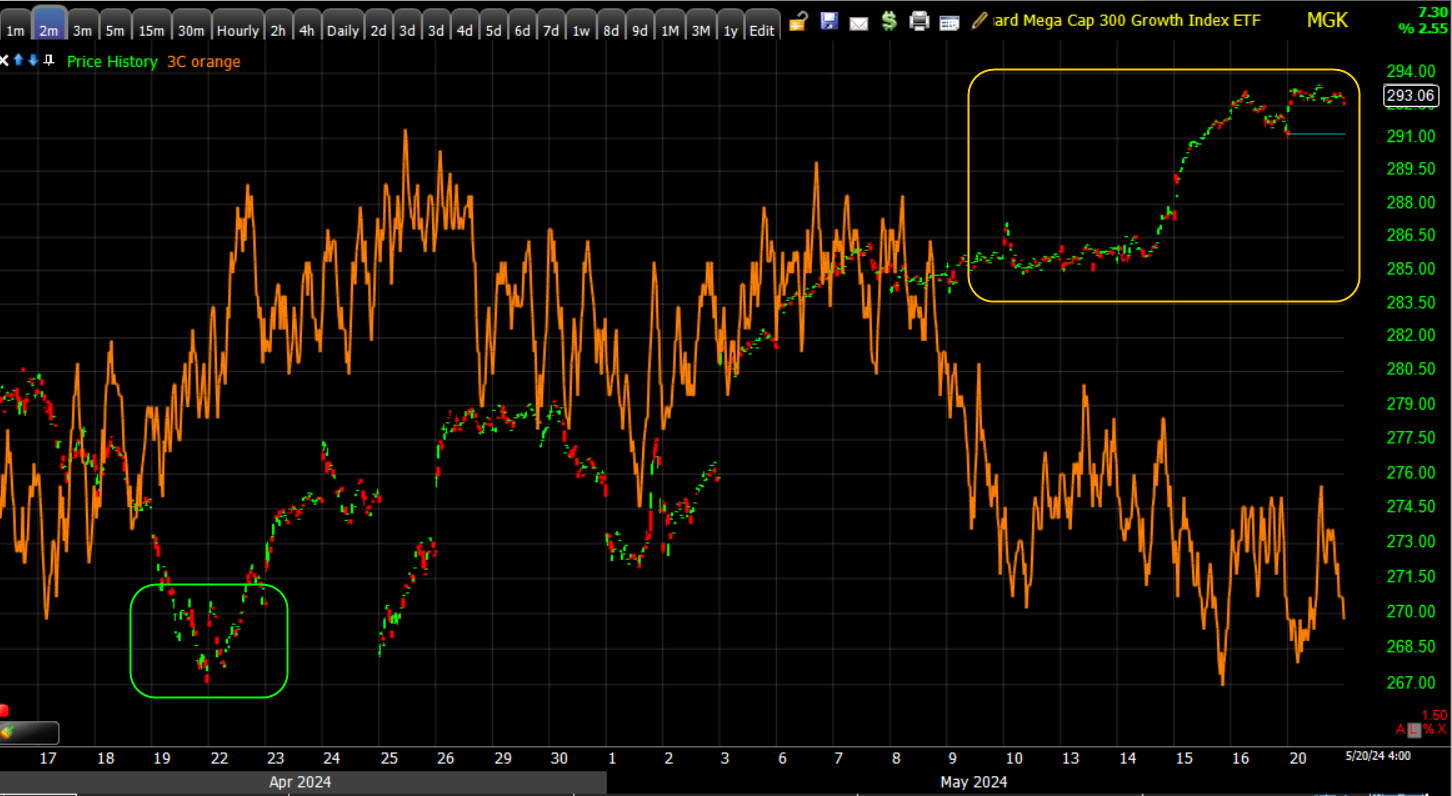 MGK/Mega-Caps (2m) with a positive divgernece at the April low (green) and early confirmation, until we got into last week’s gains, then 3C is clearly negatively divergent. Smart money’s positions are so large and their execution so much more sophisticated, when they sell, it’s usually into price strength. Notice the first half or more of the rally off April lows we don’t see any signifgant 3C divergences, only around the time the S&P met its measured move and surpassed it. This is the classic distribution that 3C uncovers as the indicator has the ability to contradict price.
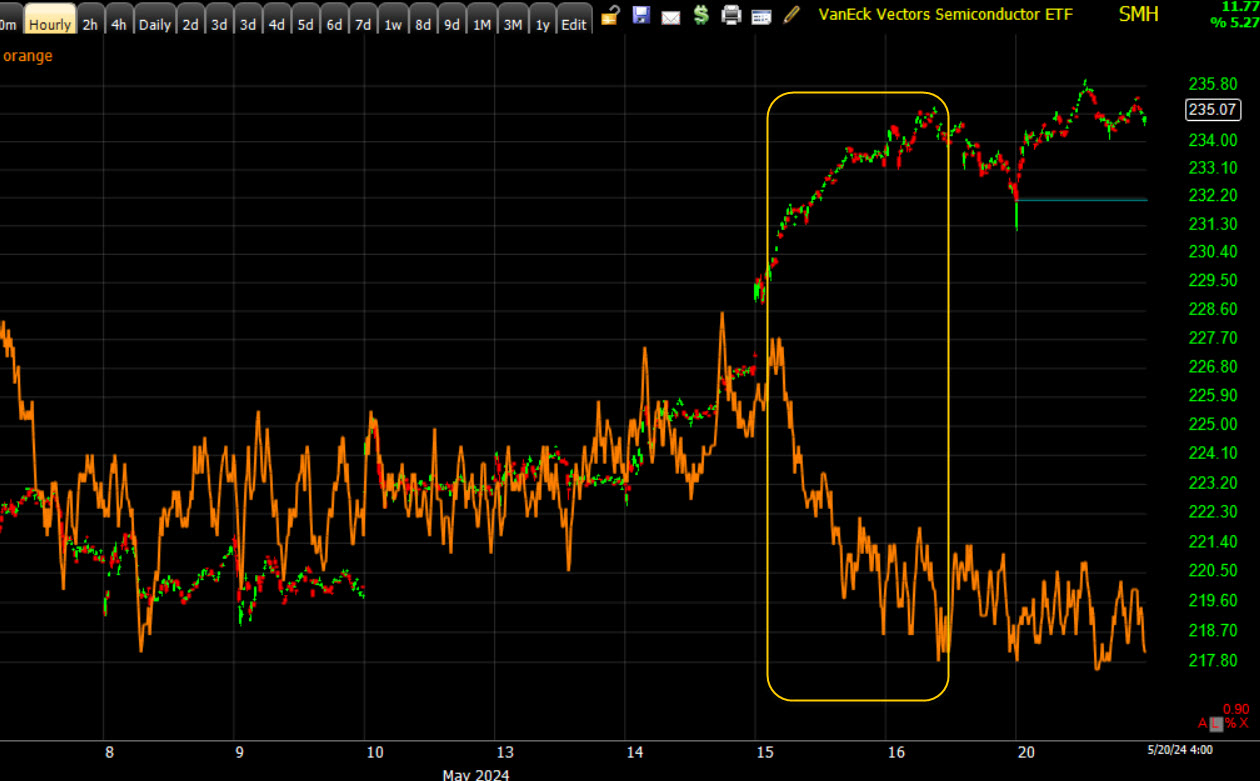
And as posted earlier today for semis, the longer term, stronger (but less sensitive and less detailed) 3C charts show the same trend of selling into price strength…
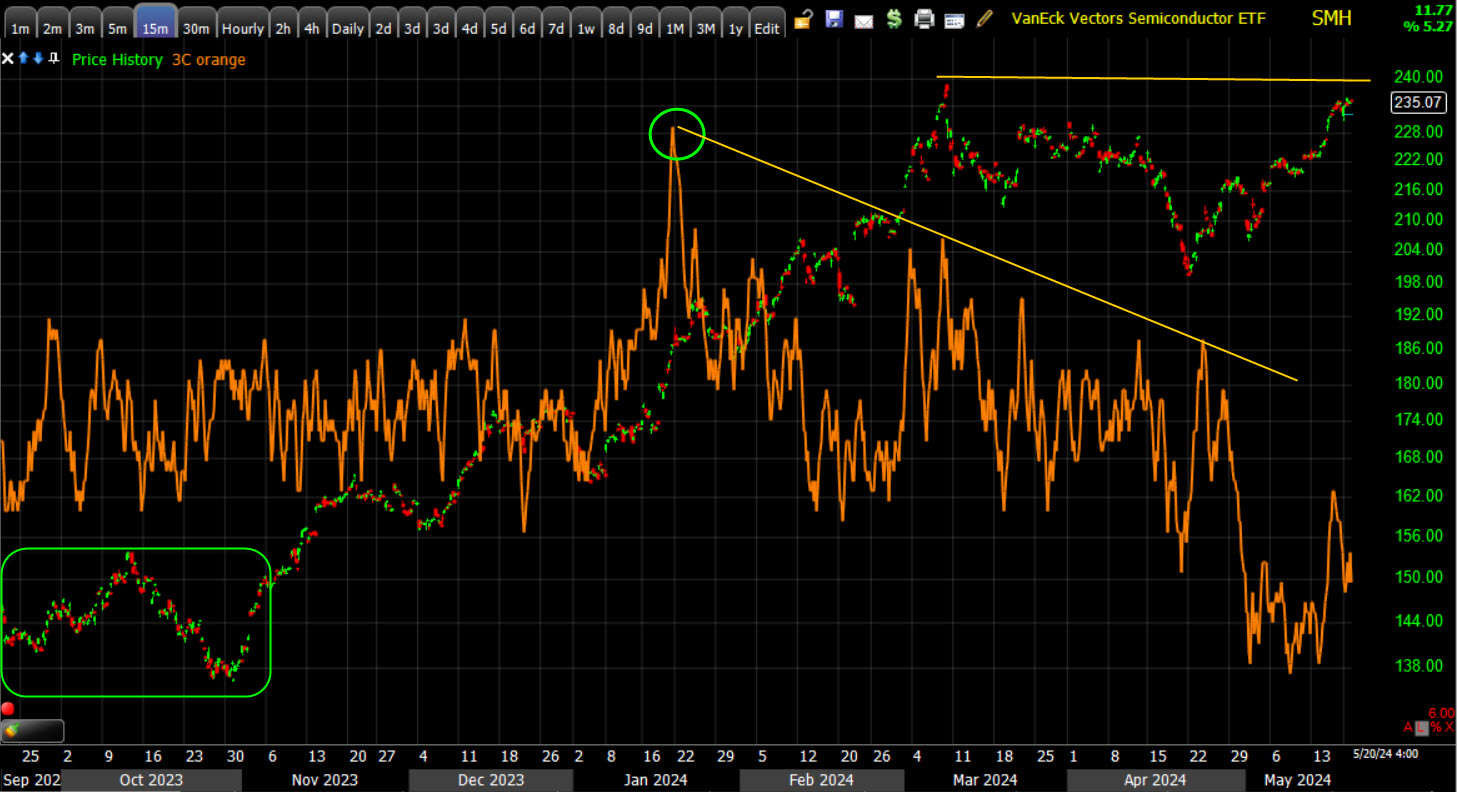 Semis/SMH (15m) positively divergent (buying into price weakness) at the April lows and early conformation of gains, then negatively diverging into the most recent gains. Also notice that as the major averages made new record highs, the group that led them most of 2024 has not yet. I’ll keep watching NVDA’s 3C chart into earnings, but I doubt a stock that big would risk leaking earnings, but you never know. I’ve seen it before.
Mega-caps show the same trend as semis…
 (15m) – 3C negatively divergent very specifically, and more sharply, on the rally off mid-April lows.
Internals
Market breadth was positive earlier, but decliners ended with an 11-to-10 lead over advancers at the NYSE. Advancers (2151) ended with a slim lead over decliners (2083) at the NASDAQ Composite. Volume at the NYSE was unusually light at just 813 mln. shares.
The Dow and S&P-500 came in with a Dominant price/volume relationship of Close Down/Volume Down (typical of consolidation days and the primary theme of bear markets), and the NASDAQ-100 came in at Close Up/Volume Down (the most suspect of the 4 relationships on a close higher). There are no 1-day overbought/oversold internal signals.
Treasuries
Yields settled slightly higher, acting as a limiting factor for equities. The 2-yr yield rose two basis points to 4.84% and the 10-yr yield settled two basis points higher at 4.44%.
Yields are bouncing off their downward sloping channels from mid-April highs (the pull back in yields helped support the equity averages’ gains over the period).
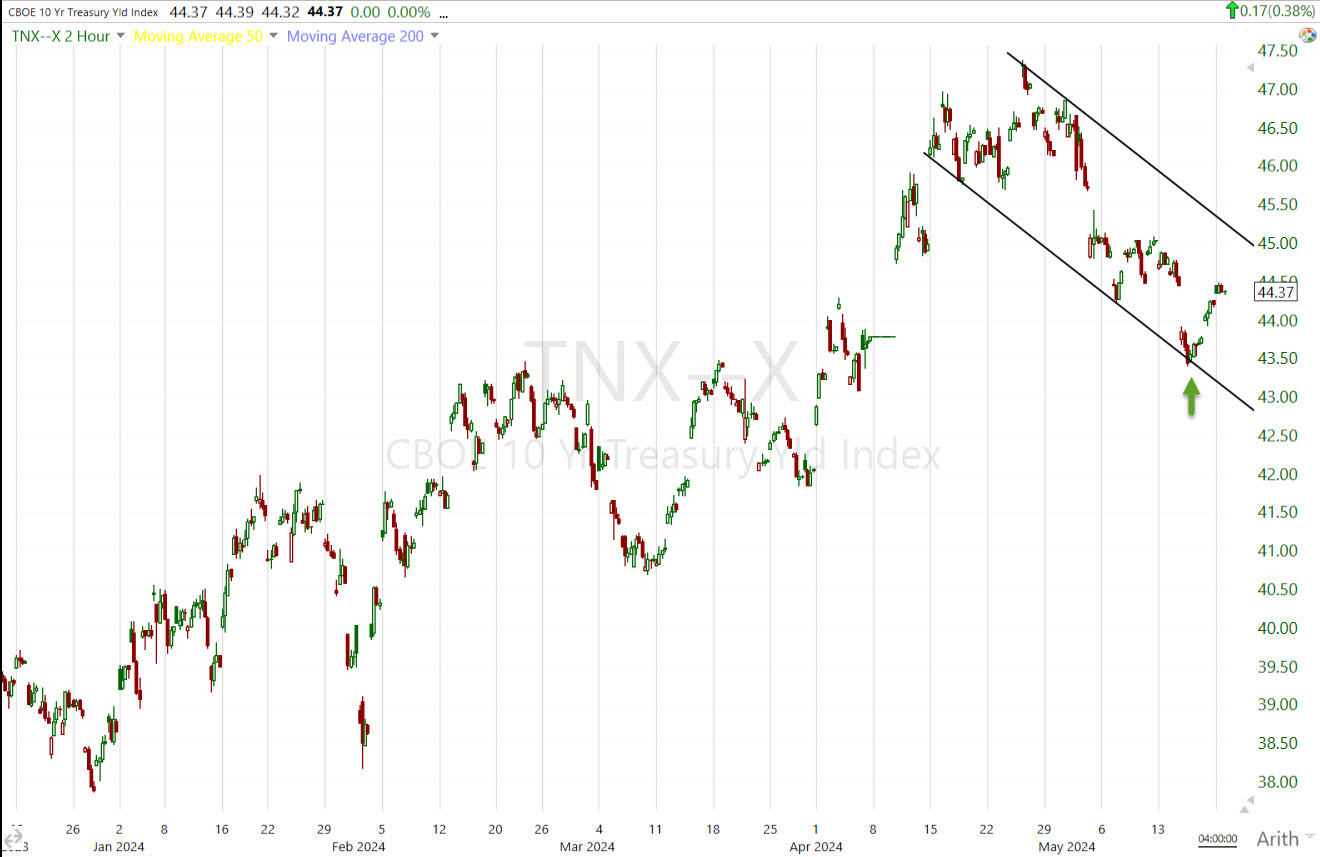
10-yr yield (2H) – If/When yields break out of the channel on the upside, we should see some more intense selling pressure in Tech stocks. If Crude oil starts trading above $81, I expect we’ll see yields rise at a faster clip. And if we keep seeing commodities broadly trending higher as they are now, that will also put upward (inflationary) pressure on yields and downward pressure on stocks. The YTD up trend of higher highs and higher lows in yields is still intact – a reflection of resurgent inflation, the same as the U.S. dollar over the same period.
As I’ve demonstrated several times this year, Crude oil — the largest and most important commodity when it comes to inflation — tends to lead yields by 1 to 3 weeks.
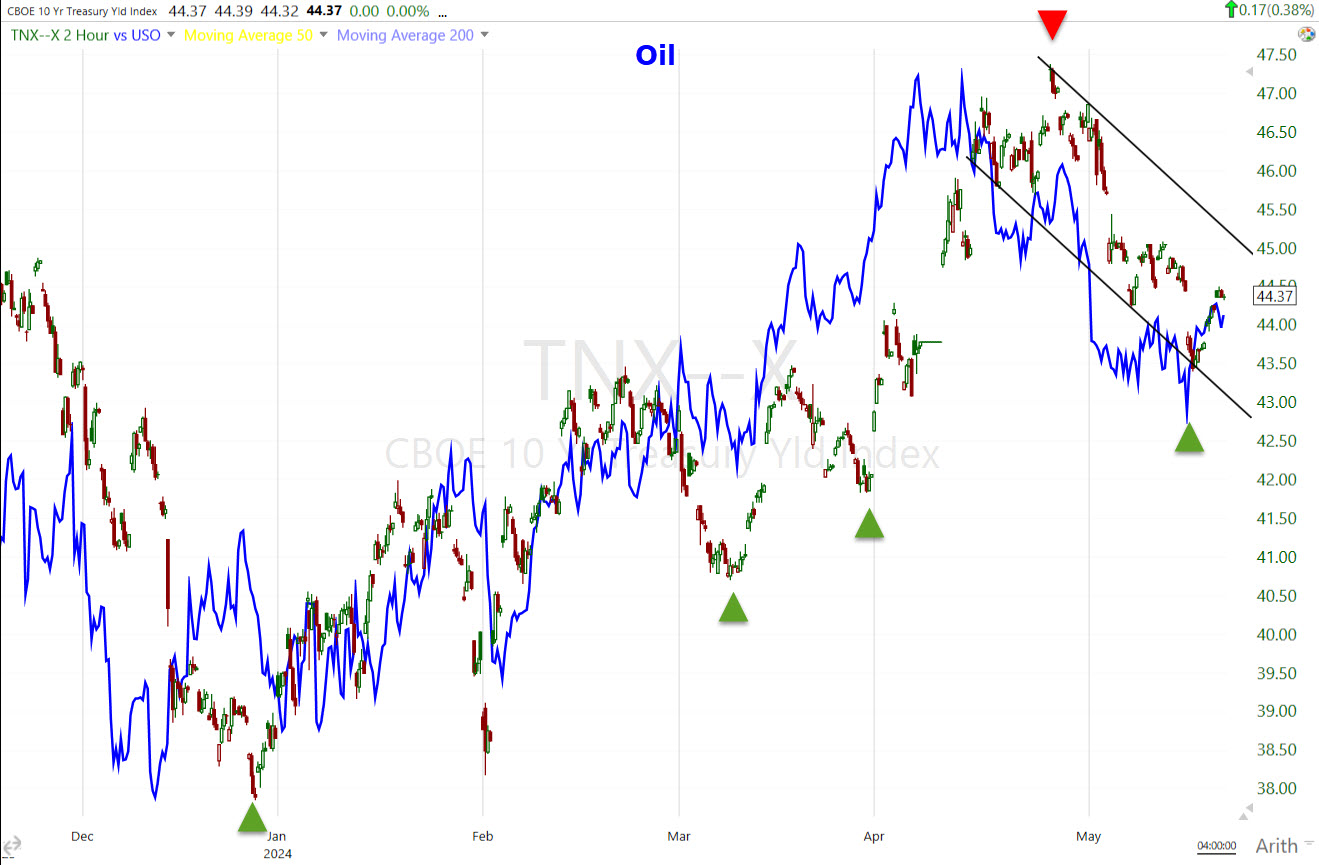 Oil (blue 2H) leading the 10-year yield higher (green) and lower (red). This is why what happens next in Crude oil has a massive impact on everything else from inflation’s trajectory, Fed policy, the economy and stock market.
However, we can also see broad baskets of commodities (using numerous commodity indices) rallying and leading yields higher as well…
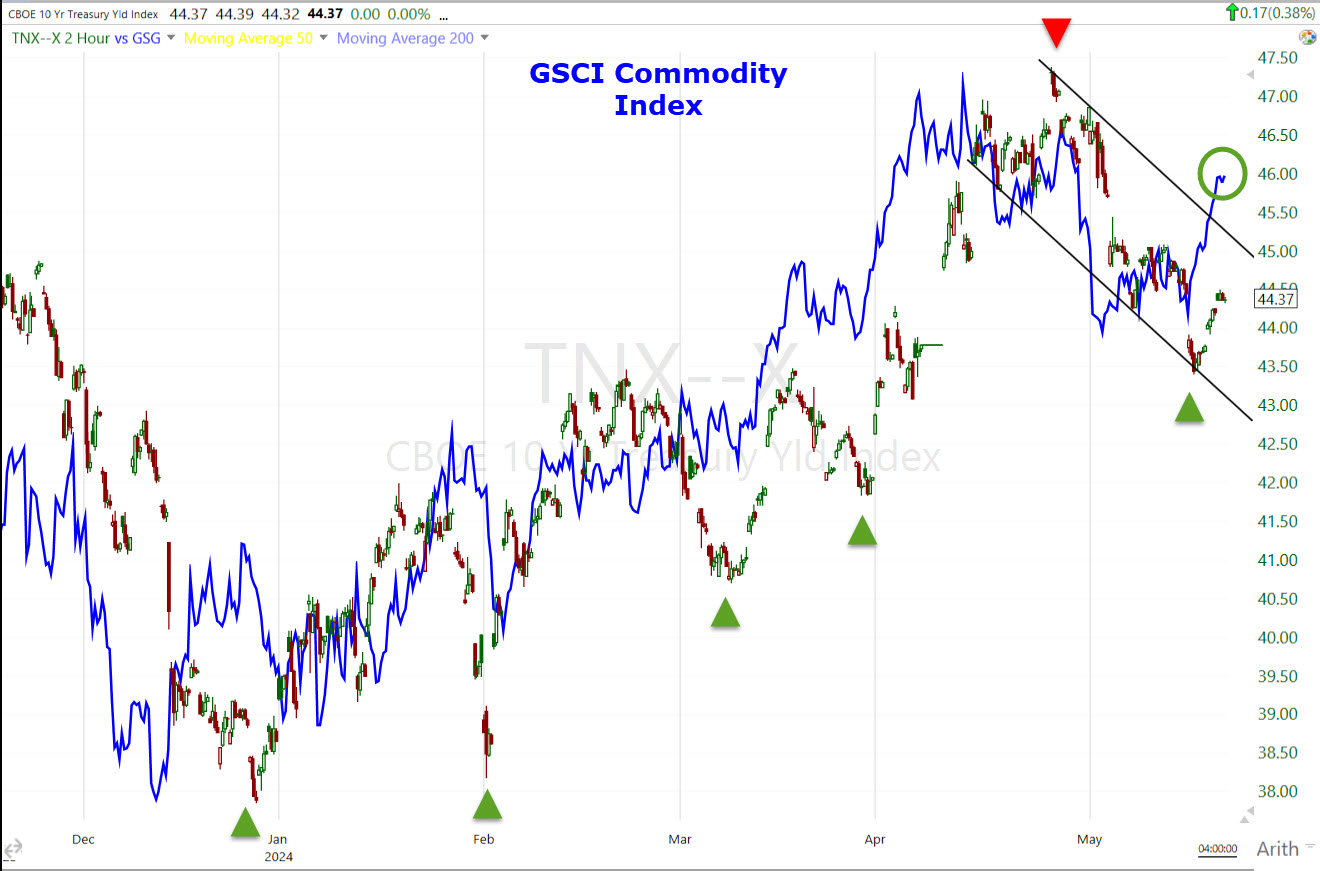 (2H) More on commodities below.
Currencies and Commodities
The U.S. Dollar Index was up about +0.15% to $104.62 and continues to hold its inflation rebound-reflecting year-to-date up trend (very similar to yields over the same period YTD).
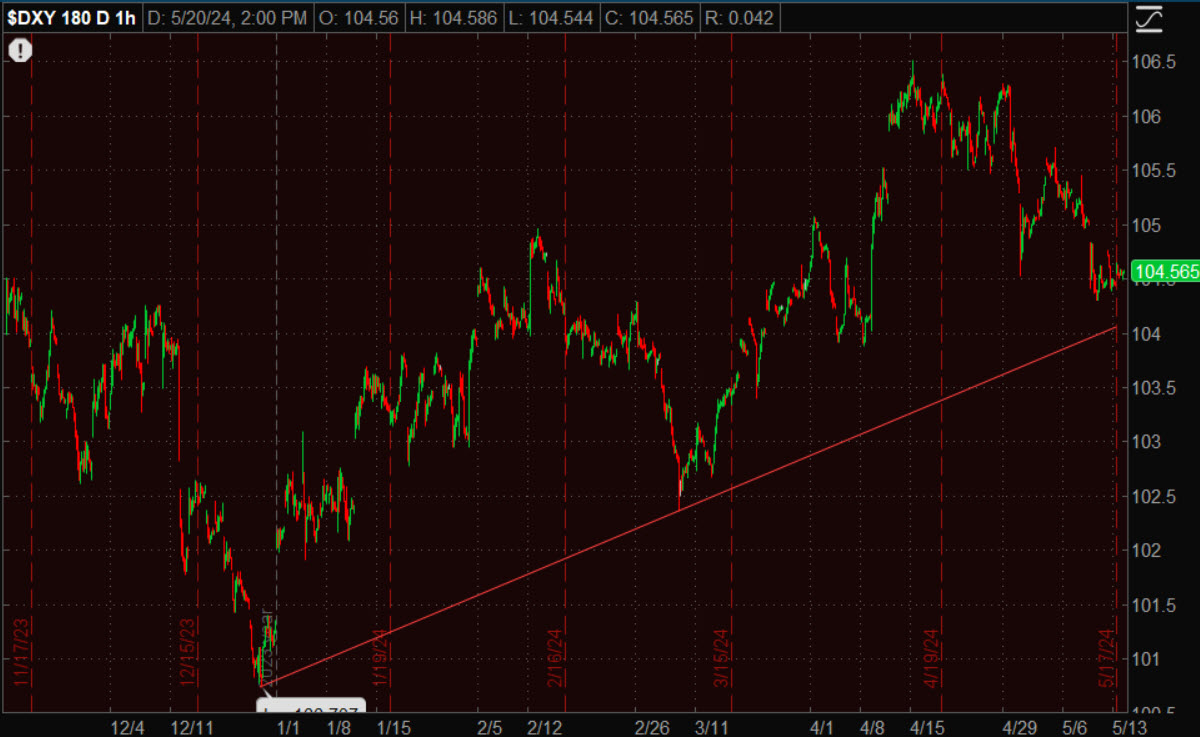 U.S. Dollar Index (60m) – The pull back from the year’s high was mid-April and helped open the door for the equity market rally off the market’s mid-April lows following one of the ugliest weeks of the entire rally from last October as CTA’s dumped Tech stocks.
WTI Crude oil was choppy, closing down -0.45%, but holding above the YTD up trend that price has broken below several times before regaining the trend line.
While there were no signs of concern over geopolitical tensions in Crude oil after Iranian president, Raisi, was killed in a helicopter crash over the weekend, it’s not an ideal situation while tensions between Israel and Iran remain in a heightened state and Iranian leadership is uncertain. Raisi was a leading candidate to become the eventual successor for Supreme Leader Khameini.
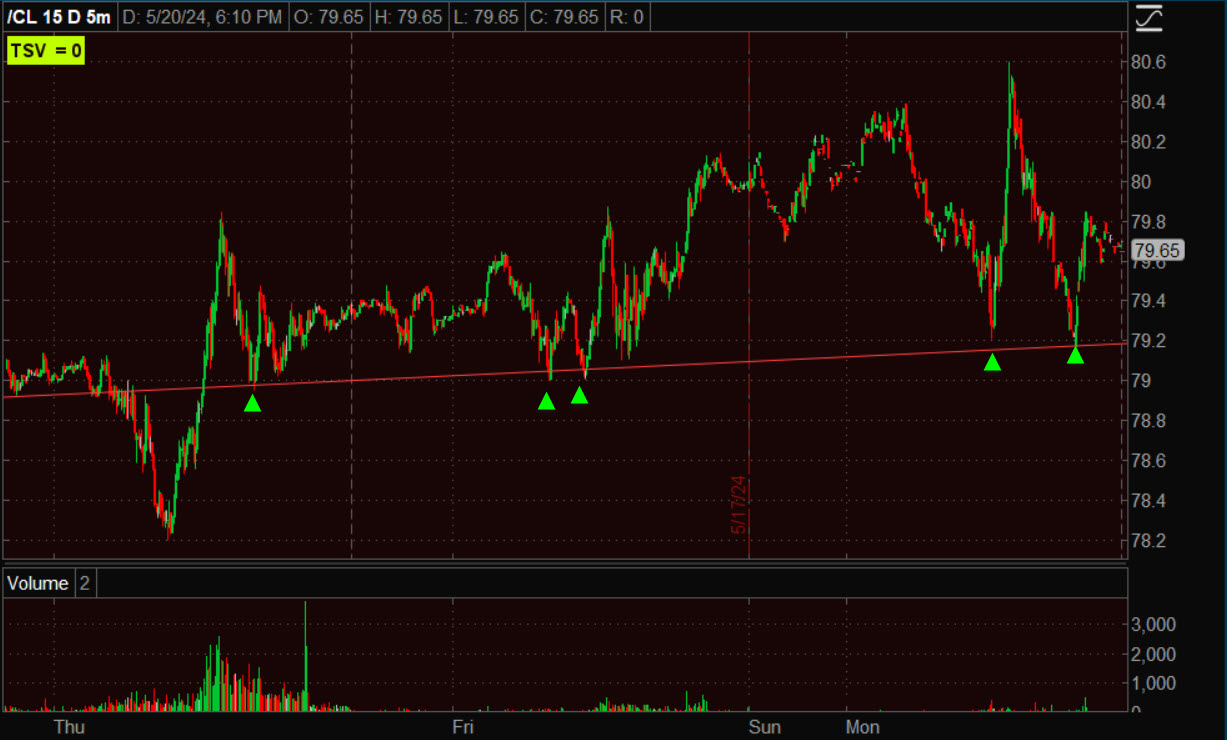 WTI Crude Oil futures (5m) – the trend line has been successfully tested several times in recent days, including today.
The question in my mind — and I think the answer is exceptionally important to the inflation outlook, the economic outlook, and thus the stock market outlook — is whether prices bounces off this trend line to make the next higher high in the year’s trend of higher highs and higher lows?
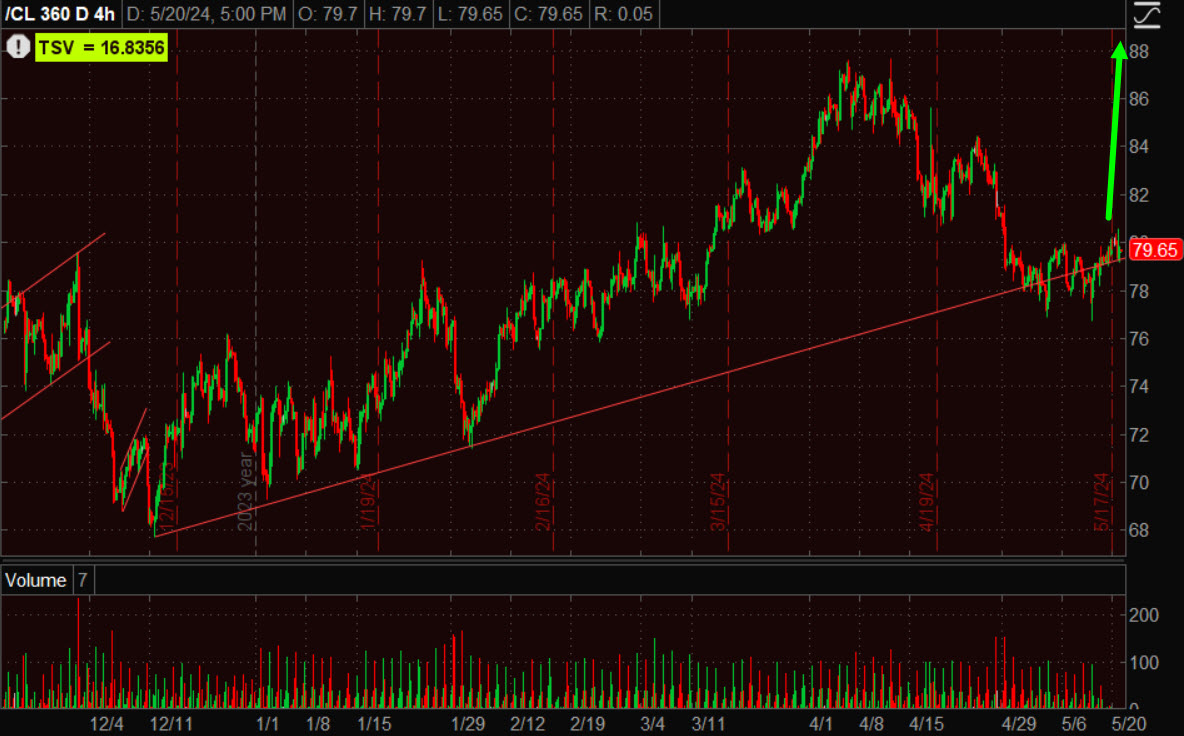 WTI Crude Oil (4H) – First WTI needs to hold the $79 level, then trade above $81 (former sticky zone of resistance). If Crude makes a higher high or even just tests the last pivot high, yields will soar, especially with all of the other commodities that have since soared, like copper and now silver. The leadership stocks (long duration Tech) do not like higher yields.
Natural Gas posted further gains and UNG (+3.75%) saw more upside follow through, creating more inflationary pressure in energy.
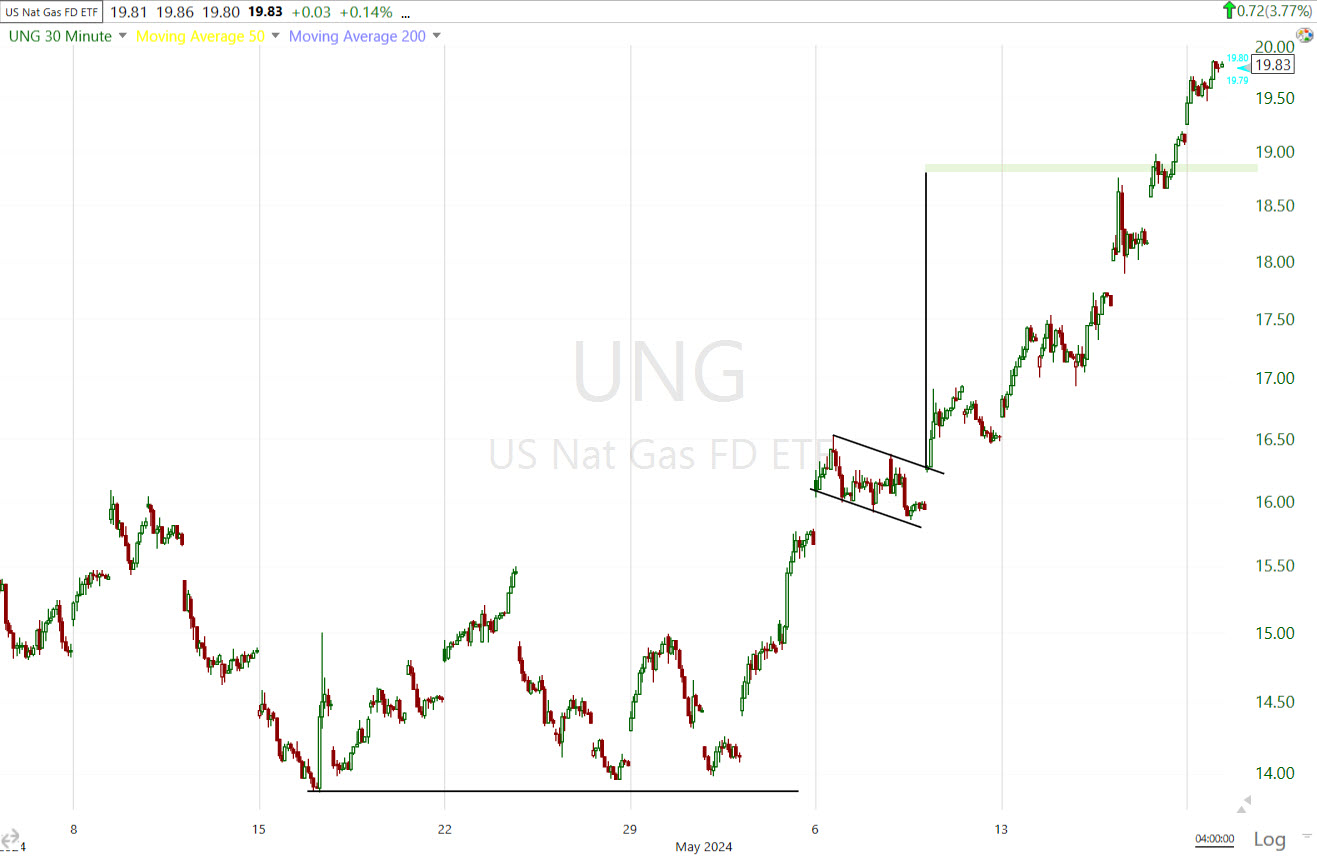
UNG (30m) already surpassed the measured move from the bull flag’s second leg up. As mentioned earlier today, it looks like UNG is headed for a test of its 200-day SMA ($21.77) about 11% higher from here.
URA followed through to the upside, adding another +1.75% after breaking out above $32.50 Friday.
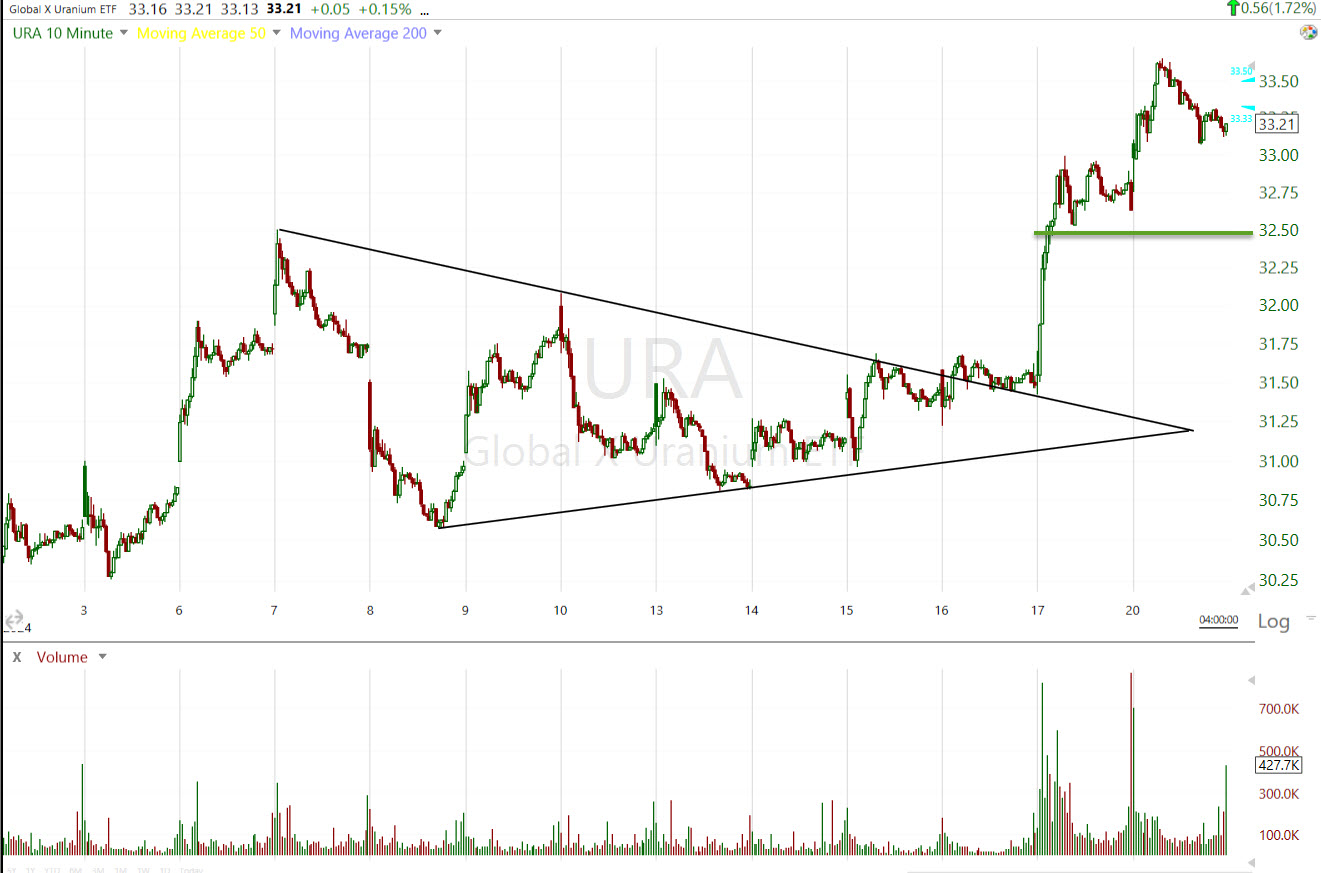 URA (10m) – Volume was lighter than Friday, but about double the 200-day average volume which is constructive.
Gold hit a new record high ($2450 Spot). Gold futures settled +0.9% higher to $2,438.50/oz. While price action still looks solidly bullish, confirming volume is still lacking.
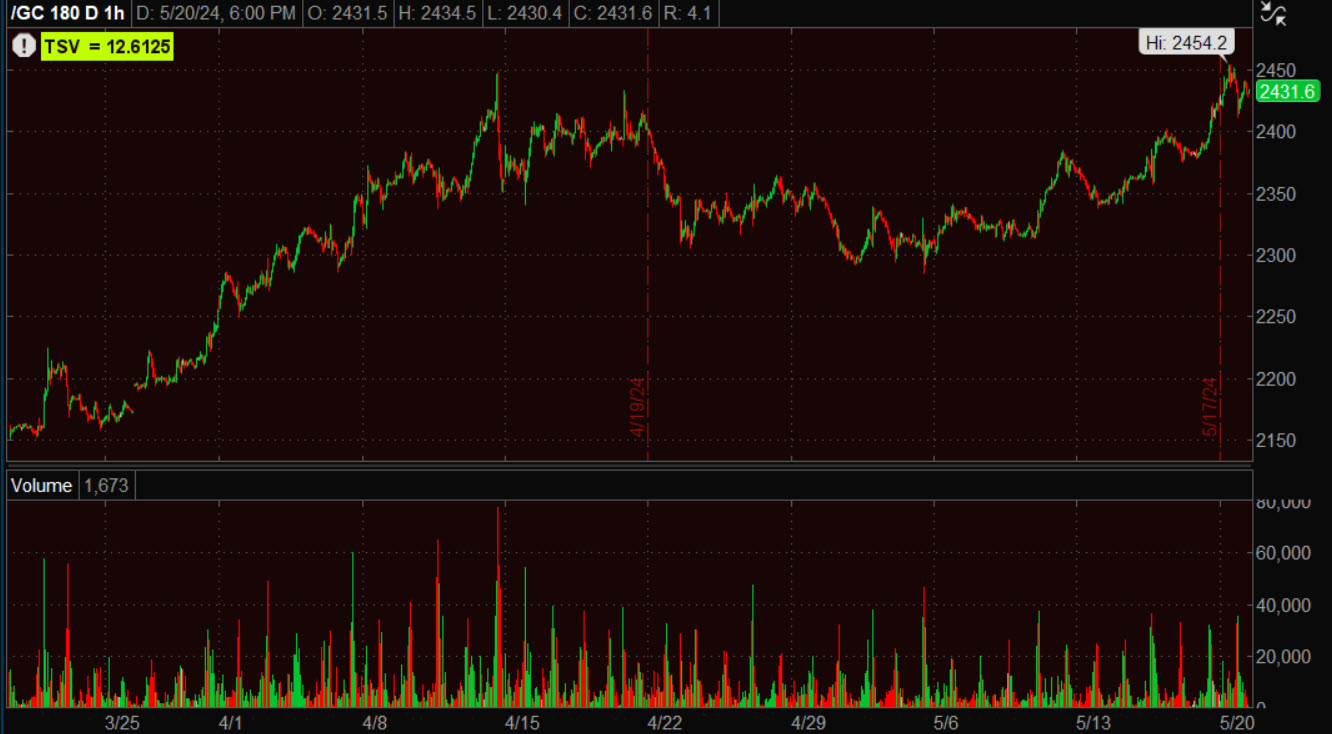 Gold futures (60m)
Gold miner, Newmont (NEM), added +1.6% today and is flirting with a breakout from the bullish ascending triangle consolidation.
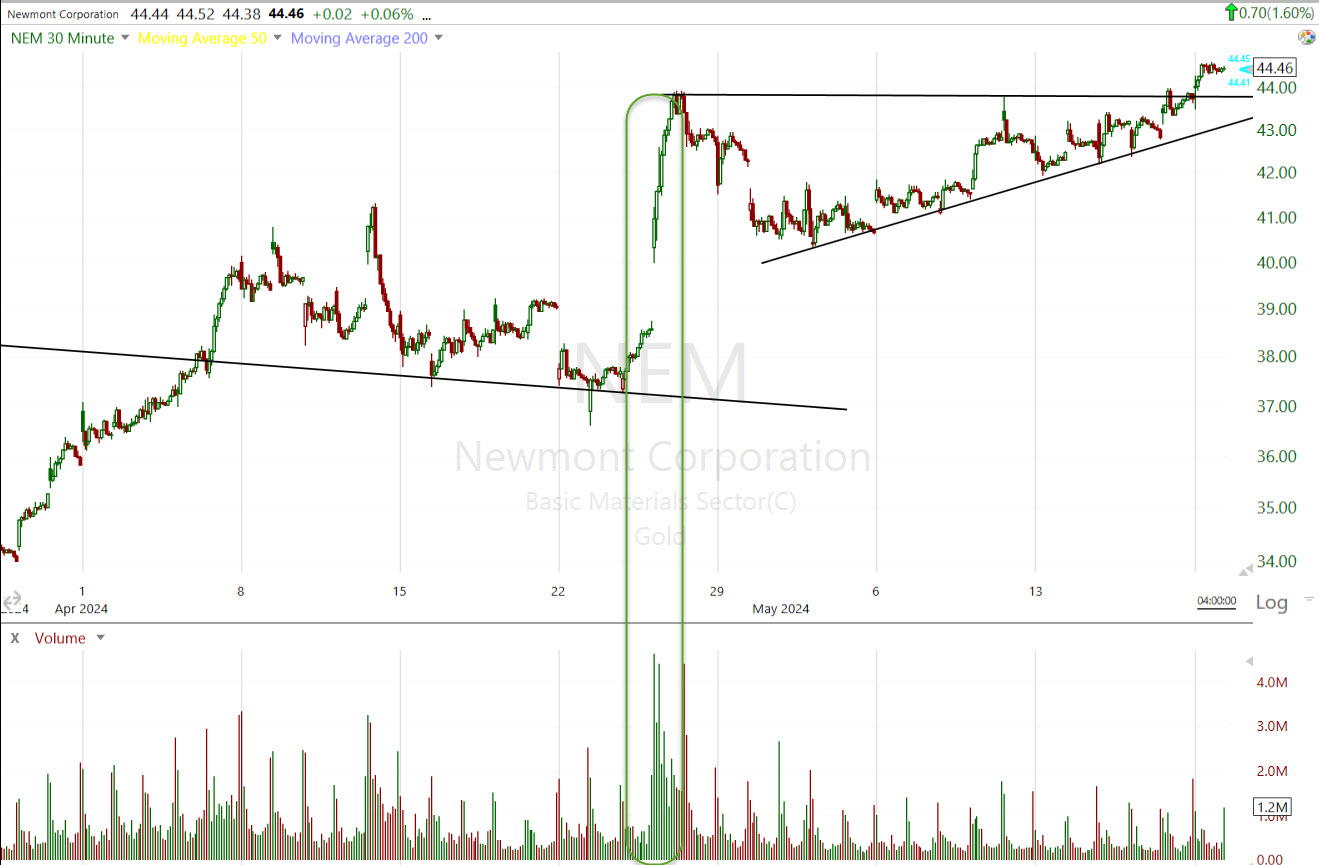 NEM (30m) – I would not call this a breakout yet. We’re not seeing the kind of confirming volume, such as the last breakout that led into this consolidation, yet.
The group (Gold miners) is acting well with very bullish price action.
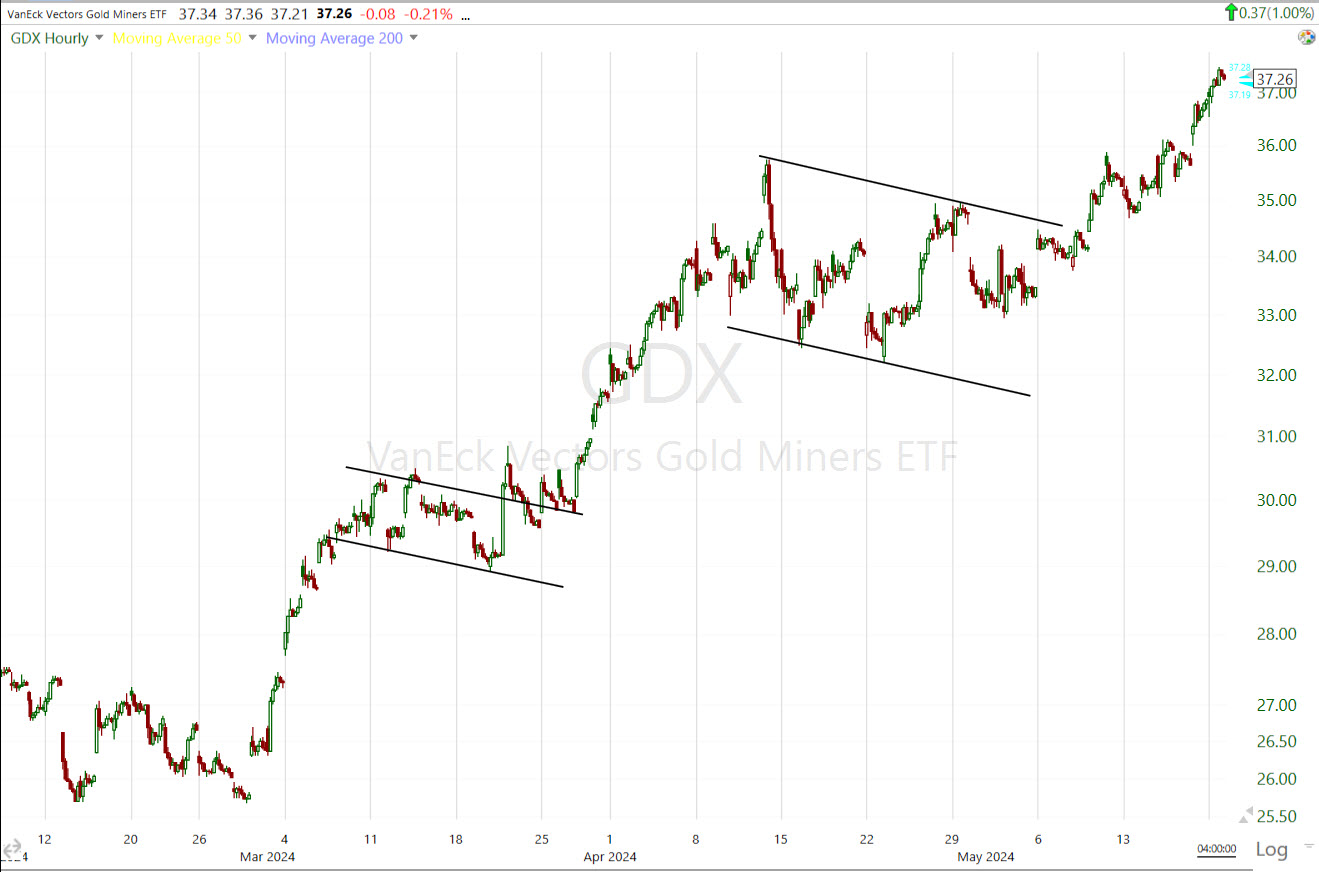
GDX – Gold miner ETF (60m) with two bull flags and solid upside follow-through. Volume could be better, but it’s not horrible.
Silver is acting well in price and volume since breaking out above the key $30 level Friday. Today saw bullish follow through with price back above $32.00 for the first time since 2013.
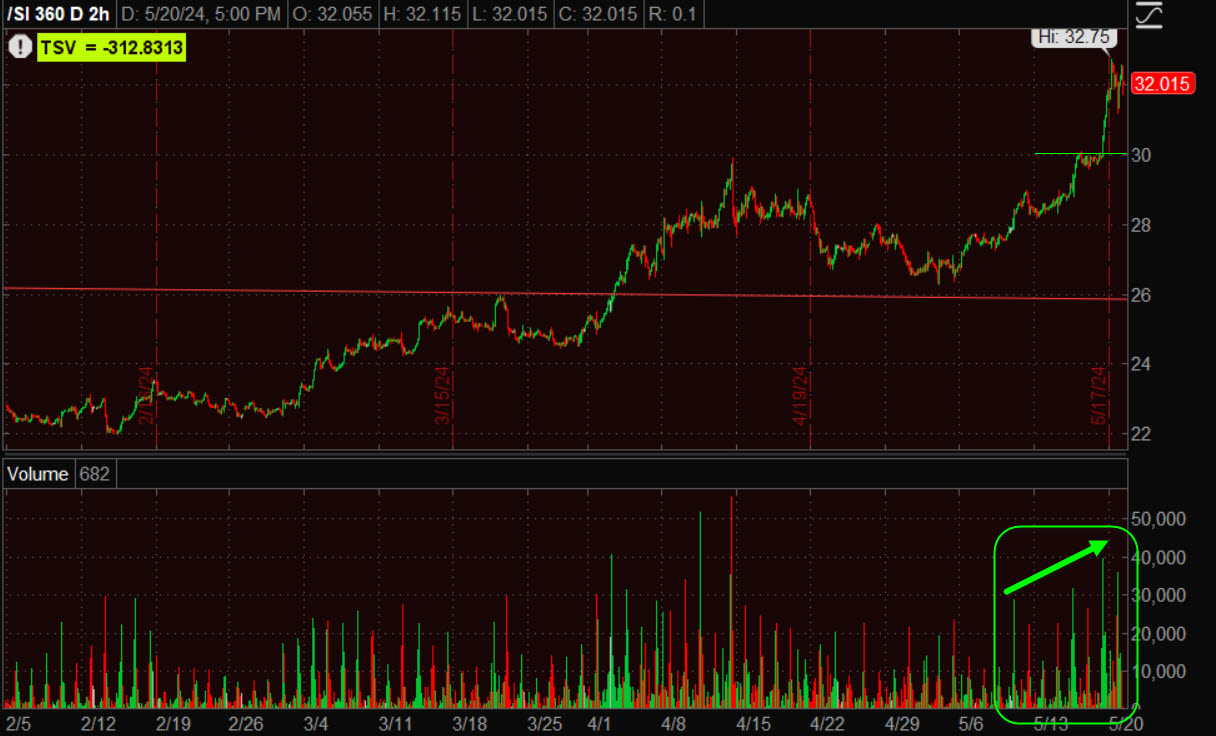 Silver futures (2H) with a beautiful breakout above $30 with increasing volume on the advance (textbook bullish price/volume action).
The $30 level is a key level of resistance going back to August of 2020…
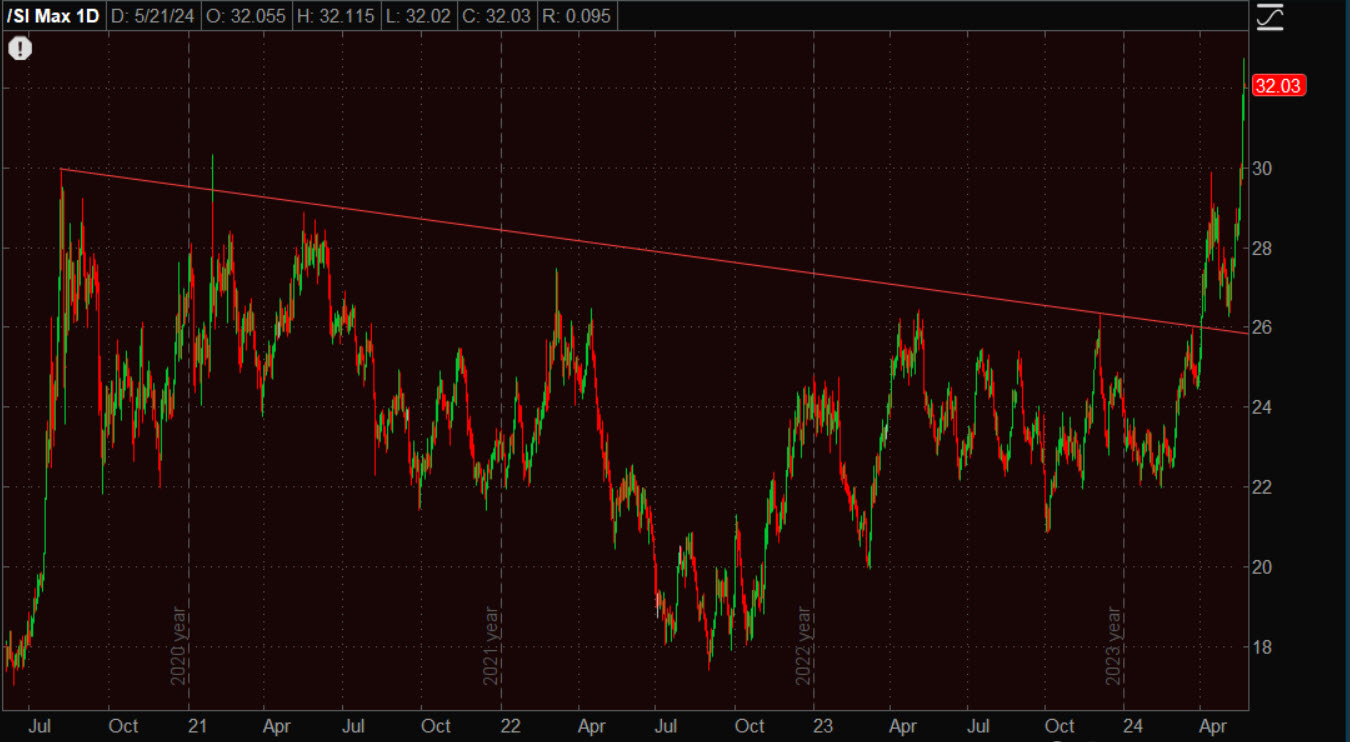 Silver futures (daily )breaking out above resistance.
In the very near term, silver looks like it’s starting to enter a consolidation, a well deserved breather at this point.
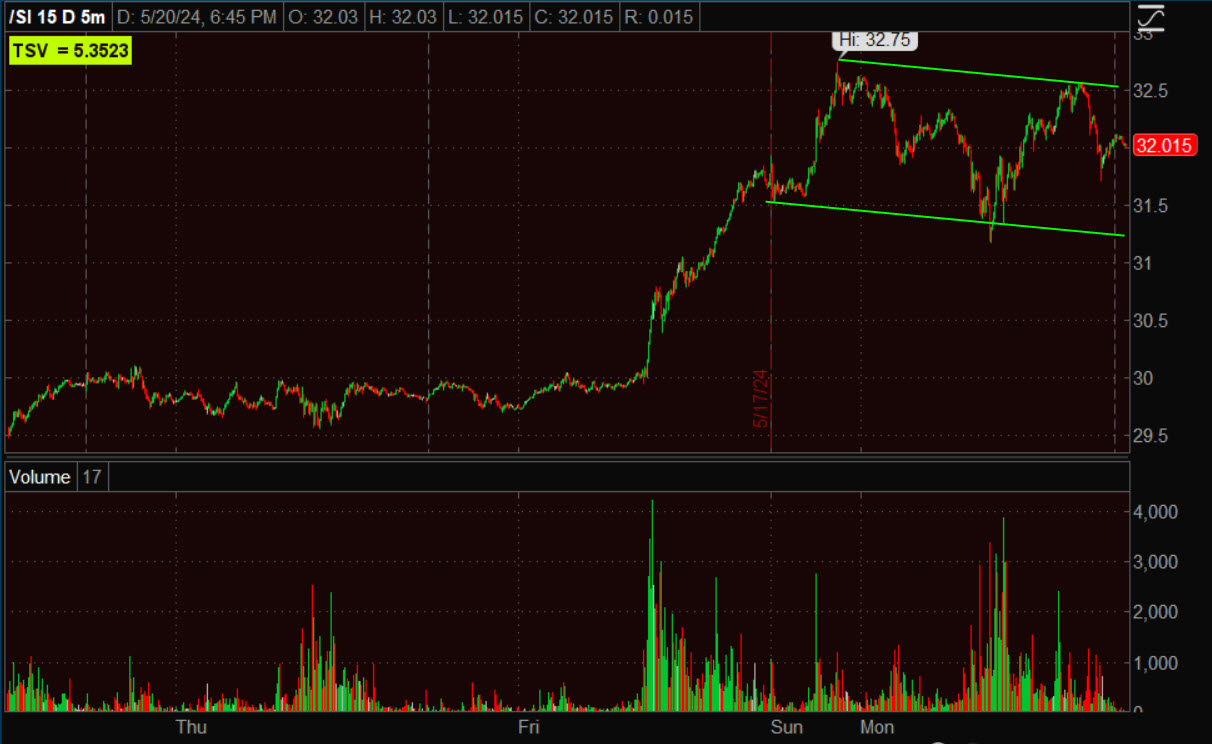 Silver futures (5m) – looking like a small bull flag.
There is a developing theme accentuated by commodities’ strength recently and specifically on Friday; that’s an inflationary theme. About 50% of silver production is for industrial use versus about 10% of gold production. Thus, this surge in silver is another example of commodity inflation starting to look like it’s nearly on fire.
Last week Bitcoin’s price action improved notably for the first time in a while. From last Thursday’s Daily Wrap,
“Bitcoin was down -1.7% at the cash close. The decline wasn’t a game changer. In fact, in my view Bitcoin looks the best it has since the trend of lower highs/lower lows off the March record high.
 BTC/USD (4H) yesterday’s volume gives some credibility to an inverse H&S base, but price will need to breakout above $68k on good volume to even kick-start an advance.”
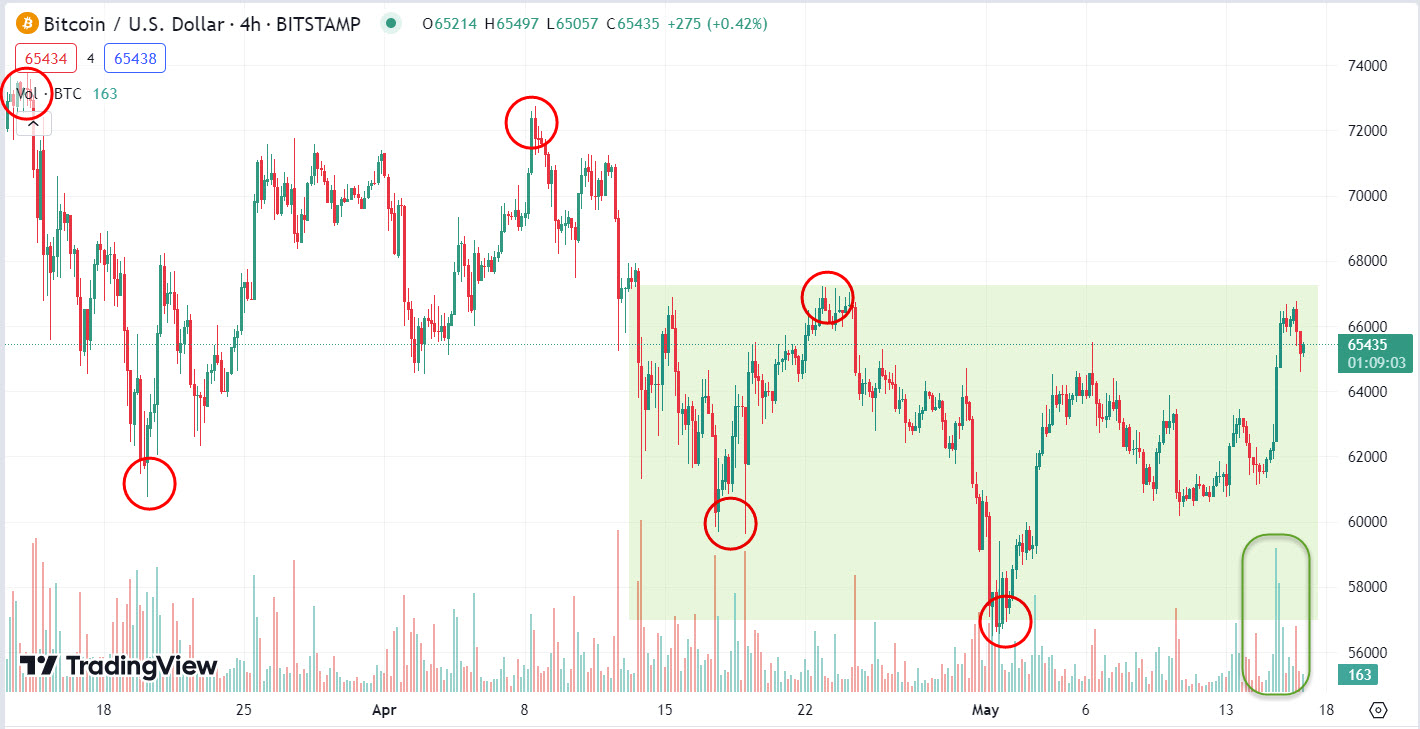
Crypto added to gains this afternoon after Bloomberg’s Eric Balchunas upgraded his view of Spot Ether ETF approval to 75% (vote expected this week).
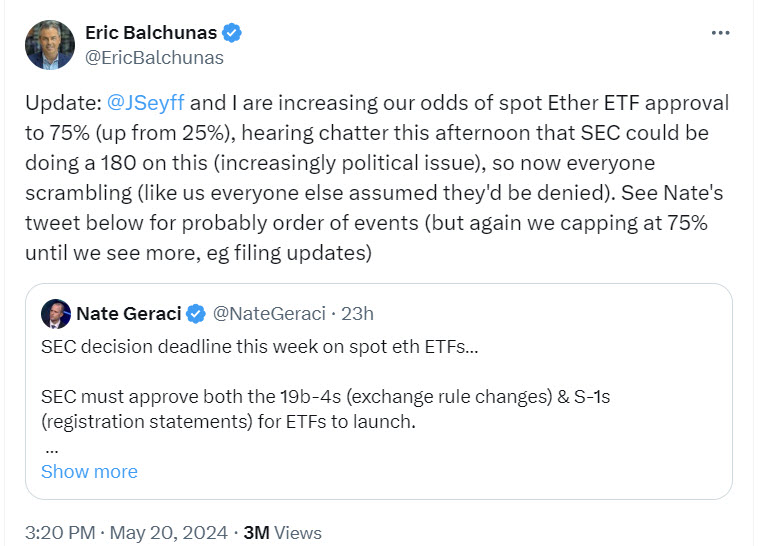
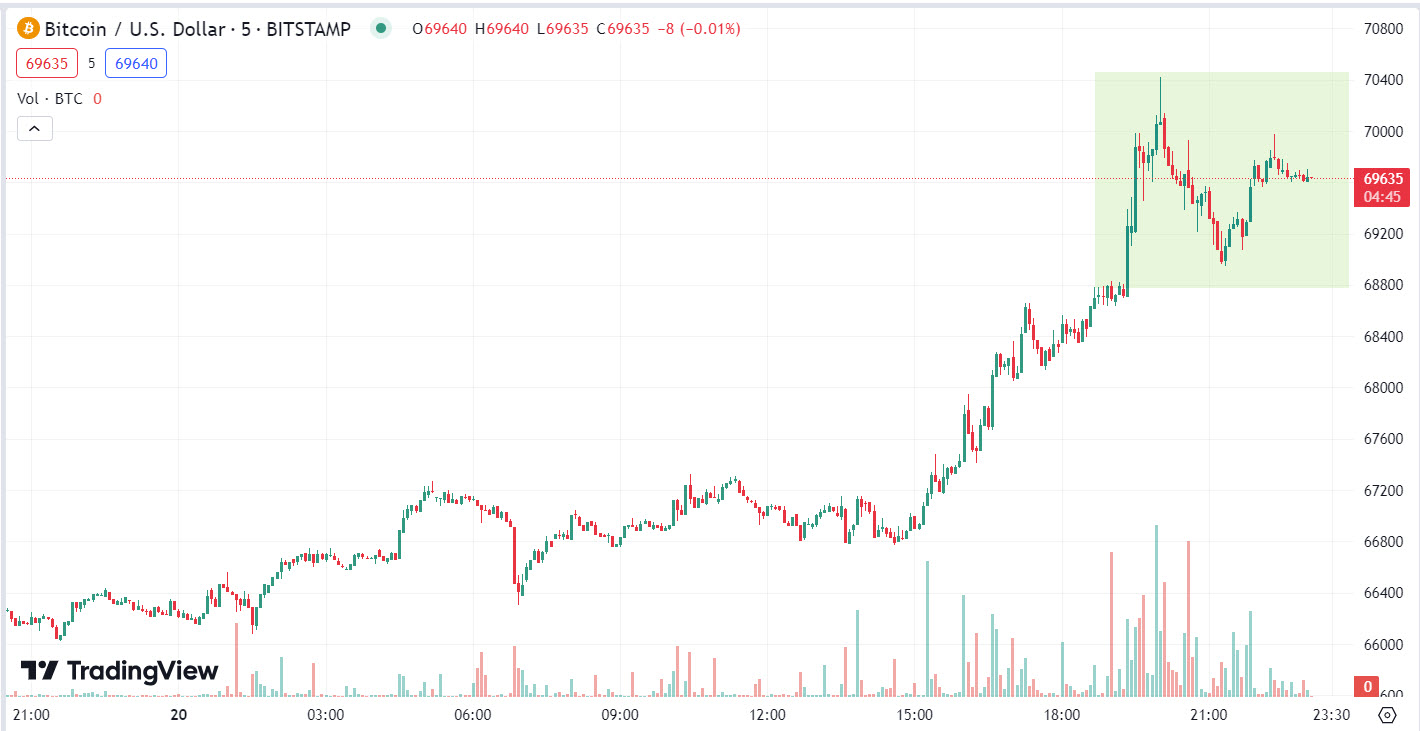 BTC/USD (5m) – the tweet sent BTC/USD above $68k, and that represents a breakout from the inverse H&S base that formed last week…
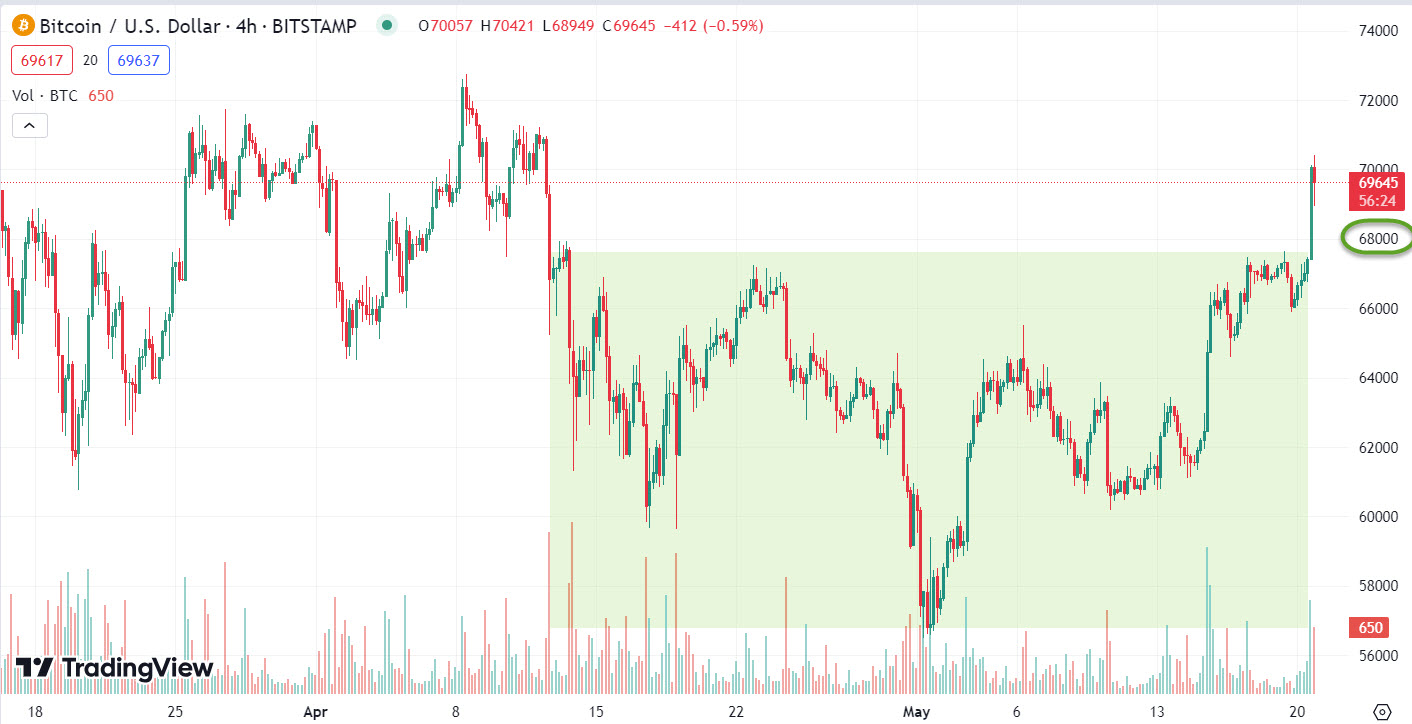 BTC/USD (4H)- Volume could be better on the breakout above $68k, but the price action looks good thus far.
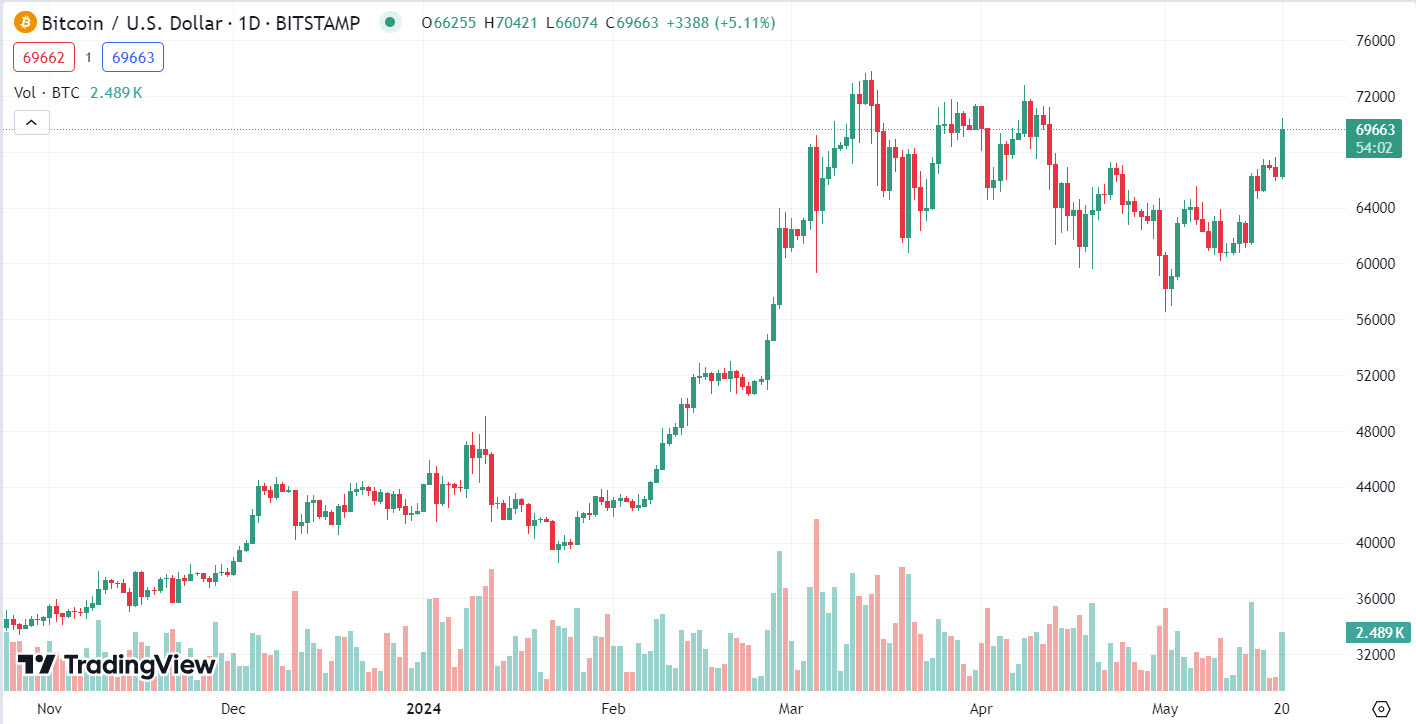 BTC/USD (daily) – Bitcoin posted a gain of about +5%. As posted Thursday, the inverse H&S base has a measured move that could take Bitcoin to a new record high around $78k.
Summary
While there’s a lot going on with the market at or just off record highs, and all eyes on Nvidia’s earnings Wednesday, with a lot of Fed speakers this week, I think there’s a seriously underappreciated inflationary threat. The S&P gained +7% off the April low. Most of that was just meeting the $5200-$5209 measured move, but the S&P added another +2% in the run up to, and reaction to last Wednesday’s slightly cooler than expected Headline CPI (0.3% Mom vs. 0.4% expected), although 3 of 4 CPI components came in as expected and Super-Core CPI (excludes volatile food and energy prices, and also shelter/rent) came in hotter than expected above 5%, or the hottest in a year. Fed officials say Super-Core is useful in the current climate as they see elevated housing inflation as a temporary problem and not as good a measure of underlying prices. A 5% print in Super-Core CPI would seemingly be a big problem for the Fed, yet the market latched on to a very slight miss at the headline level and rallied.
In other words, it’s as if equity investors saw one mediocre print in CPI (after a hot PPI the day before and 3 very hot CPI prints before that) and assumed that inflation is now a thing of the past. Ironically, the next couple of days saw various commodities soar. Since CPI last Wednesday, rate-cut expectations have drifted hawkishly lower to erase all the dovish CPI jump.
There are a number of different commodity indices and we could look at… dozens really, but I think a few charts will get the point across.
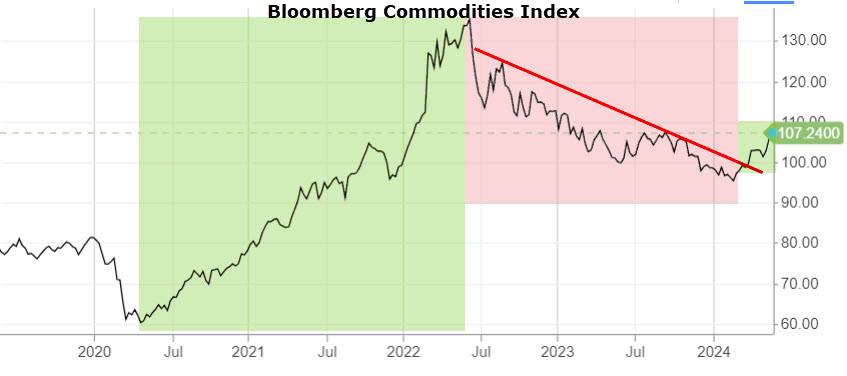
The Bloomberg Commodity Index is showing the same thing as my Copper : Gold ratio (posted last Friday in the Afternoon Update)… signs of even more resurgent inflation in commodities. The BBG Commodity Index shows the sharp inflation of 2021-2022, and then “Peak inflation” which I called out (using the Copper:Gold ratio) in June of 2022. Since then inflation has been moderating, until 2024. The BBG commod index shows it breaking out above the deflationary trend from June 2022 to the far right.
Here’s the updated Coper:Gold ratio…
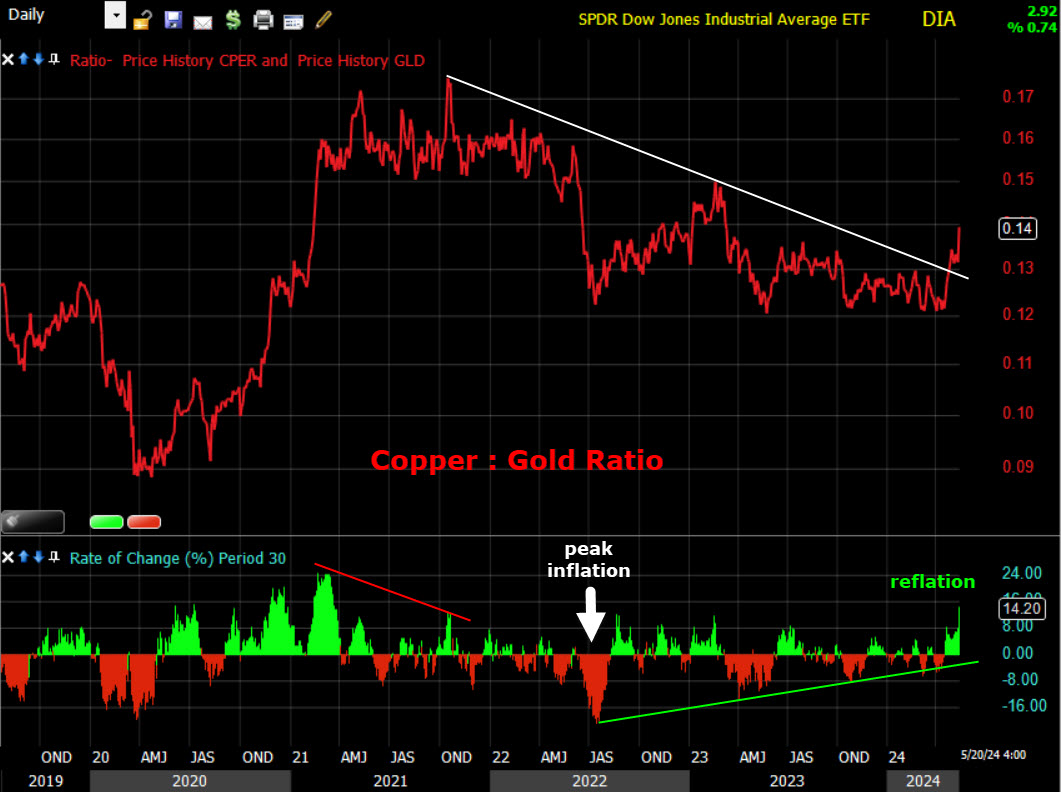 It too is signaling resurgent inflation and this is with gold acting very well and making new record highs!
The GSCI commodity Index shows the same…
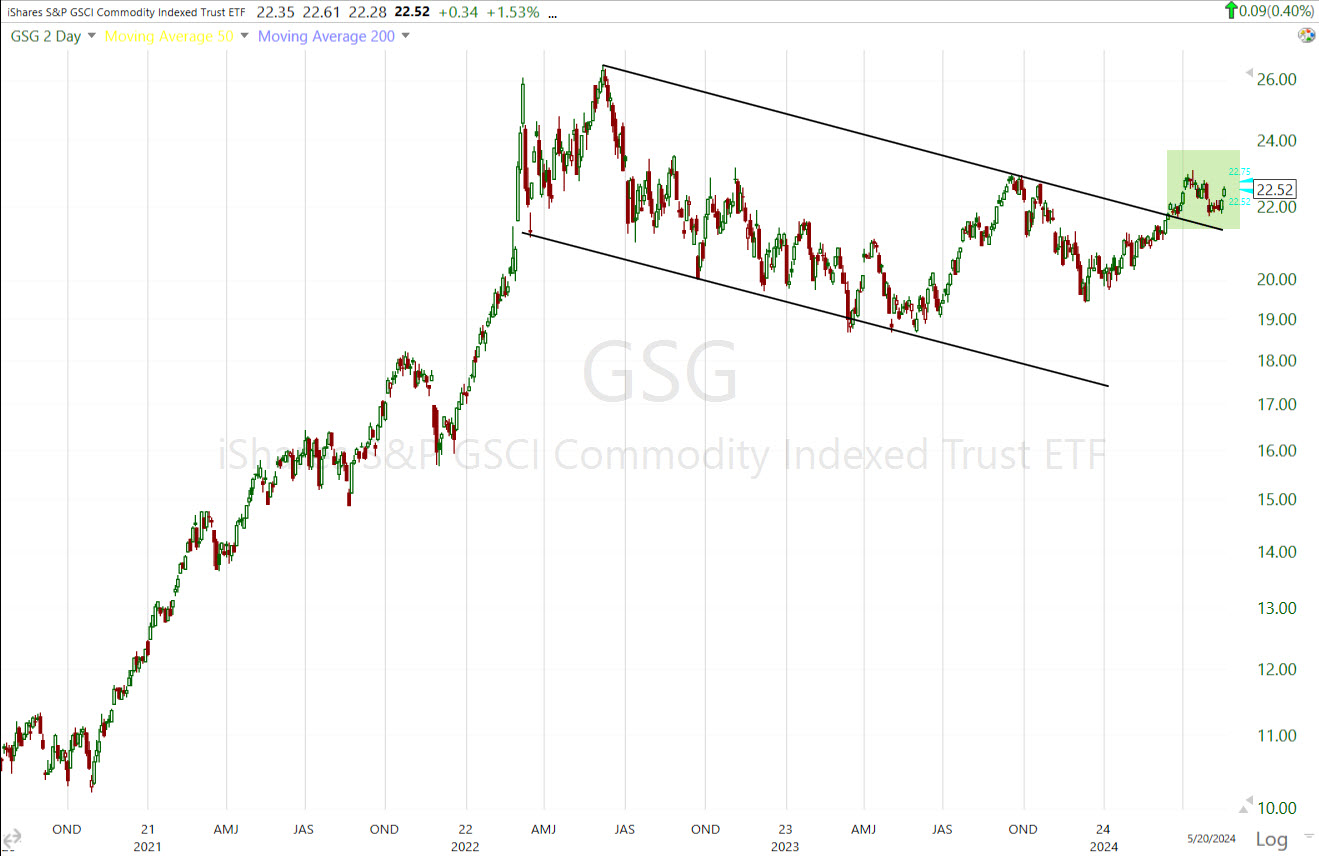 (2 Day) – a breakout from the deflationary trend that the Fed has been counting on to cut rates and avoid a hard landing recession.
Here’s the CRB Index…
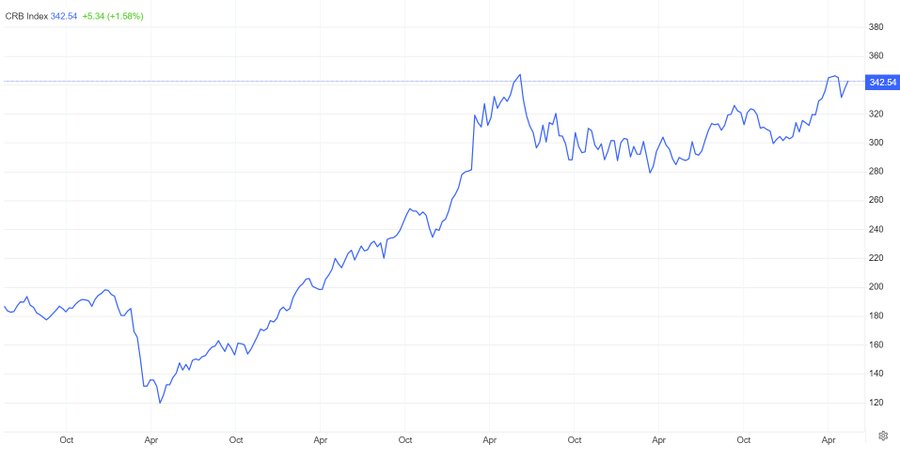 Not just breaking trend, but nearing new highs for the ongoing inflation cycle.
And the Dow Jones UBS Commodity Index…
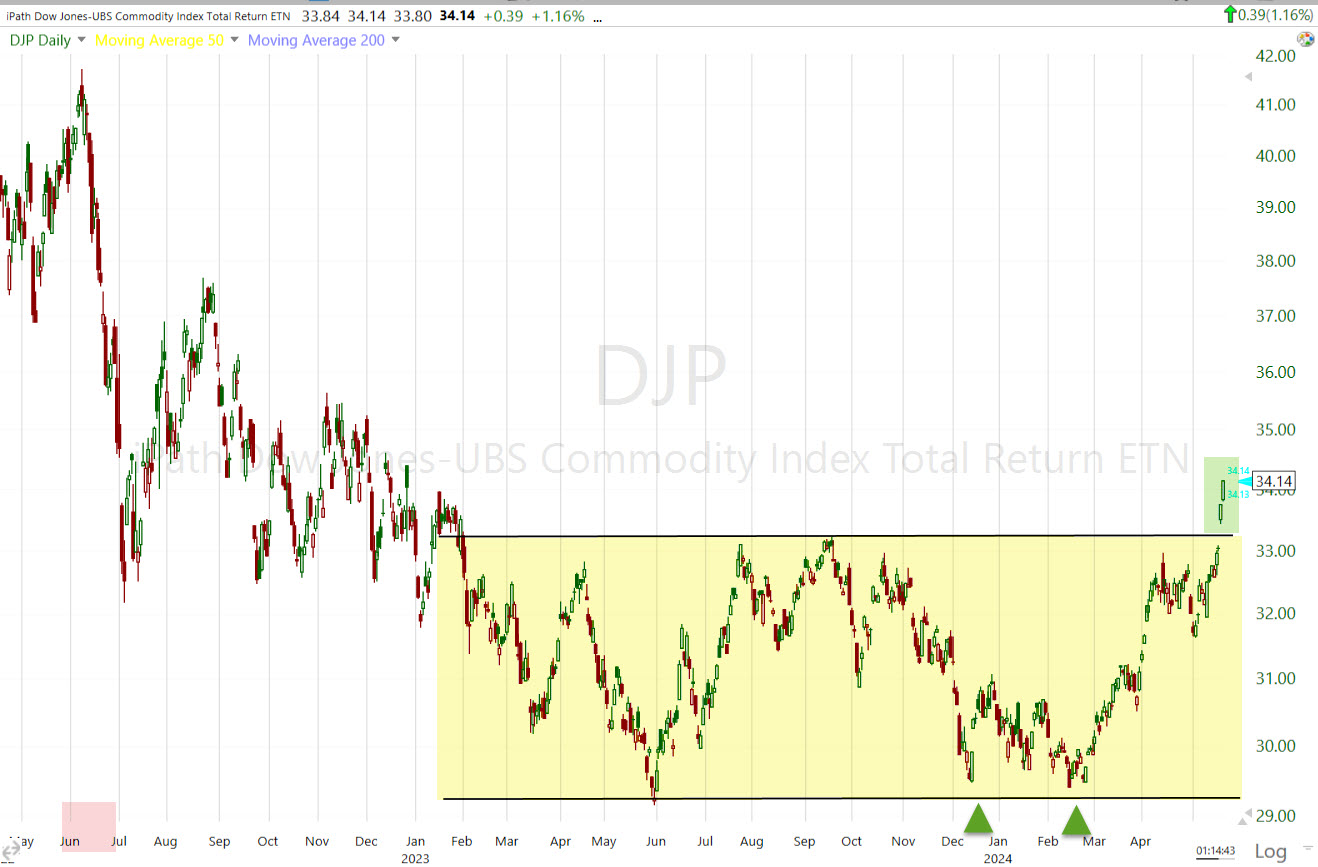 (daily) with peak inflation June 2022 (red) and a large range into 2024 with two higher lows before breaking out the last 2 days.
Here’s the big picture view…
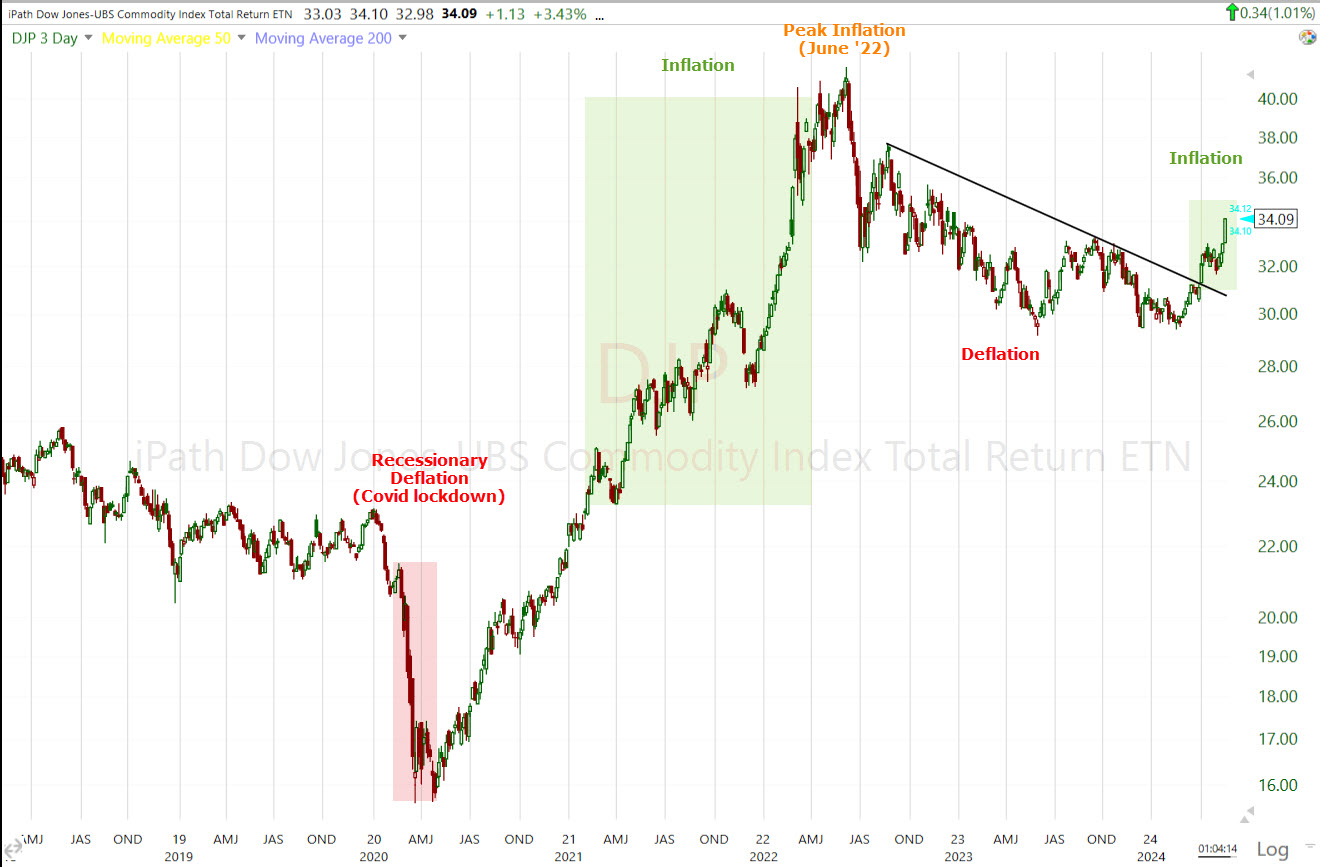 Dow Jones – UBS commodity Index (3 Day) – Peak inflation in June of 2022 cleared the way for the eventual bottom of 2022’s bear market and the bases that formed in the major equity averages in September/October of 2022, which led to the current primary up-trend that’s still intact. However, commodity prices are rising again and most every commodity index I’ve looked at is either breaking out of the deflationary trend that allowed stocks to rally off 2022’s bear market low, or are on the verge of breaking out. This inflationary dynamic is a broader basket of commodities and beyond what we’ve already seen this year in CPI, PPI, PCE, wages, etc.
Oil prices from here are still key as petroleum is used in virtually everything from manufacturing to services. Oil is the largest, and most important commodity with regard to inflation by far. Oil pulled back about 12% from its April pivot high and opened a window for stocks to rally off April lows following CTA selling of Tech earlier in the month.
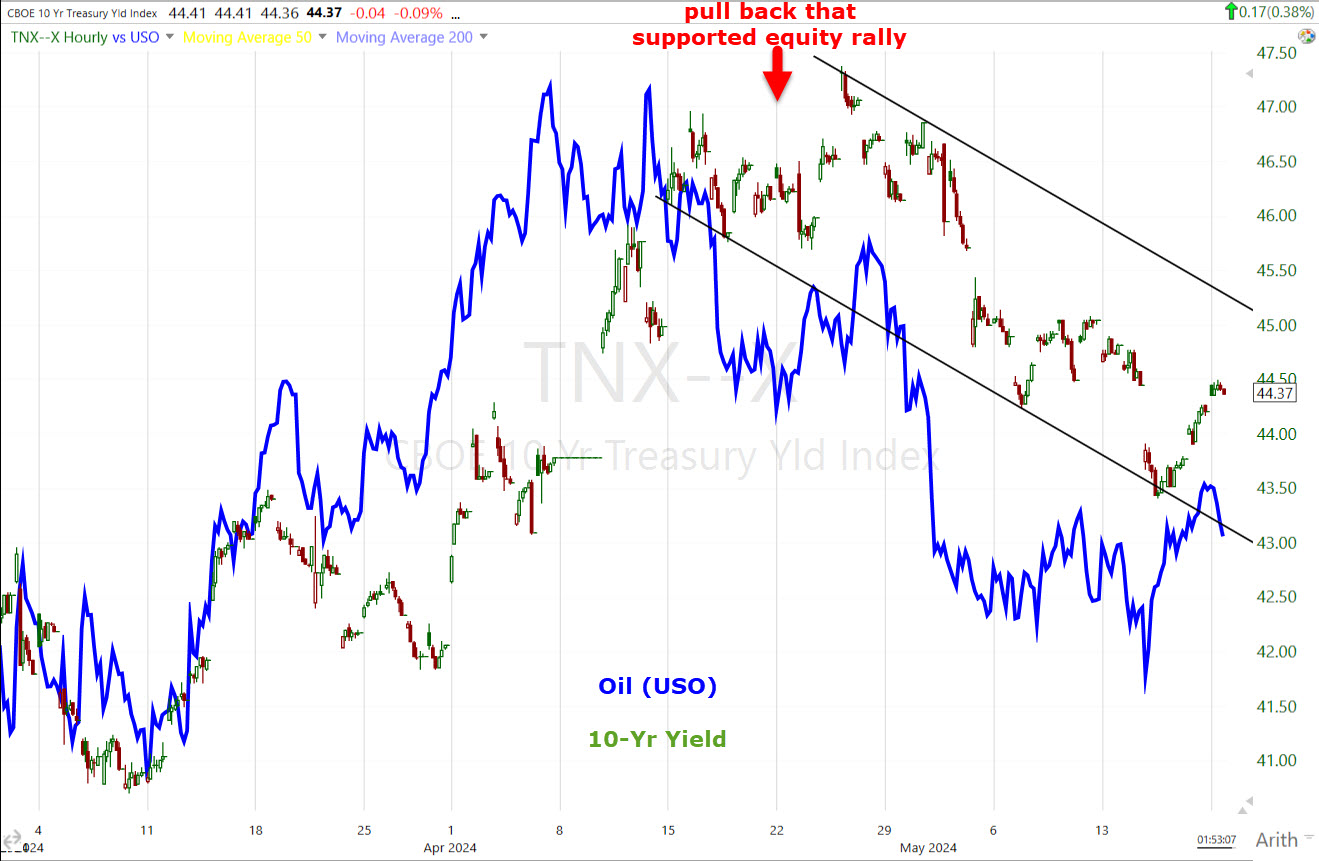 The pull back in yields was preceded by the pull back in oil prices, and supported the equity market rally off mid-April pivot lows. That’s why I’m paying such close attention to crude oil and the trend line its year-to-date up trend that it’s holding as support.
Higher commodity prices are obviously unhelpful while core services inflation remains problematic. Should Oil (WTI Crude) get some traction on the upside above $81, yields will follow higher and reassert pressure on equity valuations in what have been 2024’s leadership groups like the weighty Technology sector, mega-caps and semiconductors.
The commodity inflation surge has been quietly building, but over the last few days it’s breaking into a new inflationary trend and it seems to me that with last week’s CPI, this clear and present risk may be seriously underpriced by equity investors. The slightly cooler than expected CPI may have even thrown equity investors into a state of complacency on the inflation front at exactly the wrong time. You may have noticed that many of our commodity related picks like Silver, URA and UNG are the assets acting really well with strong price/volume action and numerous breakouts.
The main thrust of my January video was that this year is going to bring unforeseen surprises. I believe this is the second (first inflation, second the ramping up across a broad array of commodities).
Overnight
S&P futures are unchanged tonight. NASDAQ-100 futures are down -0.1%. Interestingly, VIX futures, which have been sold fairly ruthlessly the last couple of weeks, are up +2.65% tonight when normally they’d be about flat. Perhaps we’ll see VIX do some fast catching up with VVIX’s relative strength trend. that would give better clarity and timing for VVIX’s relative performance forecast.
The U.S. Dollar index is p +0.1%
WTI Crude Oil futures are down -0.5% and holding above the trend line.
Gold futures are down -0.65% to $2423/oz.
Bitcoin futures are up +1.3%
Yields are up about 1 basis point.
Looking ahead, retailers Lowe’s (LOW), Macy’s (M), and AutoZone (AZO) report earnings in front of Tuesday’s open.
There is no US economic data of note on Tuesday’s calendar.