This is one of a handful of market updates posted every day for subscribers at Wolf-on-WallStreetTrade.com… The Early Update, which sets the tone for the day, and unveils key observations that move price that aren’t usually obvious looking at price alone. You can still subscribe to Wolf on Wall Street at a discounted rate until the transition to the Technical Take (including Discord room) is complete.
Here’s this morning’s subscribers’ Early Update. I hope you find it useful.
It seems to me that we’re seeing pretty much exactly what I expected as measured moves were closed in on – selling into price strength, most notably in 2024 maret leaders (Tech).
Most of the averages are little changed. Small Caps are the weakest.
SP-500 -0.1%, Dow +0.2% (Transports -0.4%), NASDAQ-100 -0.1%, Small Caps -0.8%
Between 3C warning signs from Friday, getting worse Monday and Tuesday…
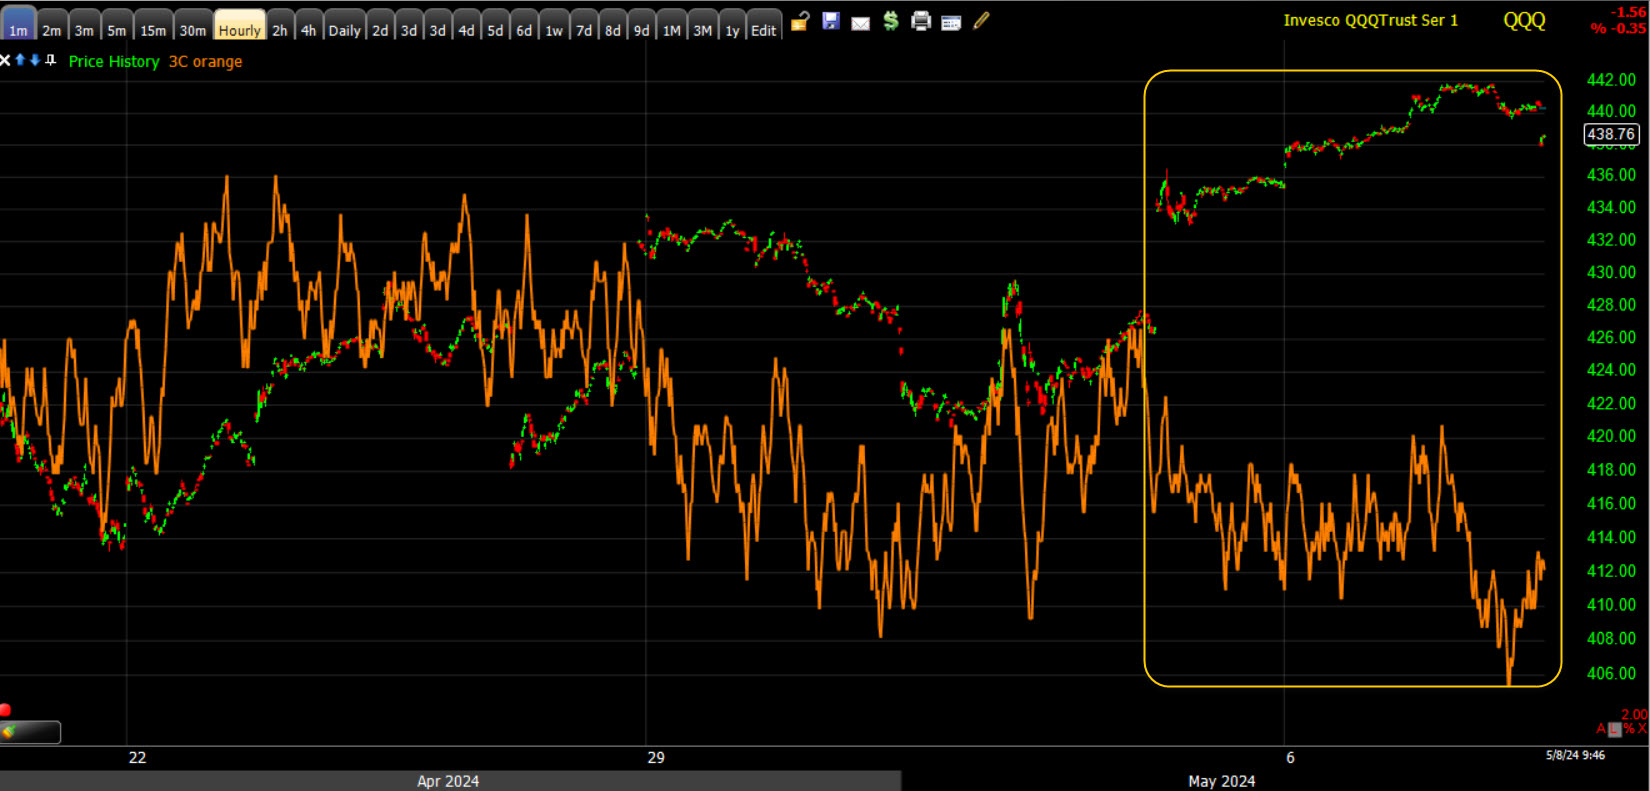 QQQ (1m) negatively diverging from Friday.
Some less overt changes in character like early relative strength in volatility, and newly forming lack of confirmation in HY Credit; plus…
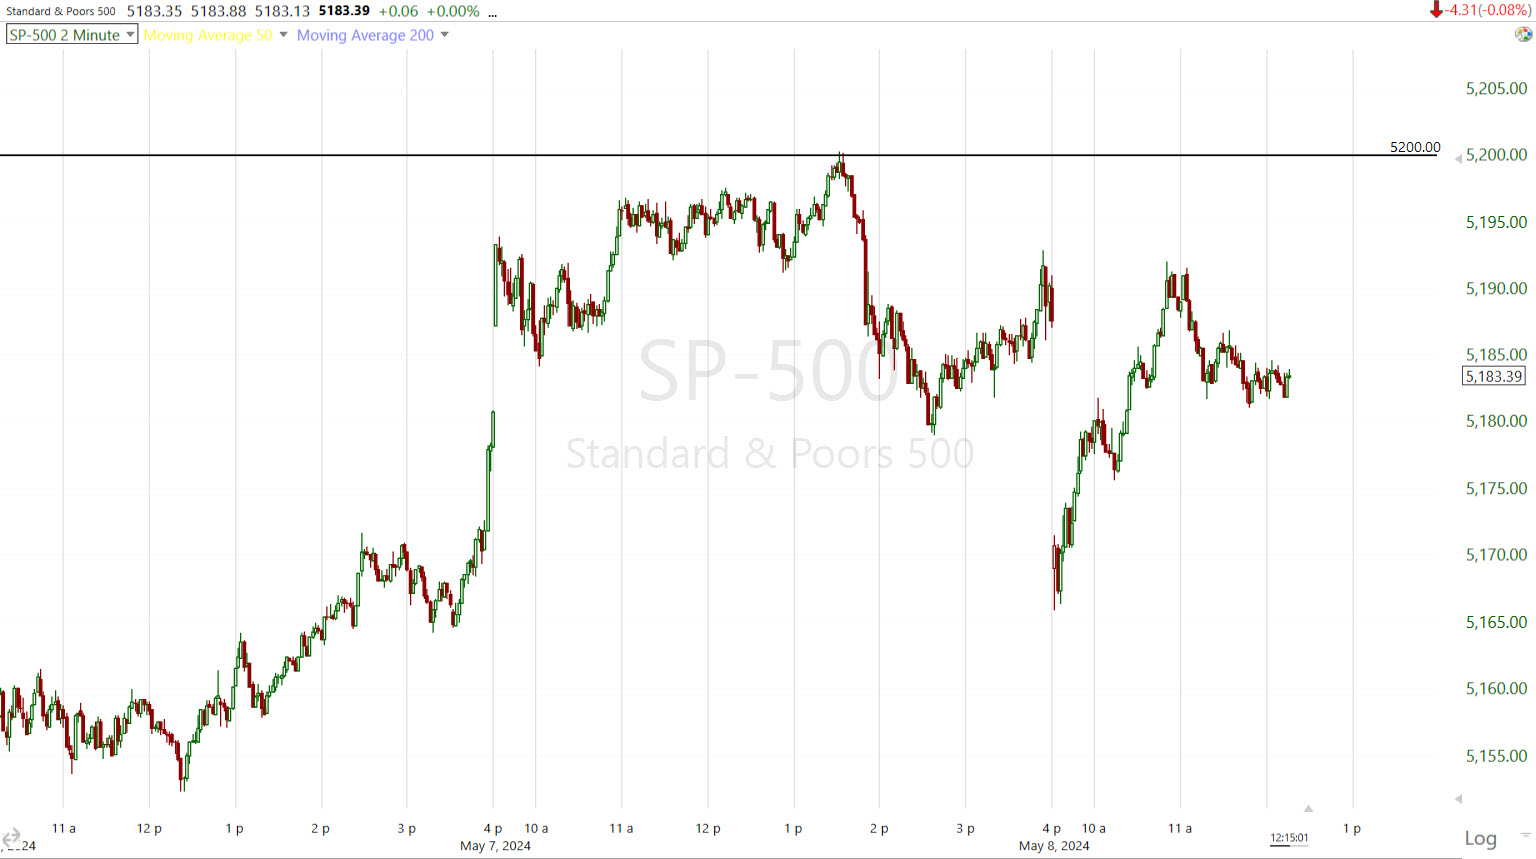
The S&P (1m) tagging the low end of the $5200-$5209 measured move yesterday (@ $5200.23) and price declining, and a weaker bear flag-like close…
Changes in tone have mounted up fast the closer we’ve moved to SPX $5200 (measured move from April low/inverse H&S base).
The averages may have been better off taking a breather Monday and consolidating at price and technical resistance, but I have a feeling it wouldn’t have changed much. We’re going on a week post FOMC and the message was that progress on inflation has stalled. While obvious, it was a big confession for the Fed to make compared to the March 20th FOMC in which Powell buried his head in the sand and pretty much gave the impression that resurgent inflation isn’t even on their bingo card.
To summarize, as I wrote last night,
“in December/January the market was pricing in Goldilocks – decelerating inflation, lower rates, accelerating earnings and no-landing (no recession) with the cherry on top of 7 rate cuts for 2024 priced in. One quarter later and things look very different now than then.”
The market went from an overidealized best case scenario, to a much more uncertain reality. Why wouldn’t investors, who were paying a premium for Goldilocks just a few months ago, start to reprice the less cheerful reality? And why wouldn’t they do it when they have the opportunity to sell into price strength? Weaker 3C charts in recent days have been pretty much focused on SPX, NDX and Semis – the 2024 market leaders representing Goldilocks.
That doesn’t mean that we don’t have more chop and volatility ahead and as I waned months ago, as the averages make that right hand turn into lateral, toppy and more volatile up/down 2-way price action, it can be a challenging environment for traders… a meat grinder.
In the near-term, the averages may just attempt to consolidate around the price/technical resistance from Friday. Several are coming down to those levels or are at them this morning.
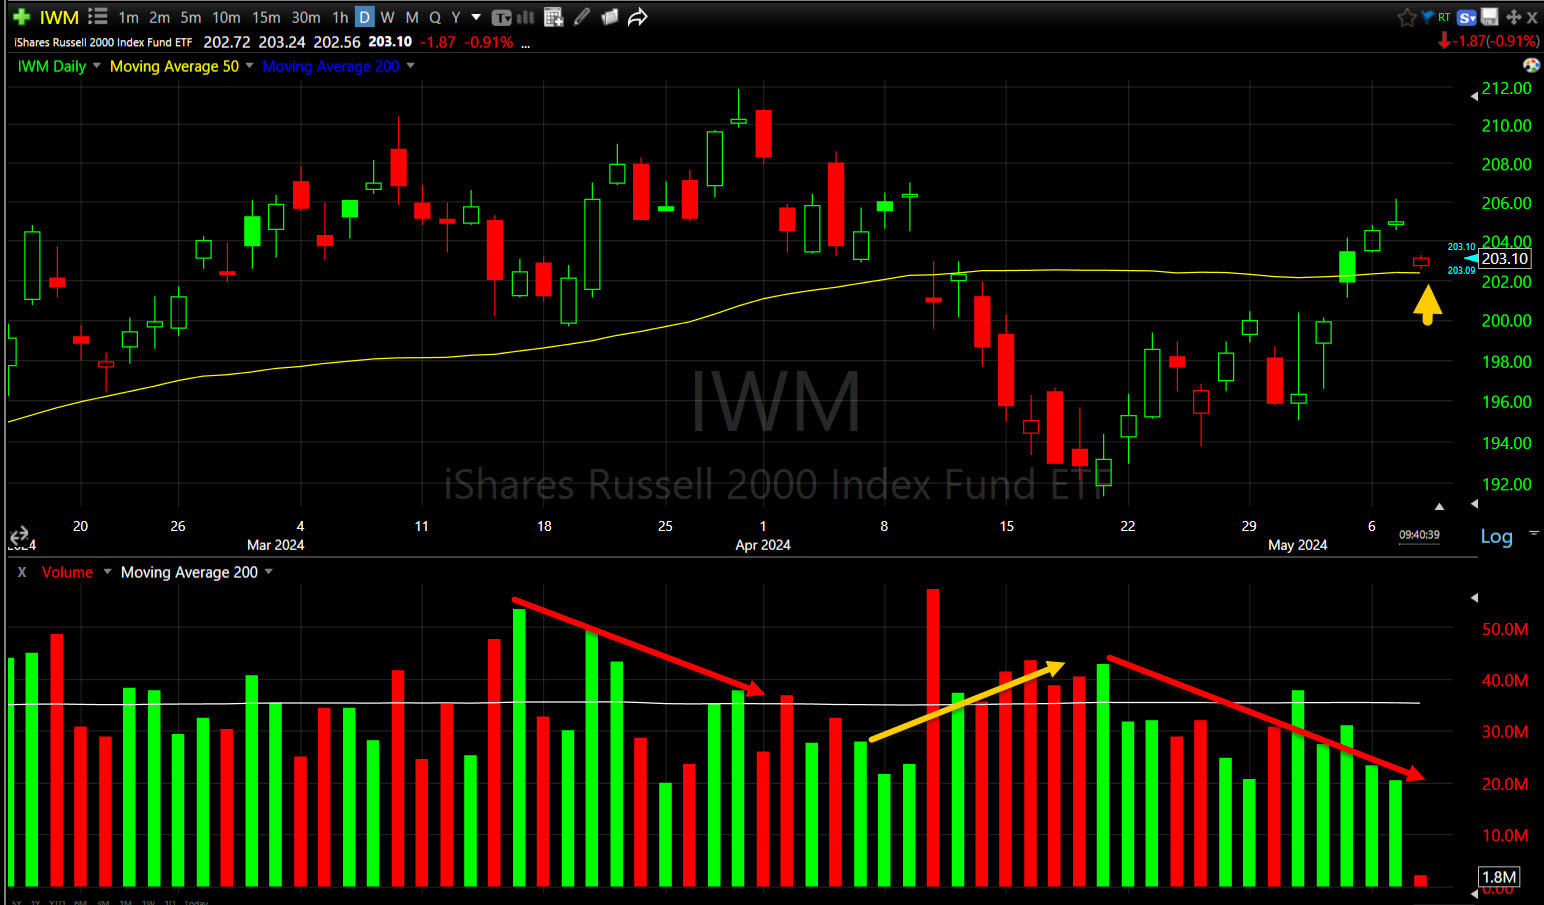 Small Cap IWM (daily) pulling back to its 50-day. While we have the chart out, I want to point out the bearish volume typical of topping environments in which rallies see declining volume (red arrows) and declines see increasing volume (yellow arrow). That’s the exact opposite of a healthy market’s price/volume trend and we’ve been seeing it in all of the averages, most of the year.
I also want to point out that the price weakness since SPX $5200 has been in an ideal environment for stocks to advance with no major economic data this week, the bulk of earnings season behind us, the corporate buyback window nearly fully reopened, CTA’s re-leveraging, and a supportive environment in Rates and the Dollar.
My Most Shorted Index went from a trend of short covering in the days leading up to last week’s FOMC and to start the new week, to ending slightly lower yesterday. This morning it appears short sellers are reengaging after yesterday’s price weakness.
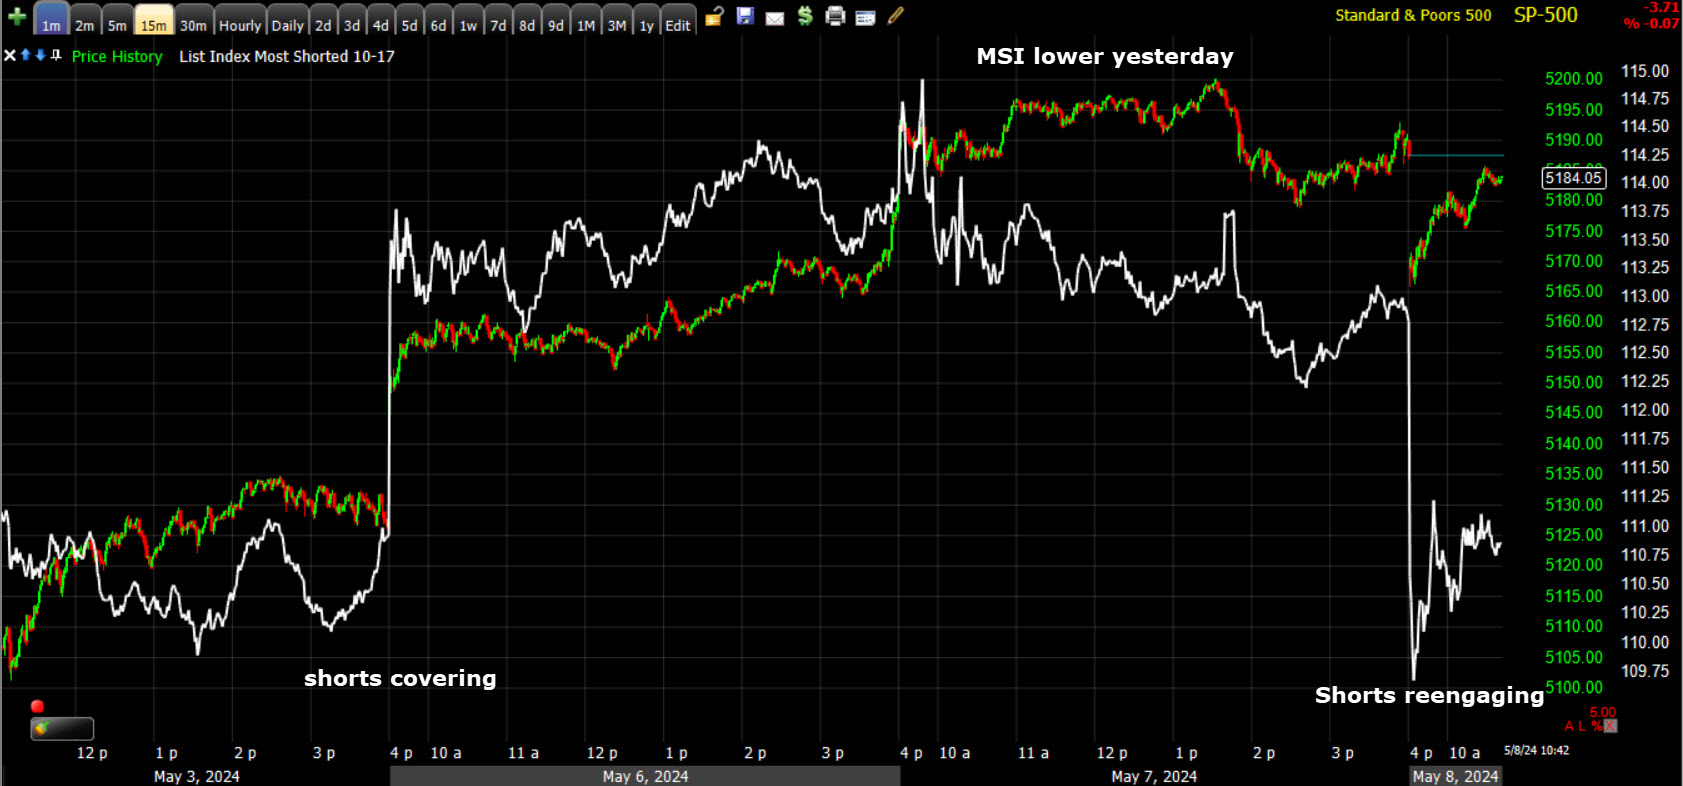 SPX/MSI (1m) – they may be a little early as there’s still gaps to be filled.
VIX is up 0% and acting normal, but recall VVIX’s surge into yesterday’s close as VIX was getting hammered at the same time? VVIX is up another +0.4% and starting to display the relative strength that tends to show up near market downside pivots.
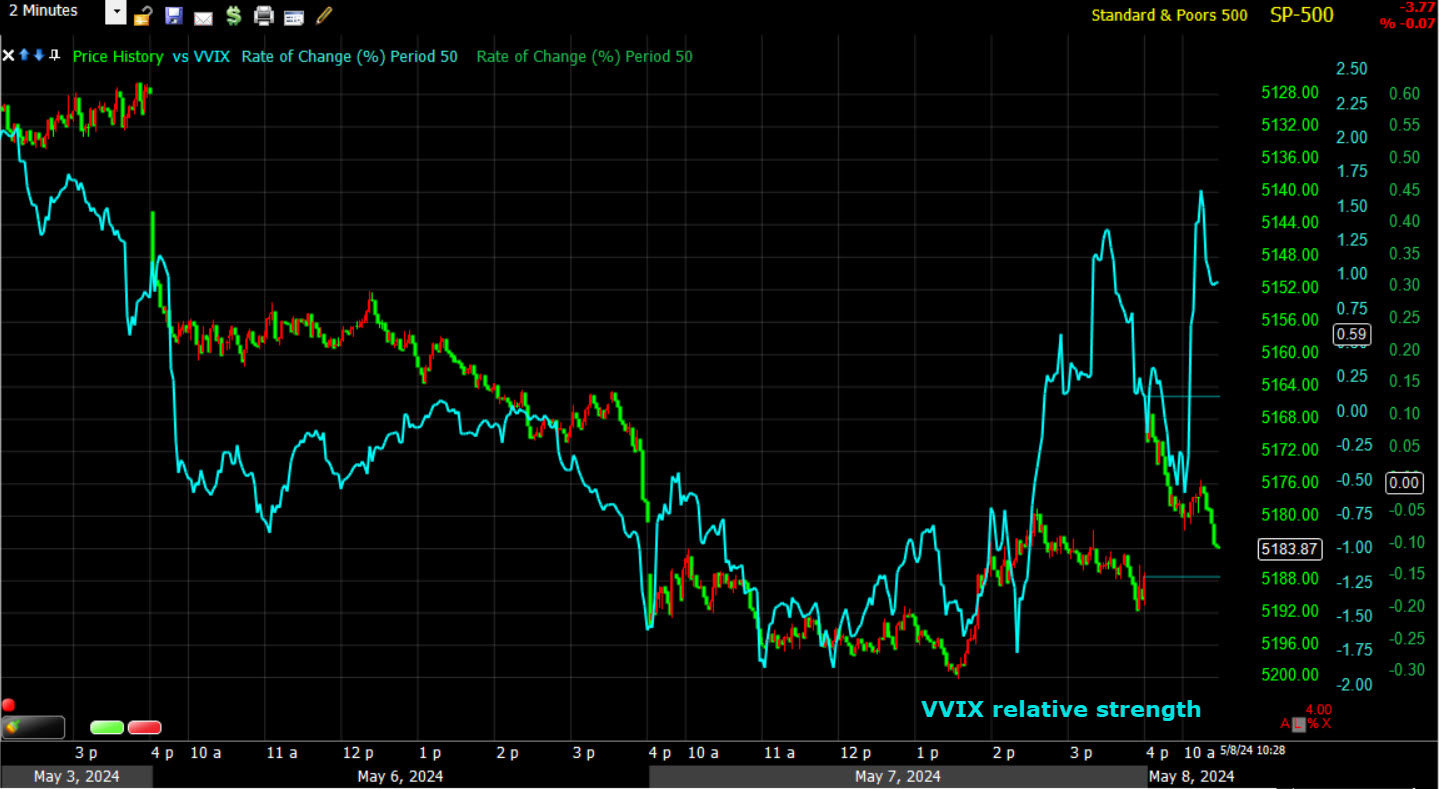 SPX (2m w/ price inverted) and VVIX with very recent relative strength. We haven’t seen relative strength here since the second week of April as CTA selling was winding up, giving us one of the ugliest weeks for the averages of the year. This is till a very new and emerging development, but it makes sense to me as the SPX was nearing and then tagged $5200.
S&P sectors are split with 5 of 11 green. At the top of the leaderboard are defensive Utilities (+0.5%), Communications (+0.3%), Technology (+0.15%) and Energy (+0.1%).
At the bottom are Real Estate (-0.7%) and Consume Discretionary (-0.5%). Tesla (TSLA -1.9%) is weighing on Consumer Discretionary after news this morning of a Department of Justice (DOJ) Securities Fraud probe over Tesla’s deceptive self-driving capabilities.
The morning doesn’t have a coherent feel in sector bias, beyond some individual stock earnings effecting sectors.
Mega-caps (MGK -0.25%) are seeing mixed action, and similar to the Equal Weight S&P (-0.15%).
On the upside: Meta Platforms (META +1%), ), Microsoft (MSFT +0.55%), and Broadcom (AVGO +1.5%).
On the downside: Apple (AAPL -0.1%), Amazon.com (AMZN -0.7%), NVIDIA (NVDA -0.75%) and Alphabet (GOOG -0.75%).
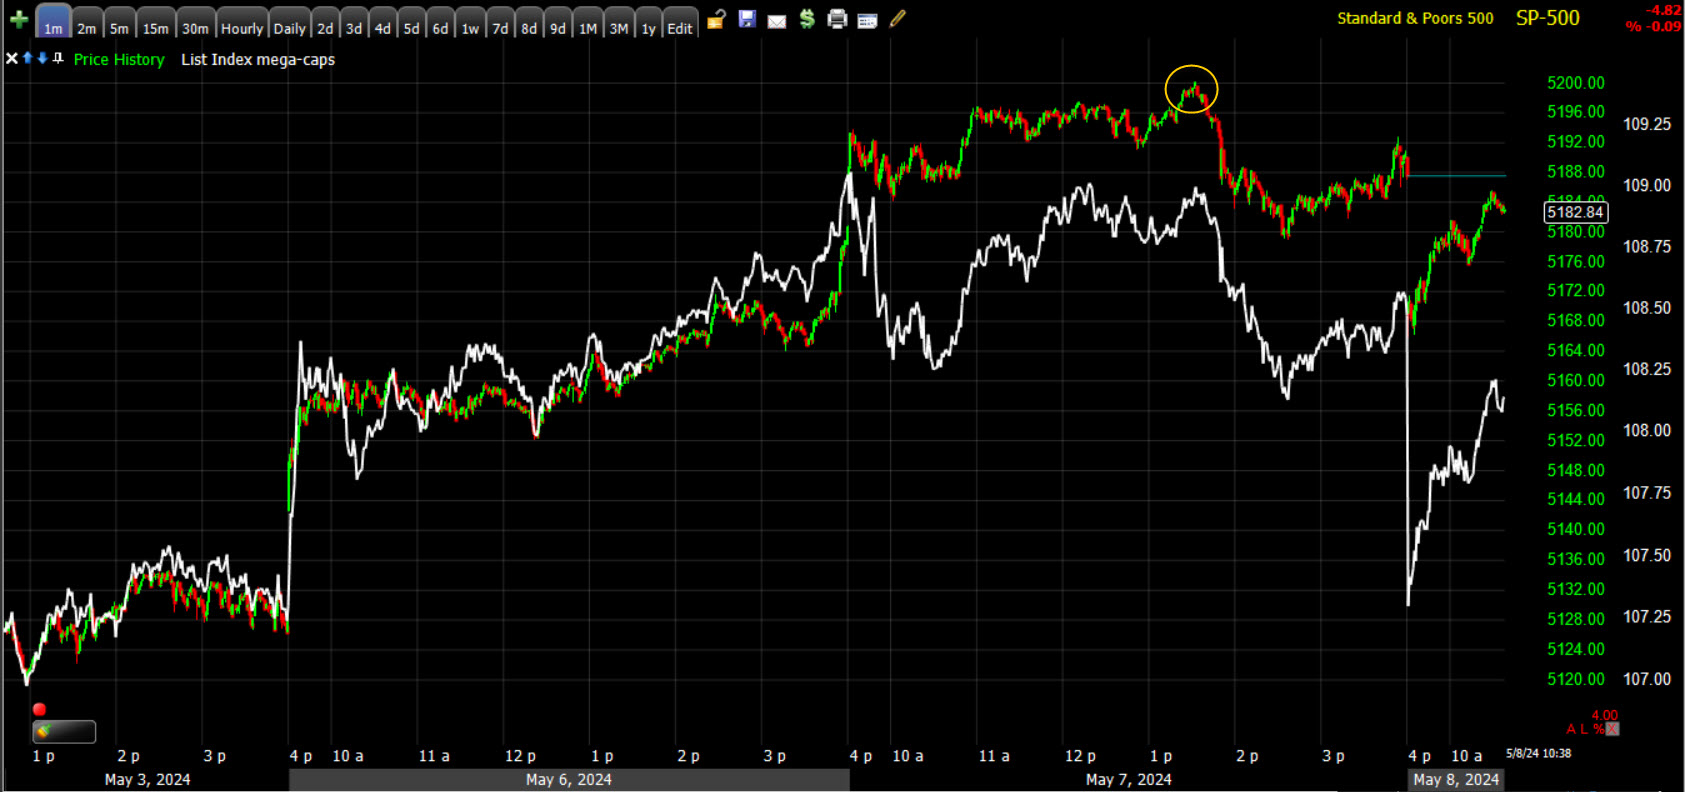 SPX (1m) and my Equal Weight Index of Mag-7 mega-caps. Because of their weight in the cap-weighted S&P, the mega-caps pretty much are the S&P which means a majority of the time the index in white and S&P track nearly tick for tick, but here we can see that as the S&P approached $5200, mega-caps displayed relative weakness – they were the focus of selling yesterday.
Semis (SOX -0.75%) are off early session lows of -1% and are one of the groups that lost upside momentum as price ran into a resistance zone. Intel (INTC (-3%) is weighing on Semis after cutting Q2 revenue guidance in response to the U.S. pulling export license to supply semiconductors to China’s Huawei.
Regional Banks (-0.1%) are near the resistance zone (top of a range) pretty much tagged on the nose yesterday.
Decliners have a modest 250 issue edge over advancers at the NYSE and a 500 issue edge at the NASDAQ. Breadth oscillators aren’t too bad after yesterday afternoon and this morning’s open, sitting at 70.
The U.S. Dollar Index is up +0.1% to $105.48. In recent days it has retraced about half of the FOMC decline. The level I see as really troublesome for stocks and representative of inflation fears coming back to the forefront for equity markets — which have been off the market’s primary radar since April 19th — is above $106.20.
WTI Crude oil futures (+0.8%) slid lower overnight after API reported inventory builds across all products. This morning’s more closely watched DOE inventory report showed a draw in Crude close to expectations (-1.36mm vs. -1.40mm expected) as compared to API’s massively larger than expected build (+509k vs. -1.40mm expected). WTI was trading around $78 ahead of the official data, just below its 100-day SMA. After the DOE draw, price rebounded and back above the YTD trend line.
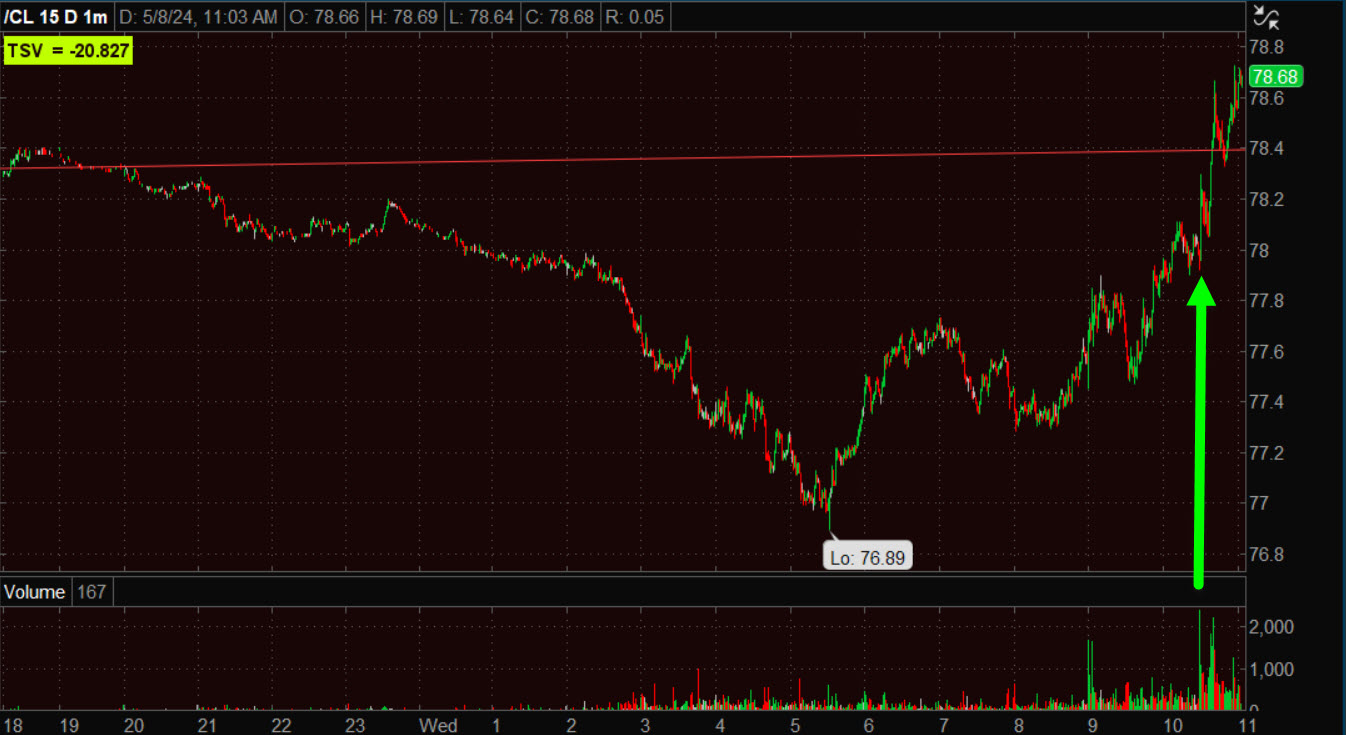 CL (1m)
Oil has been pulling back since early April as geopolitical risk premium unwound after Israel/Iran’s tit-for-tat, which gave the equity market a window of opportunity with inflationary forces not in the market’s face. Recently Oil’s pull back has reached the YTD up trend, which is key support not just for oil price, but as a canary in the coalmine for the 2024 reflationary impulse.
On a related note, OPEC is due to meet next month to assess supply policy after implementing production cuts over the first half of the year to support prices. Most traders expect that the curbs will be extended, possibly to the year-end.
URA (-2.55%) is pulling back from its first attempt at multi-year resistance yesterday.
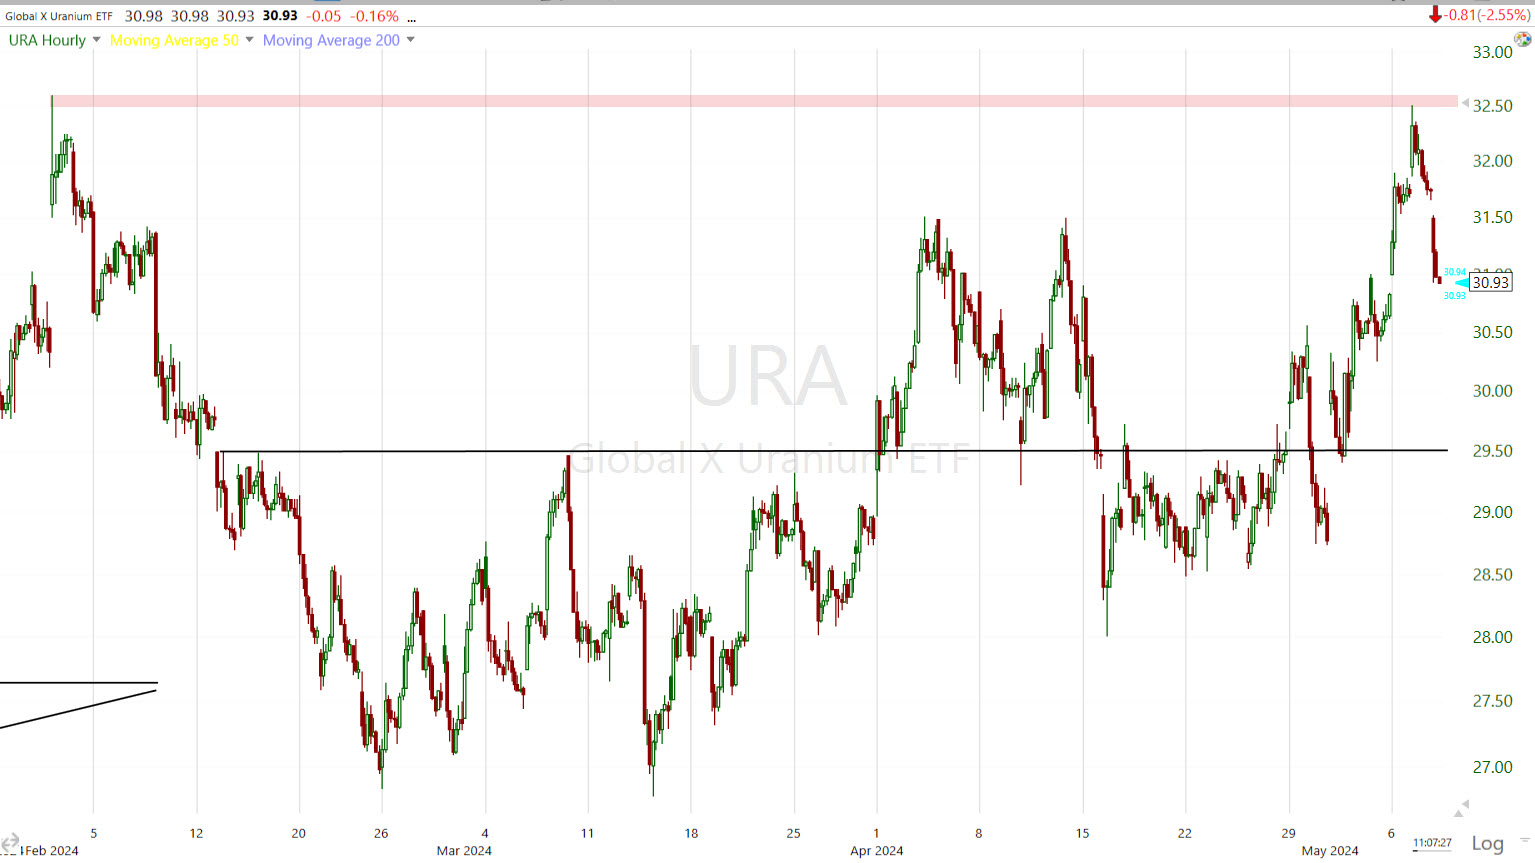
URA (60m) – this is an incredibly important, and major zone stretching back to November 2021. Much in the same way it took WTI Crude oil some time to work through resistance/overhead supply at $79-$81, it may take a few shots and some consolidation before breaking out, but I do believe that’s the most likely outcome.
Gold futures are nearly unchanged (+0.1%) and that leaves them in a developing bullish consolidation.
Gold miner, Newmont (NEM), is up +0.5% and I’d consider it to still be in consolidation.
Yields are mixed. The 2-yr is flat at 4.83% and the 10-yr is up +2 bp to 4.48%.
High yield Credit (HYG -0.2%) is displaying more relative weakness. It’s important to remember that HYG led the S&P higher off the April 19th market low with 4-days of relative strength, or a leading positive signal. Each dip the S&P has made =since then to a higher low (short term uptrend) has been led higher by HYG. It’s only recently as the S&P neared $5200 that HYG has started to display relative weakness.

SPX/HYG (2m) recent HYG relative weakness. This is not a strong leading negative signal, but it is a negative change in character, which is why I said on Monday that HYG would be among a few assets (including volatility’s relative performance and 3C charts) that would be high on my watchlist.
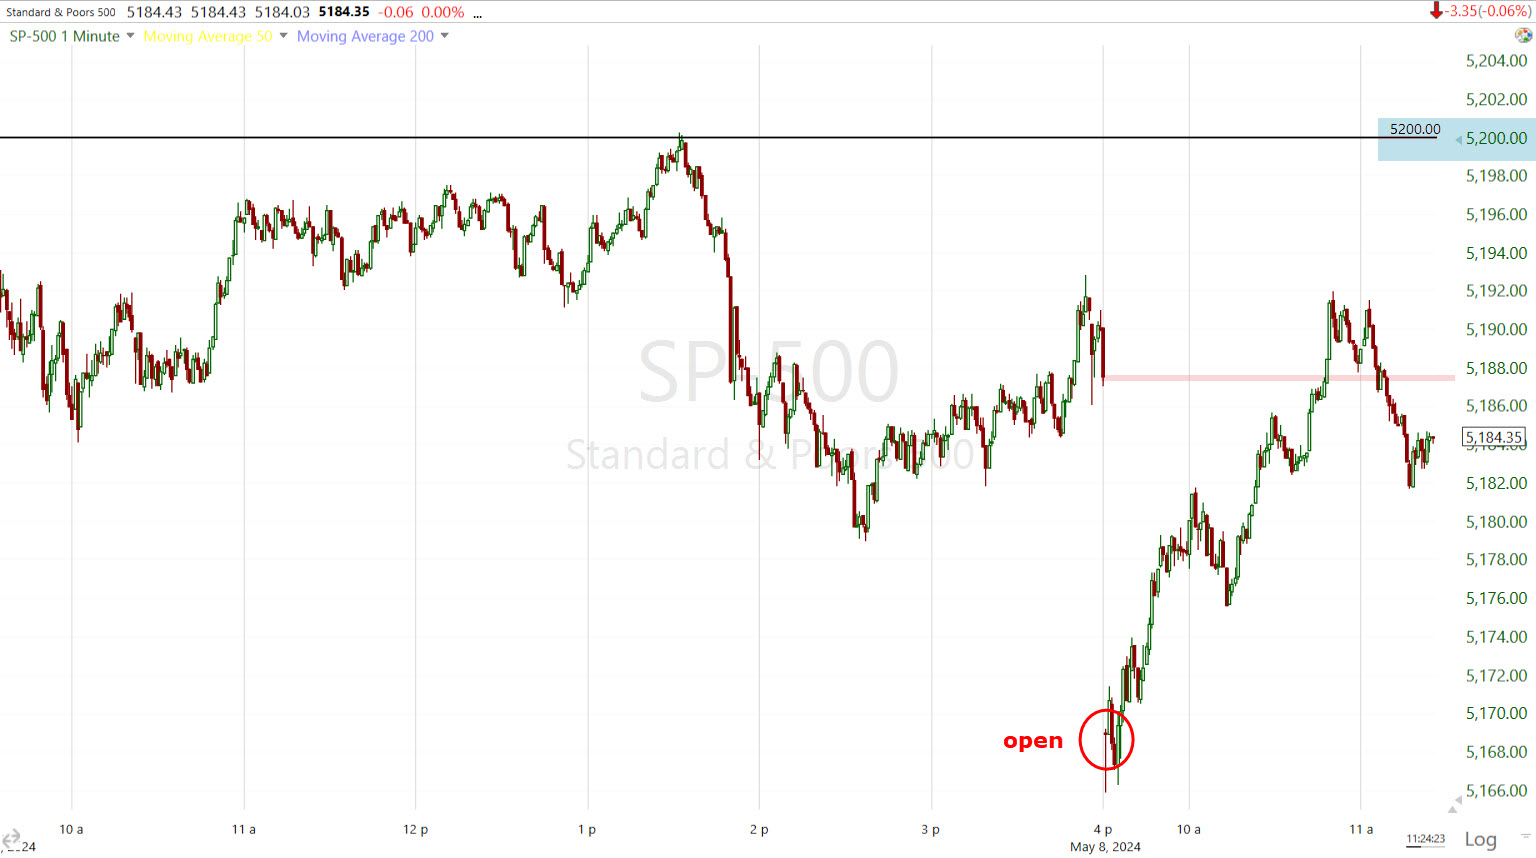
As for 3C charts… I haven’t checked in on the 0-DTE crowd’s activity, but my guess is they faded the gap down this morning, helping the averages rebound off of gap down opening lows. The S&P has retraced and filled the gap.
 SPX (1m)
The S&P’s measured move is between $5200 and $5209. On paper, this week should be hugely bullish for the averages with little tier 1 economic data, the corporate buyback window nearly entirely re-opened, CTA’s doing some re-leveraging of short-term long positions, earnings season having peaked with the exception of Nvidia earnings still several weeks off, and a short-term up trend from April’s lows still intact.
We still have some gaps that are providing initial resistance as is often the case, but likely to be filled.
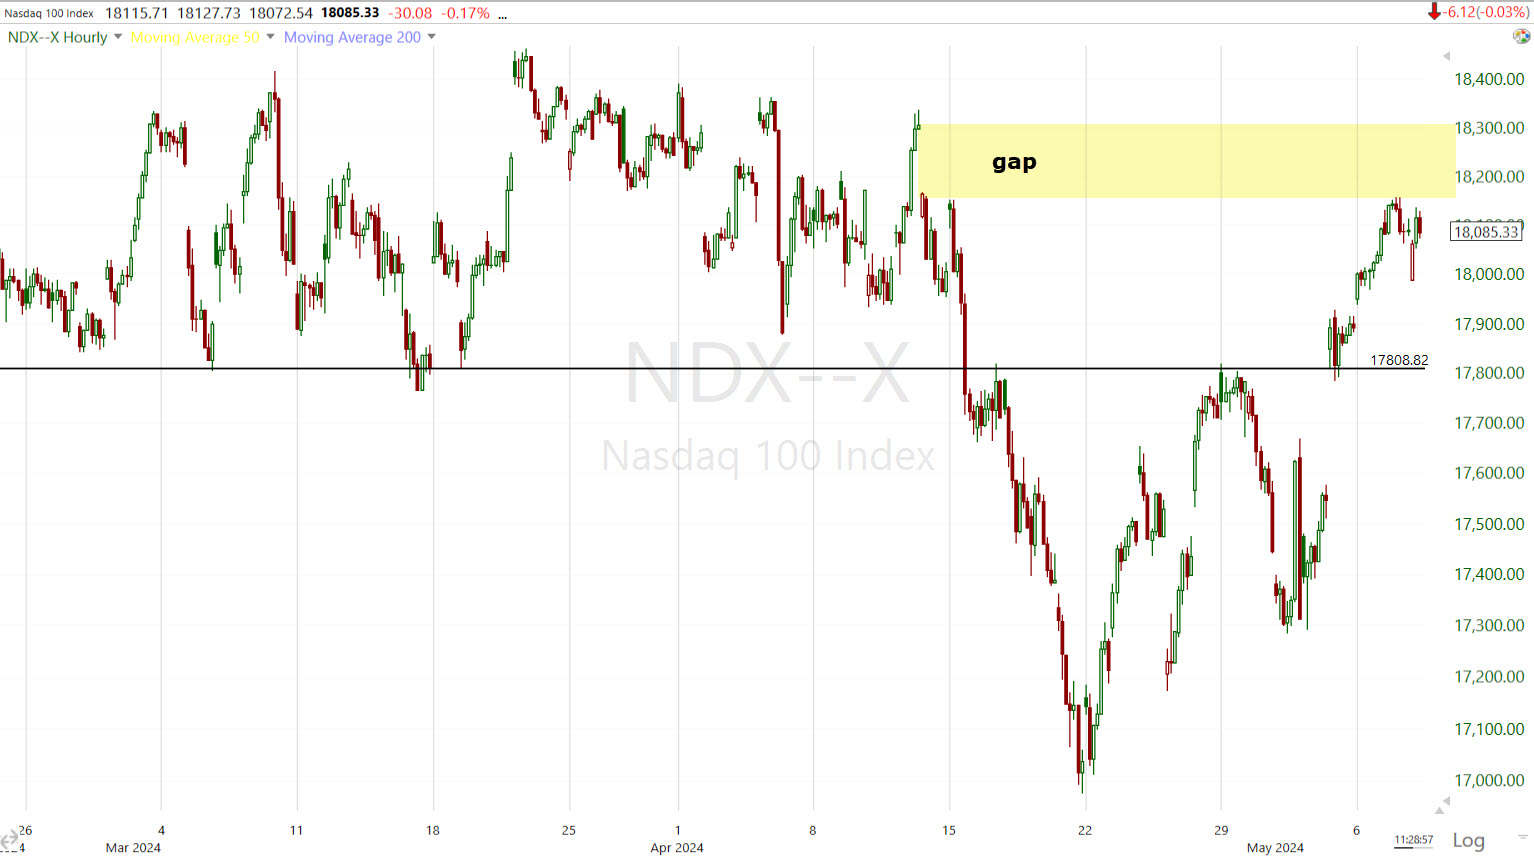
NASDAQ-100 (60m) initial resistance as price challenged the gap yesterday, but probabilities favor the gap being filled.
Other averages have already filled gaps…
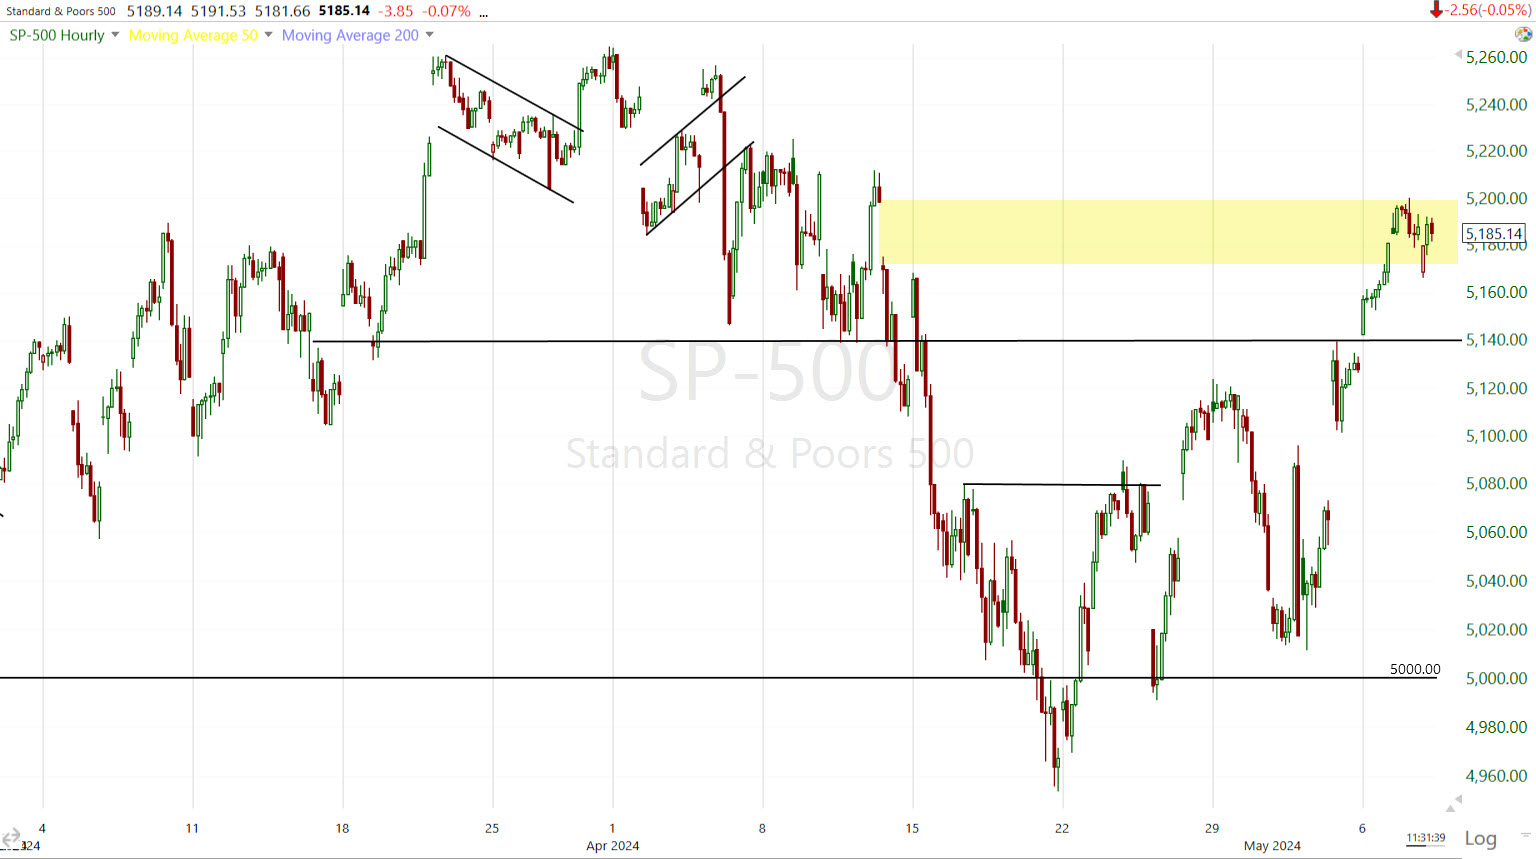 SPX (60m) filled the gap, but also has a measured move as high as $5209.
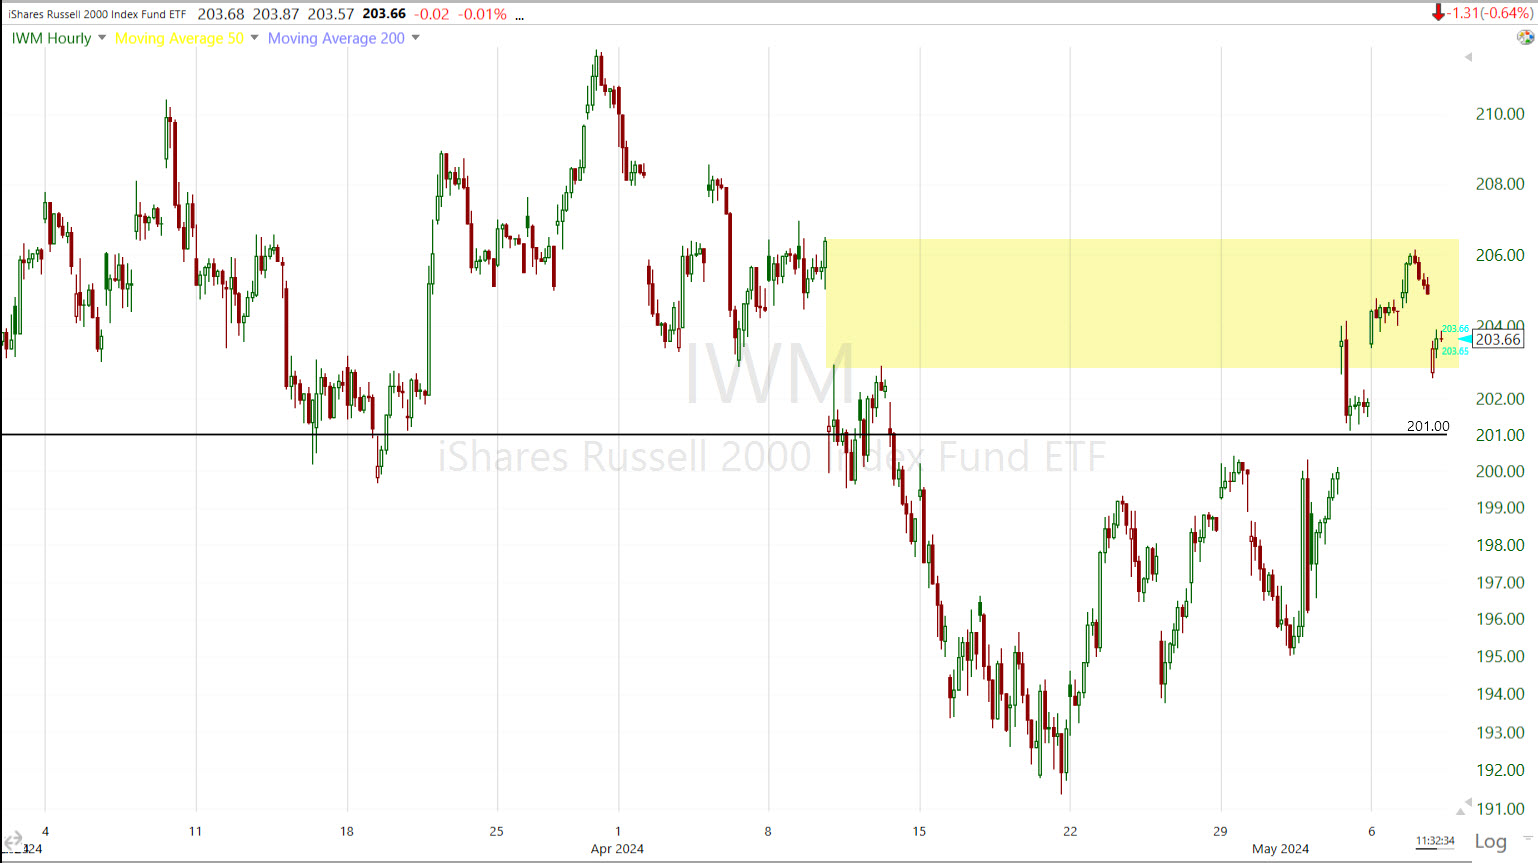 Small Cap IWM (60m) nearly filled the gap yesterday, falling just 0.25% short of filling it. Technically is that enough? Probably, but gaps do have a strong gravitational pull.
What’s much more interesting to me is newly emerging relative strength in VIX to some degree, and more so VVIX which almost always leads VIX’s relative performance pivots. Also, High Yield Credit, that on at least a short-term basis, is showing us why this is one of my favorite market-based leading indicators. HYG led the market higher off April’s lows and confirmed each dip to a higher low in the short-term uptrend all the way up to SPX $5200 this week, but is now starting to diverge amid a fairly neutral rates environment.
And what stands out most is recent 3C charts, that looked good for the oversold bounce, until the fastest to react, most sensitive timeframes indicated underlying selling into price strength which materialized in price yesterday as the SPX tagged the measured move at $5200.
It’s the change in tone, quite obvious on short term charts like these that are most interesting and compelling as to the bounce to a lower high scenario laid out weeks, if not months ago…
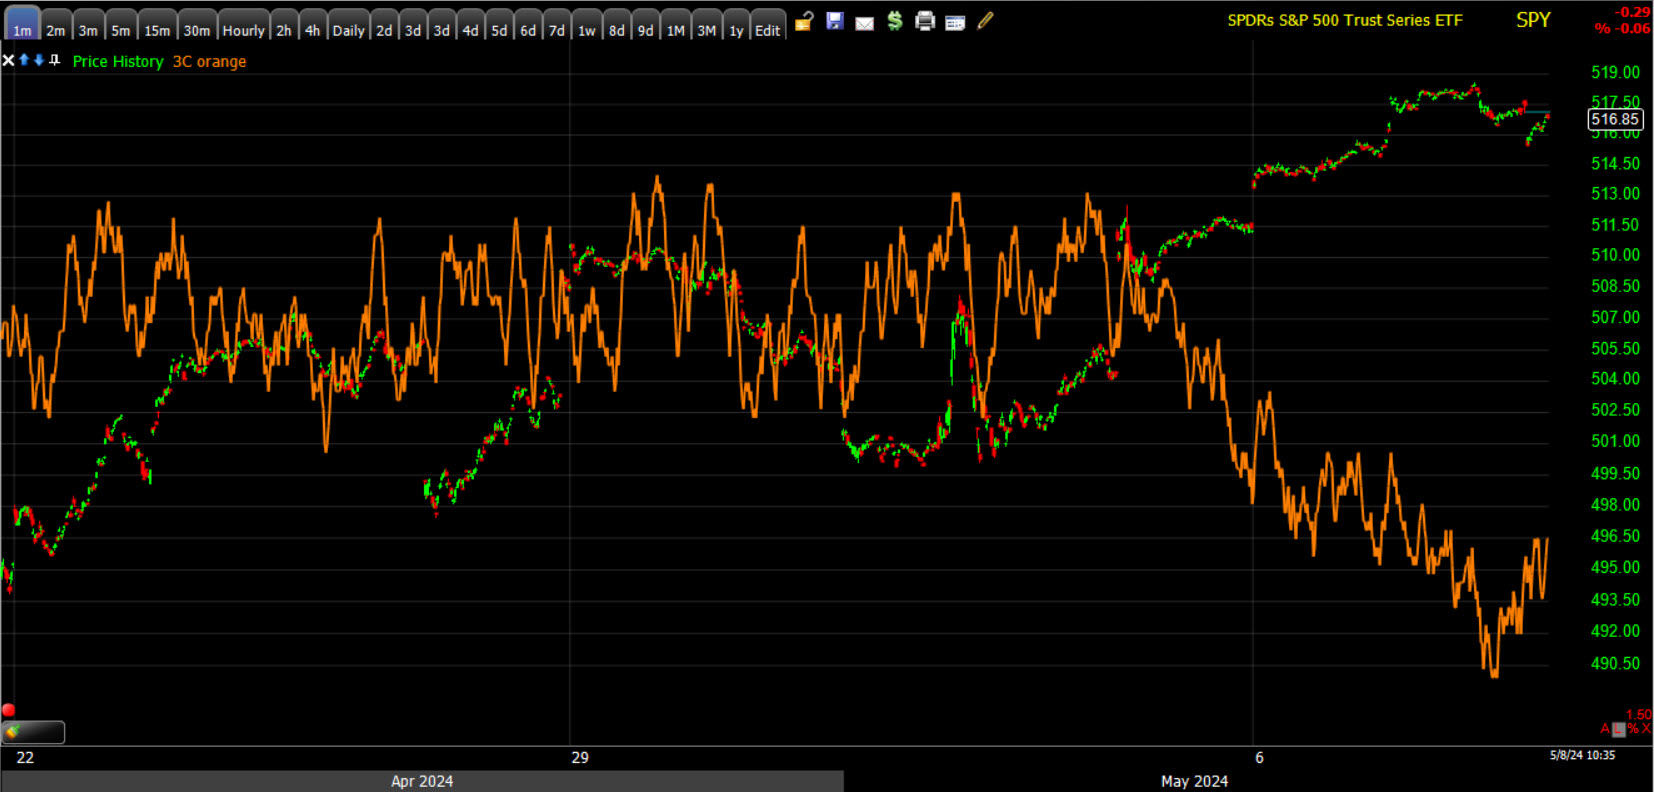 SPY (1m) not confirming S&P’s higher highs since Friday, and moving toward an ugly leading negative divergence.
The stronger this timeframe’s negative divergence becomes, the more probable it is that the divergence migrates to longer/stronger timeframes. The 3-min. 3C chart has been the barometer of the oversold bounce off April lows. It still looks decent enough to say that I don’t think a downside pivot of importance is yet at hand.
 SPY (3m) – with 3C displaying a moderate positive divergence into April 19th’s low (like HYG and volatility’s relative weakness, not to mention pullbacks/corrections in commodities, rates and the Dollar). When this timeframe starts showing a more acute negative divergence, then I think we’re at a downside pivot from an important (at present) lower high.
If that happens to coincide with a clear resumption of uptrends in the U.S. Dollar Index, WTI Crude Oil, and U.S. yields, then it’s all the more convincing.
In the meantime, the details of these short term charts are showing us more of what we’ve already been witnessing and what I’ve been expecting, with distribution in 2024 market leaders- the Tech heavy NASDAQ-100, Mega-caps and Semiconductors – everything the CTA’s were dumping hard in April as these are by far the most crowded long positions, at or near historical record high concentration.
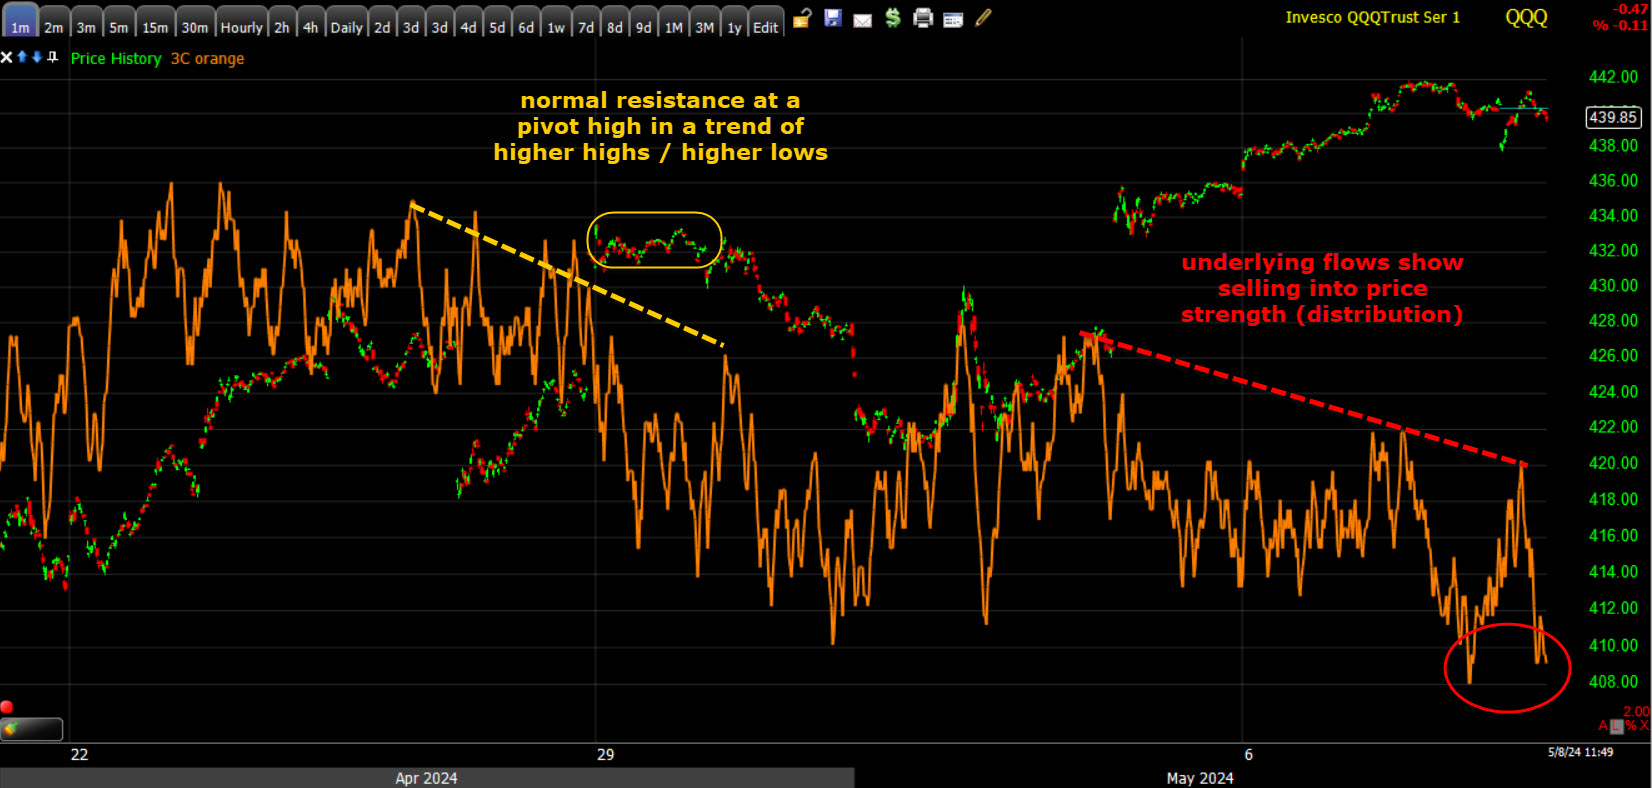 QQQ (1m) – This is where I expected to see the worst 3C signals of distribution… selling into price strength. The right side of the chart (distribution) is very different from the pull back from a pivot high in a short-term uptrend, and the distribution is occurring as measured moves and gap fill targets are being met.
If we compare the 3 min trend timeframes for SPY and QQQ below, further evidence presents itself.
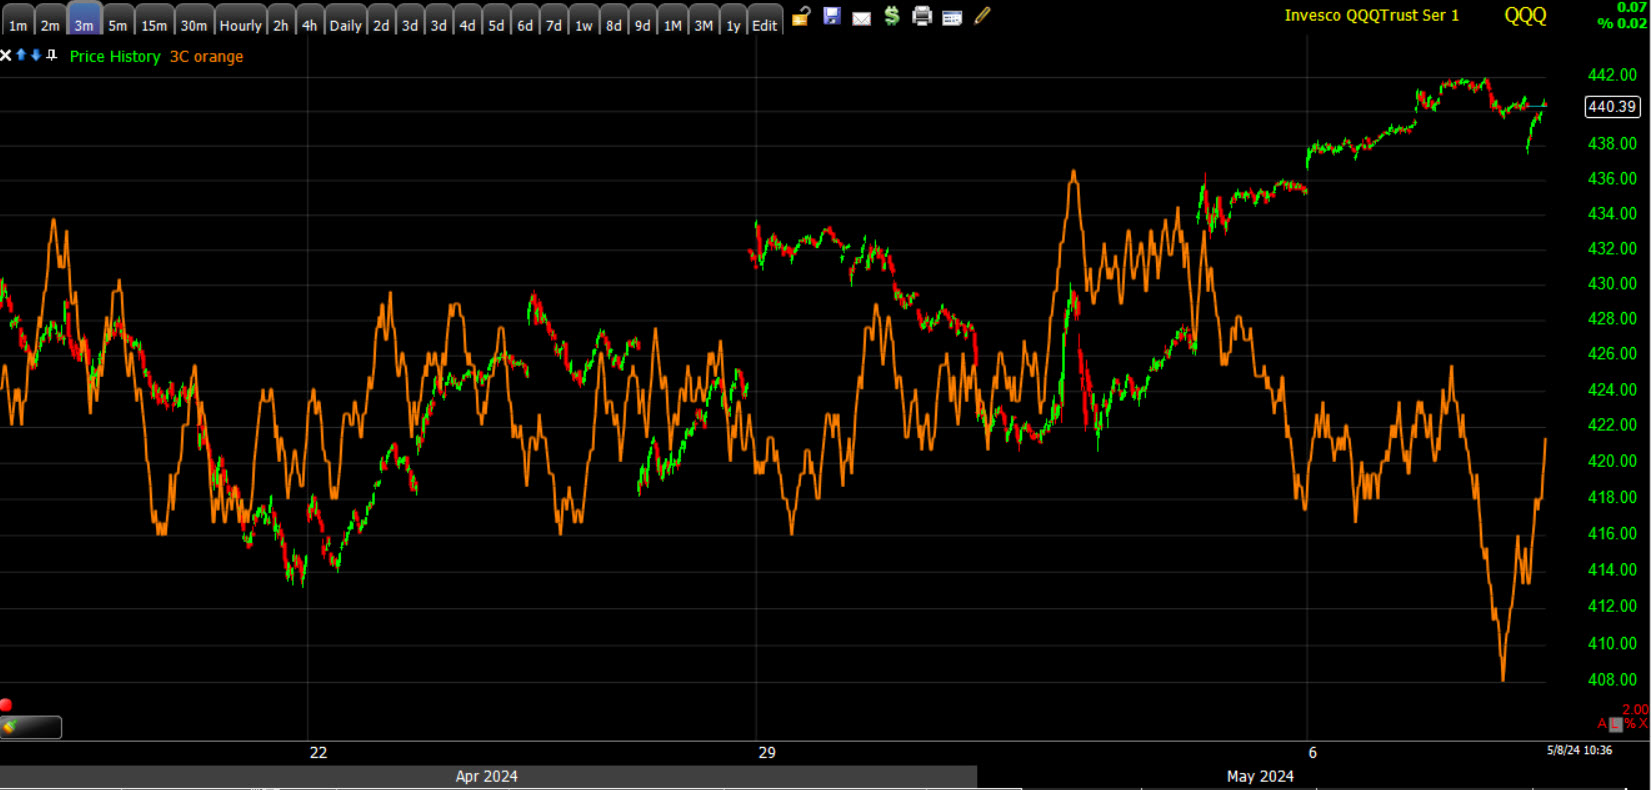
QQQ (3m)- unlike SPY’s 3C chart which says, “probably some more to go on the upside”, or at least that it’s not likely we’re at a downside price pivot yet, QQQ’s is much uglier.
Semiconductors, which had excellent 3C confirmation of the rebound off April’s lows, show the same thing at the same time.
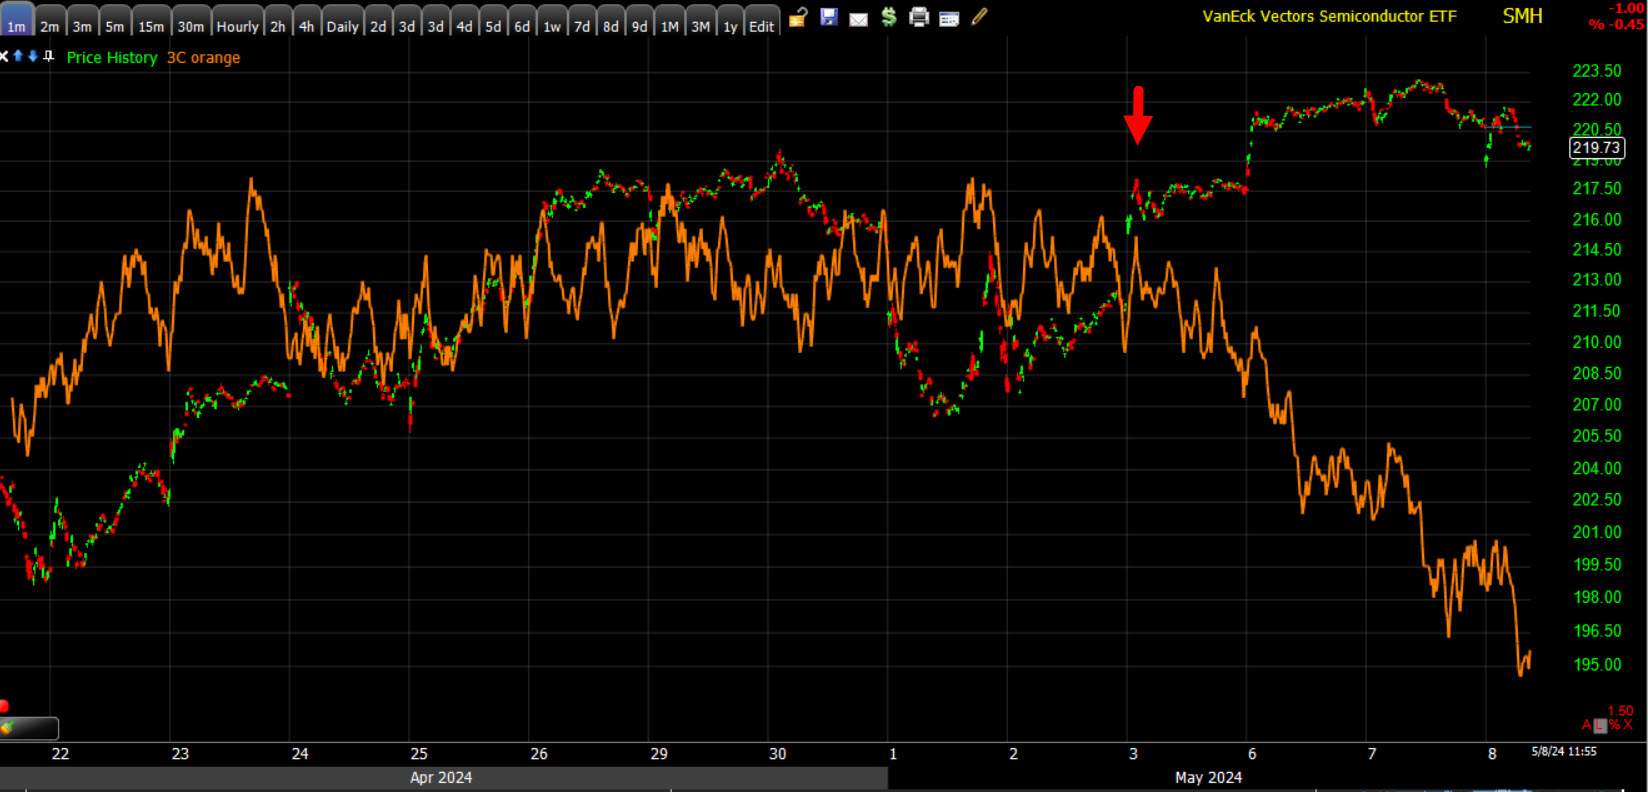 SMH / Semi ETF (1m) going from excellent upside confirmation to a leading negative divergence.
And like QQQ, not just on the shortest, most sensitive timeframes, but also the 3-min timeframe.
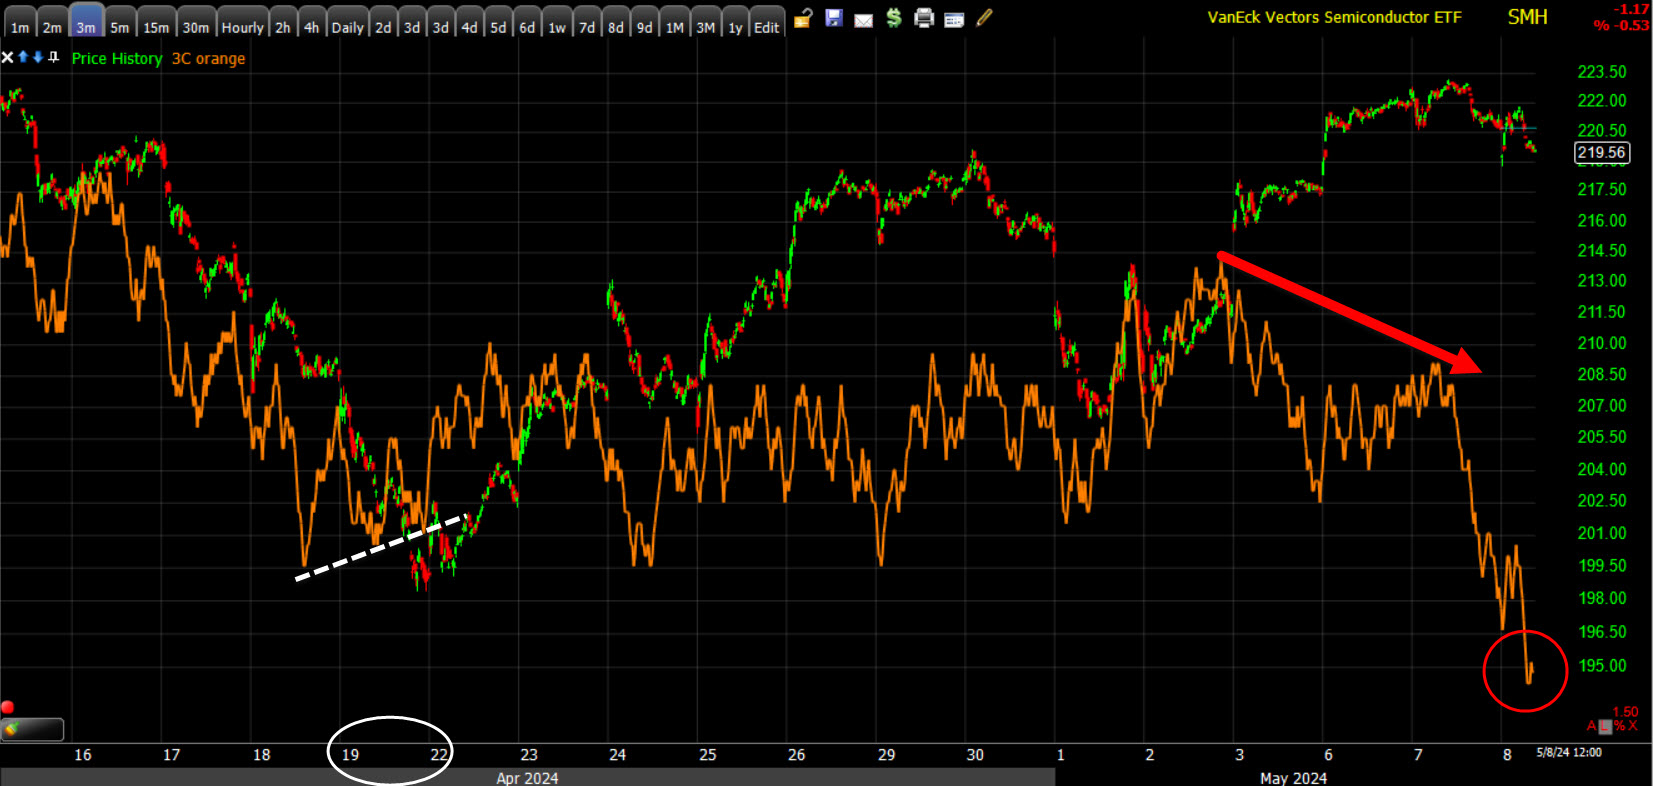 SMH (3m) w/ 3C positively divergent at the April 19th low, but increasingly ugly into May and now leading negatively divergent (the strongest divergence).
As mentioned above, on paper, this should be a very strong week for stocks. However, as far as my forecast of a short-term oversold bounce up to a lower high within the primary trend, and the negative divergences in 2024 market leaders as the December-January best-case Goldilocks scenario evaporates, I couldn’t have written a better script confirming my suspicions.
Once again, with volatility as cheap as it is and risk/reward for the major U.S. averages asymmetrical, this seems like a great time to hedge long portfolio risk. Soon I believe we’ll have the right side of toppy formations locked in, at which point the the last few weeks’ tactical long bias flips. In the meantime I’ll be looking at more charts and looking for data that may contradict this emerging view, or support it. This is where objectivity is more important than ever.