Stocks logged sizable declines and Treasuries settled with sharp losses following a hotter than expected March Consumer Price Index .
A day is not a trend. When dealing with economic data, one month is not a trend. However, I think we’ve seen plenty of evidence which way inflation is currently pointing by looking outside just stocks.
Today’s very hot CPI report is the fourth hotter-than-expected core inflation report in a row. That’s a trend. Every other asset class in the market understands that, except stocks, but they did get a reality check today.
The CPI report fueled worries in equity-land about hawkishness from the FOMC and drove participants to rethink rate cut expectations. You’d think equity market participants would have the motivation to check out that assets that drive inflation as they’ve been climbing, and some soaring this year, but as is almost always the case, the stock market is the last to get the message.
The probability of a rate cut at the June FOMC meeting stands at just 17% now versus 57.4% yesterday and 62.3% a week ago, according to the CME FedWatch Tool. The difference is meaningful as anything over 50% into a Fed meeting is considered a done-deal. To lose that “done deal” edge in a day is significant. This is an equity market that rallied on what it priced in (over aggressively in my view) as 6-7 rate cuts for 2024, but never priced out those rate cuts as they’ve consistently fallen all year since the reflationary bump.
Now market based expectations are for less than 2 cuts at just 38 bps (1.5 rate-cuts) in 2024, which is more hawkish than the Fed’s Dot-Plot of 3 cuts for 2024! Think about that pendulum swing, from stocks overestimating rate cuts and way out of sync with anything the Fed said (pricing in up to 7 cuts) to now being more hawkish than the Fed! And still stocks have not discounted or priced in that reality…yet
Averages
Most of the averages lost around 1%. Small Caps were the worst performing, hit hard by weakness in Regional Banks and Value style factors being sold harder today than Growth. Regional Banks (-5%) were clubbed and they are pretty much synonymous with Small Caps. Dow Transports (-2.3%) were also a major laggard.
S&P-500 ⇩ -0.95 %
NASDAQ ⇩ -0.87 %
DOW JONES ⇩ -1.05 %
RUSSELL 2000 ⇩ -2.58 %
All of the averages, to one degree or another, are making that lateral turn from the November uptrend. You can see each of the averages’ lateral trend emerging toward the bottom of today’s post, Stocks Get A Smack of Reality With Hot CPI.
Here’s a pretty clear SPX change in character…
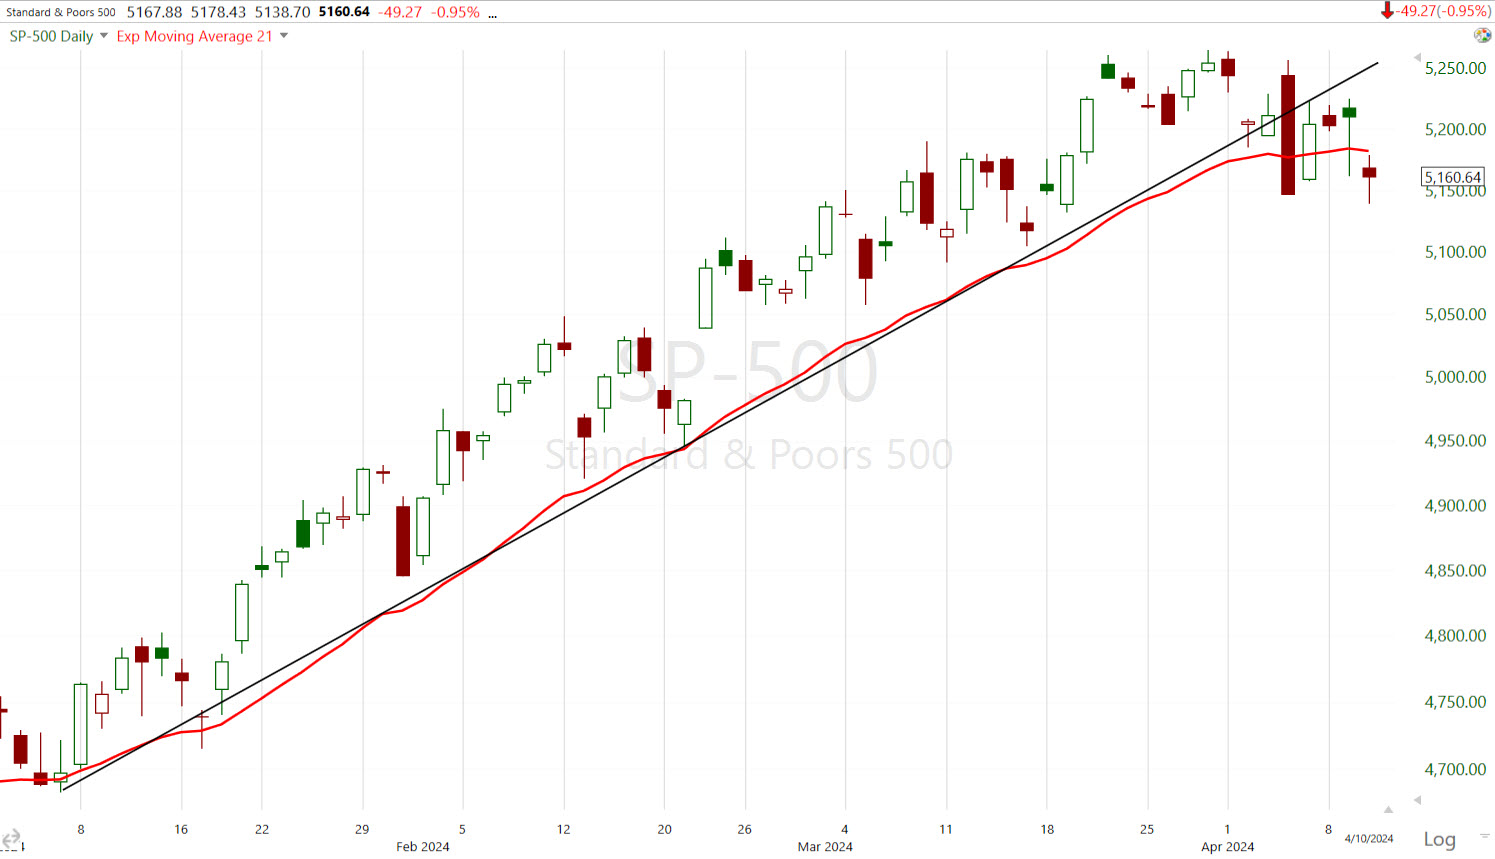 SPX (daily) YTD up-trend broken and the 21 EMA broken (on a close) twice in a week. Before last week, that hadn’t happened once this year.
As the averages make these more lateral price trend turns, the Dow broke below its 50-day SMA for the 2nd (or 3rd) time in a week, which hasn’t happened since the rally began in November.
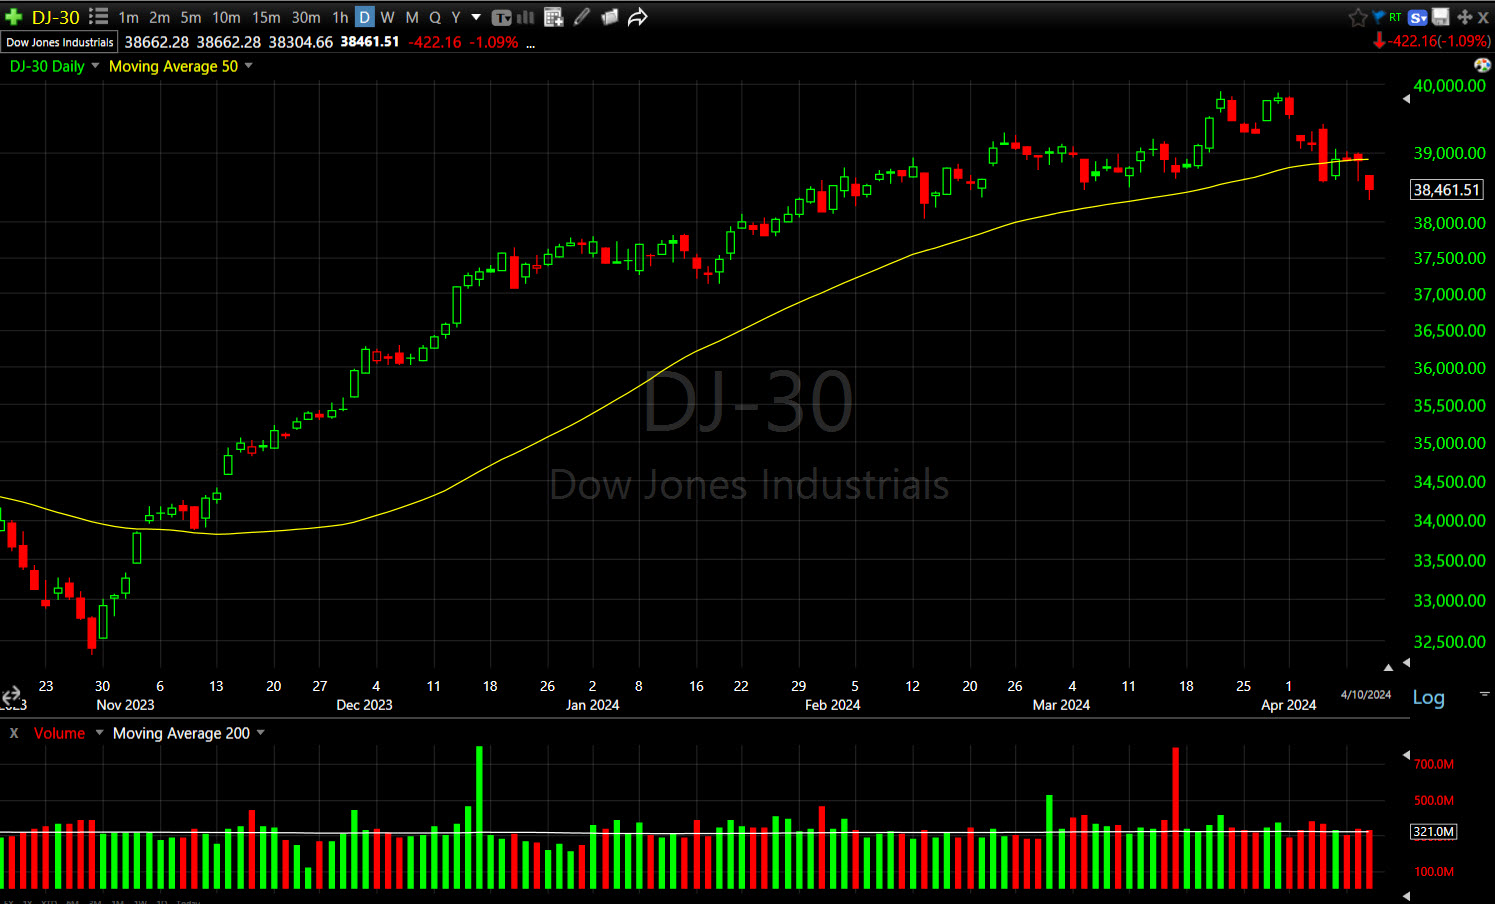 DJIA (daily)
The NASDAQ-100 was the first to make the lateral turn in late February…
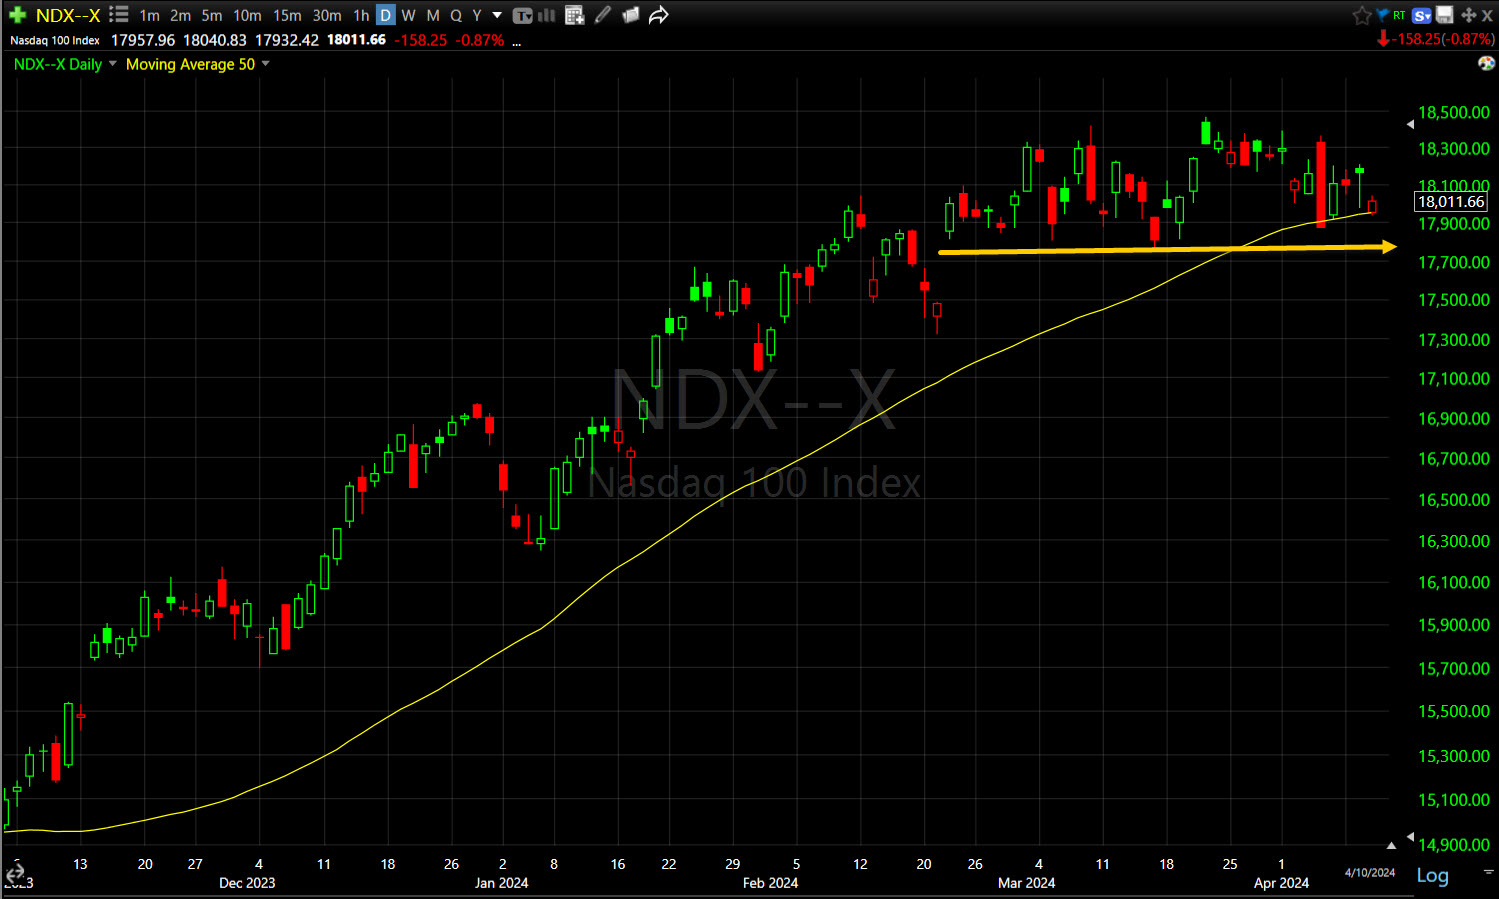 NDX (daily) – but it did not break below the 50-day. The rough intraday support zone of this lateral trend comes in around $17,760 to $17,800 and the 50-day sits at $17,950 (remember it’s an increasingly volatile price range with higher highs and lower lows).
Small Caps broke below their 50-day SMA and closed just below the top of the 2-year range…
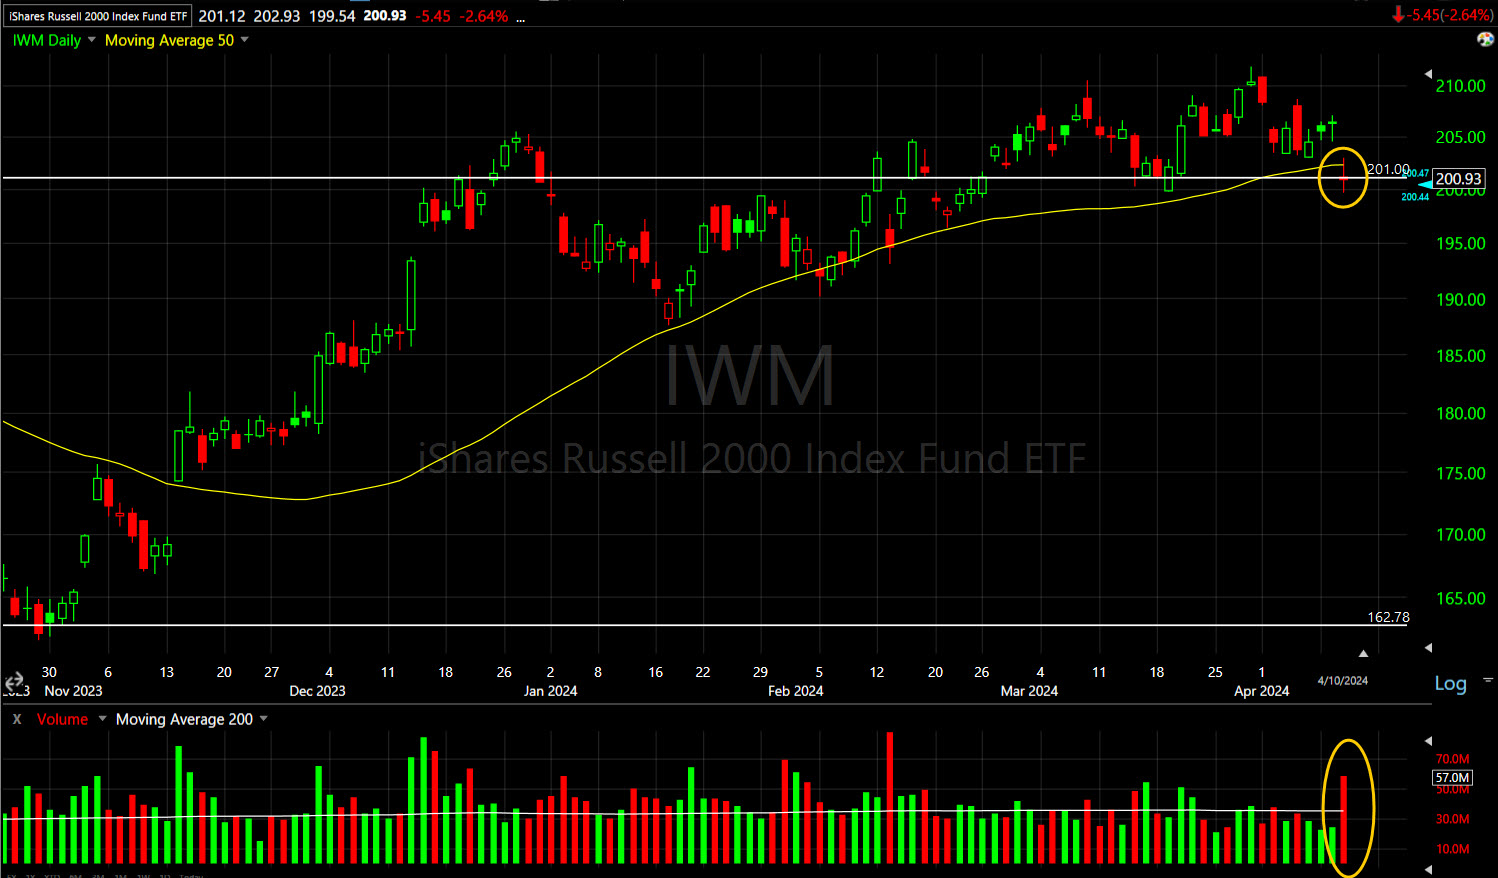 IWM (daily) and on heavy volume.
As you might imagine by looking at Small Caps, my Most Shorted Index was notably lower today, but more interesting is the trend of more resilient short sellers entering the market more cautiously and having more conviction since the first week of March.
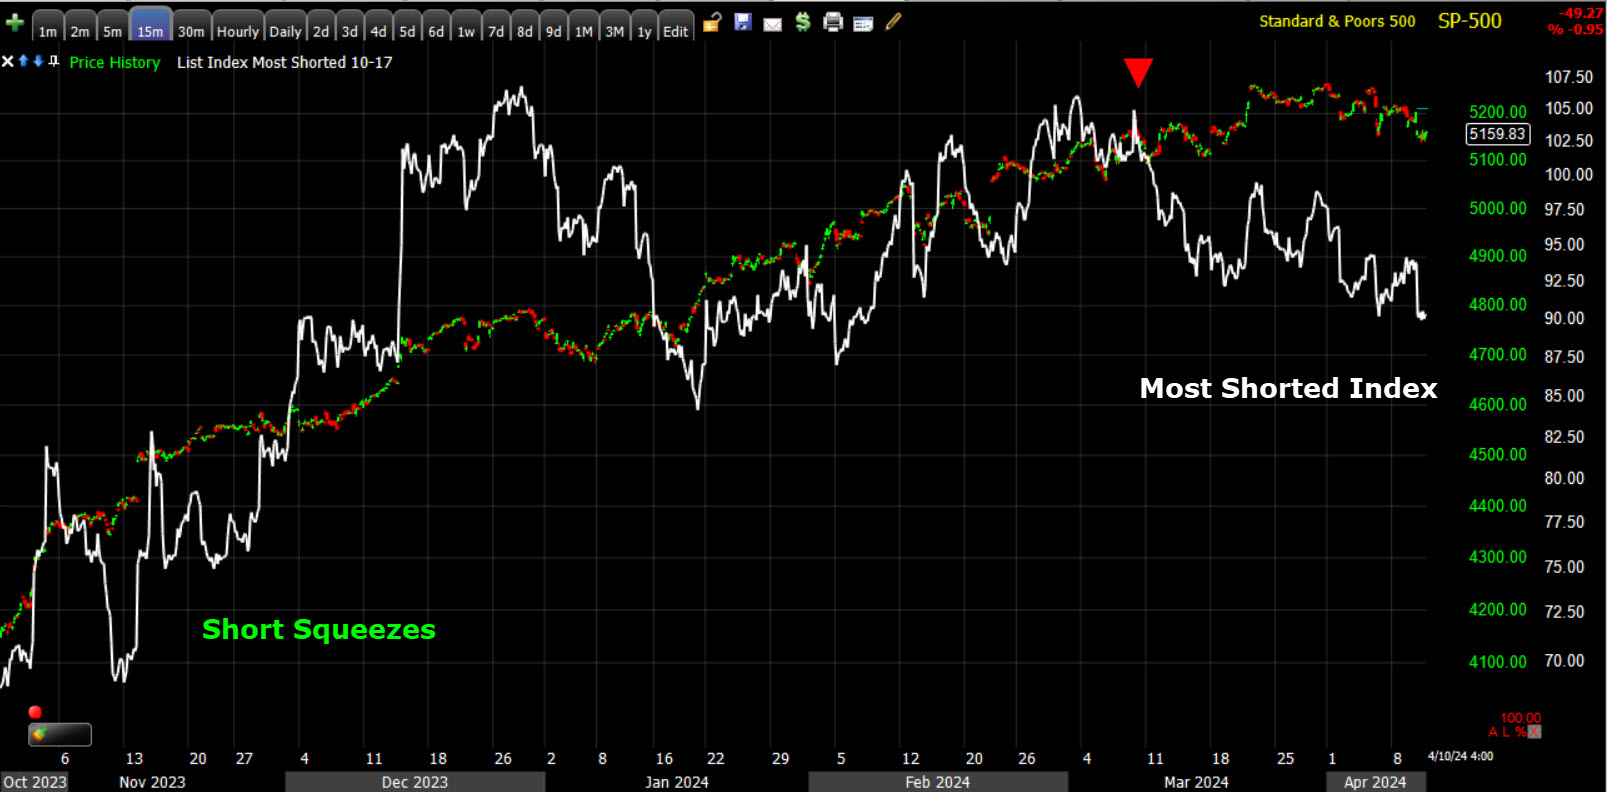 SPX/MSI (15m)
VIX (+5.5%) felt a bit on the relative weak side for the day, likely for the same reason as yesterday. I don’t think investors are feeling anything resembling panic yet with earnings season coming up, and don’t see a major trend reversal (yet). Nor do I… yet, but I think we’re in the process of fleshing out topping patterns. The unusual relative strength trend in VIX all year is still intact.
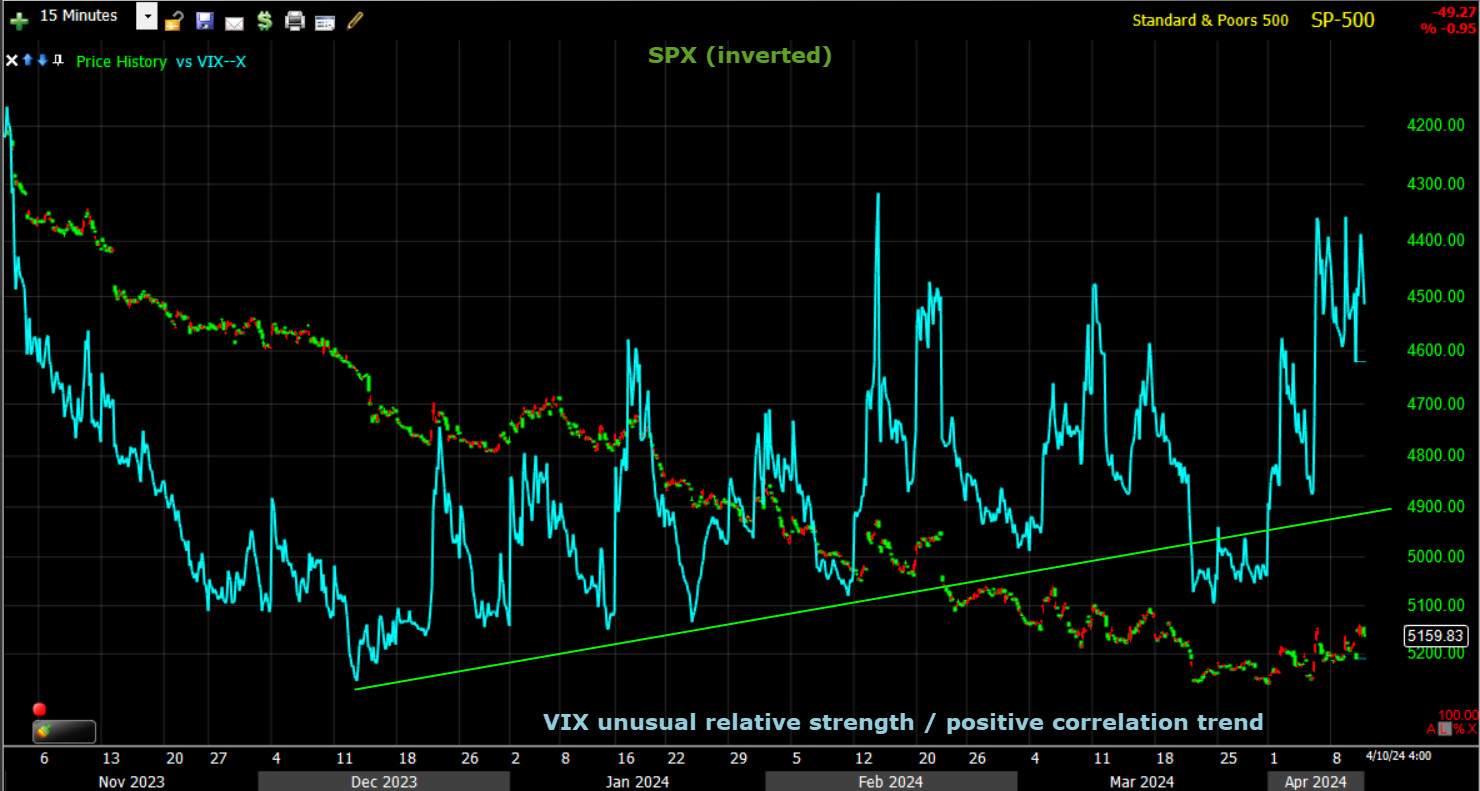 SPX (inverted) and VIX (15m)
VVIX (+8.7%) was a bit stronger implying it’s looking for more volatility ahead, perhaps tomorrow’s PPI print.
The Absolute Breadth Index ended at 95.
S&P sectors
Just about everything in the stock market sold off. Ten of the 11 S&P 500 sectors logged losses ranging from -0.35% to -4.1%. The Energy sector went against the grain and closed higher, related to gains in WTI crude oil futures.
Rate sensitive Real Estate and Utilities were the worst performers, but there was a clear bias toward selling Value style factors (-1.45%) which were down nearly twice as much as Growth style factors (-0.75%). Interestingly, most of the intraday sell programs we’ve seen in recent weeks have targeted Growth stocks (e.g- mega-caps, semis).
Mega-caps (MGK -0.55%) were down much less than the Equal Weight S&P-500 (-1.65%). Some influential stocks acted better and provided some small measure of support, such as Meta Platforms (META +0.6%), Amazon.com (AMZN +0.2%), NVIDIA (NVDA +2.0%), and Eli Lilly (LLY +0.6%).
Most sectors came down on heavier volume, but a few were noticeably heavy including: Industrials, Financials, Health Care and Real Estate. One thing they share broadly is that they’re mostly dominated with Value stocks. Conversely, Energy which is value heavy sector and the only sector to close higher, did so on a pick-up in volume which is constructive.
Materials ⇩ -1.56 %
Energy ⇧ 0.31 %
Financials ⇩ -1.49 %
Industrial ⇩ -0.85 %
Technology ⇩ -1.23 %
Consumer Staples ⇩ -0.36 %
Utilities ⇩ -1.71 %
Health Care ⇩ -1.17 %
Consumer Discretionary ⇩ -1.54 %
Real Estate ⇩ -4.11 %
Communications ⇩ -0.79 %
Homebuilders (-3.7%) had their worst day since October.
Regional Banks — I just featured in a large bear flag again yesterday — were ugly with the KBW Bank Index -3% and Regional Banks -5% just days ahead of the banks kicking off earnings season.
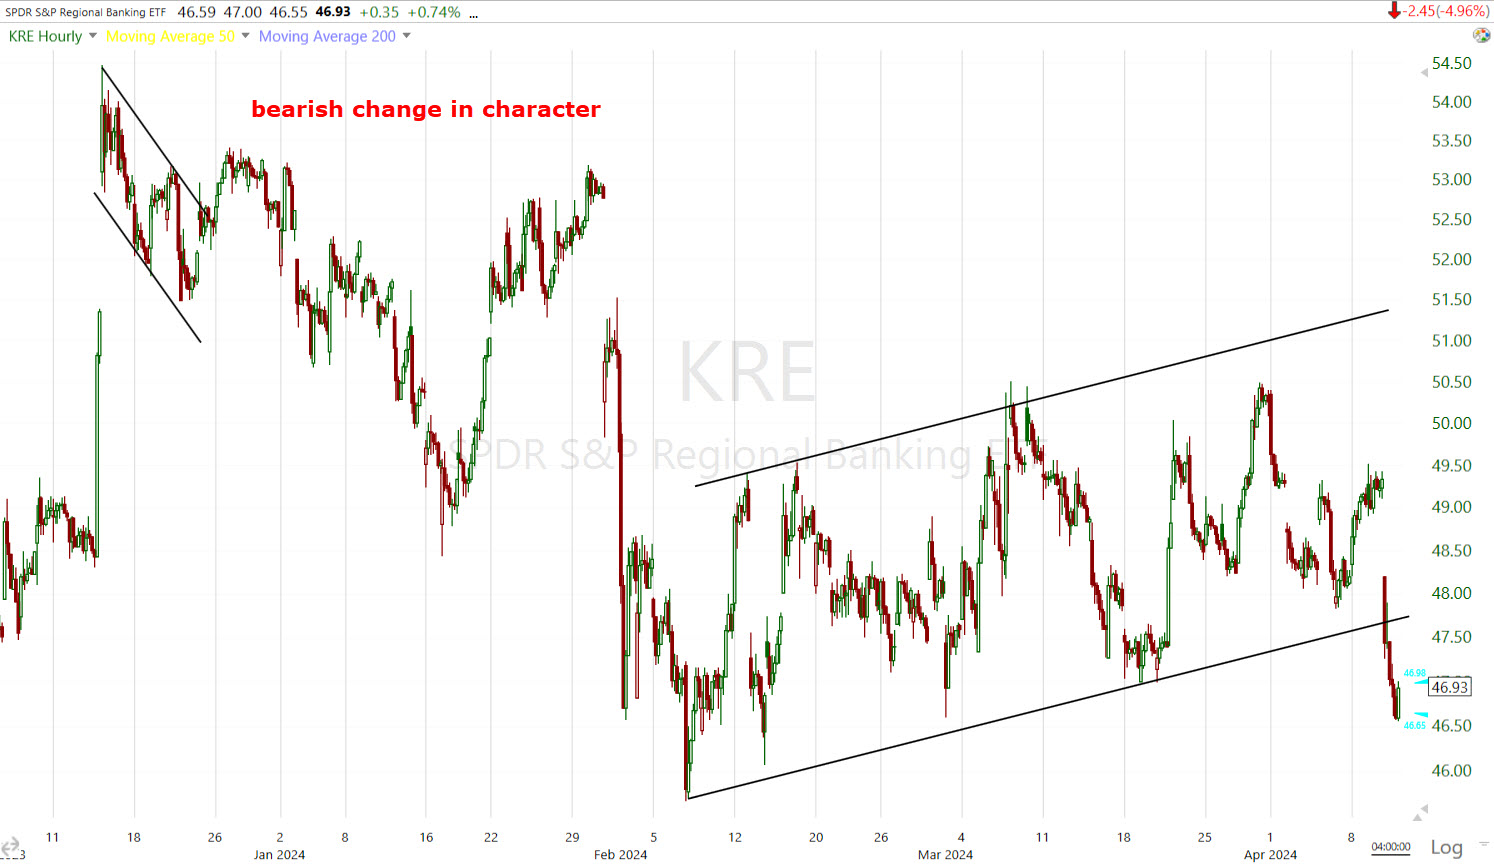
Regional Banks (60m) broke the large bear flag today on a notable pick-up in volume. As mentioned earlier, I think there’s a good chance that this former support trend line of the flag gets back-tested, which means a higher probability short at a better price since the flag has already broken, and a back-test p toward $48 gives you an opportunity to get short with the full measured move potential downside.
The defensive rotation, which was never going to support the major averages anyway, is faltering as most of the defensive sectors are also rate sensitive and the current reflation is problematic for them.
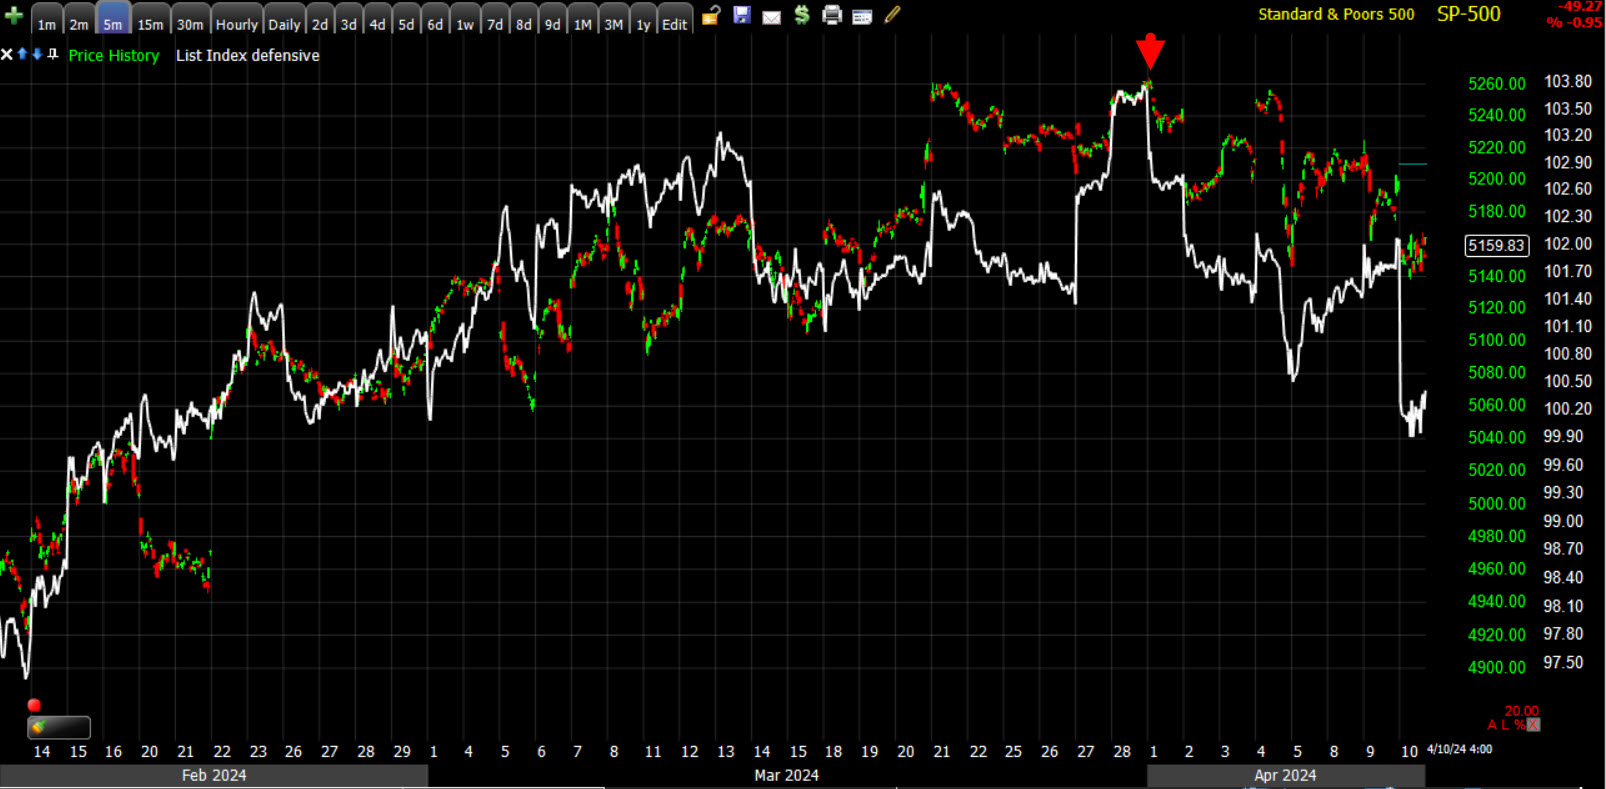 SPX (5m) and Equal Weight List Index of Defensive sectors (white) feeling the hard to ignore move higher in rates.
I just featured Boeing (BA -2%) last night with two zones of support about to be tested. BA broke below both of them today and completely retraced all gains from the November rally.
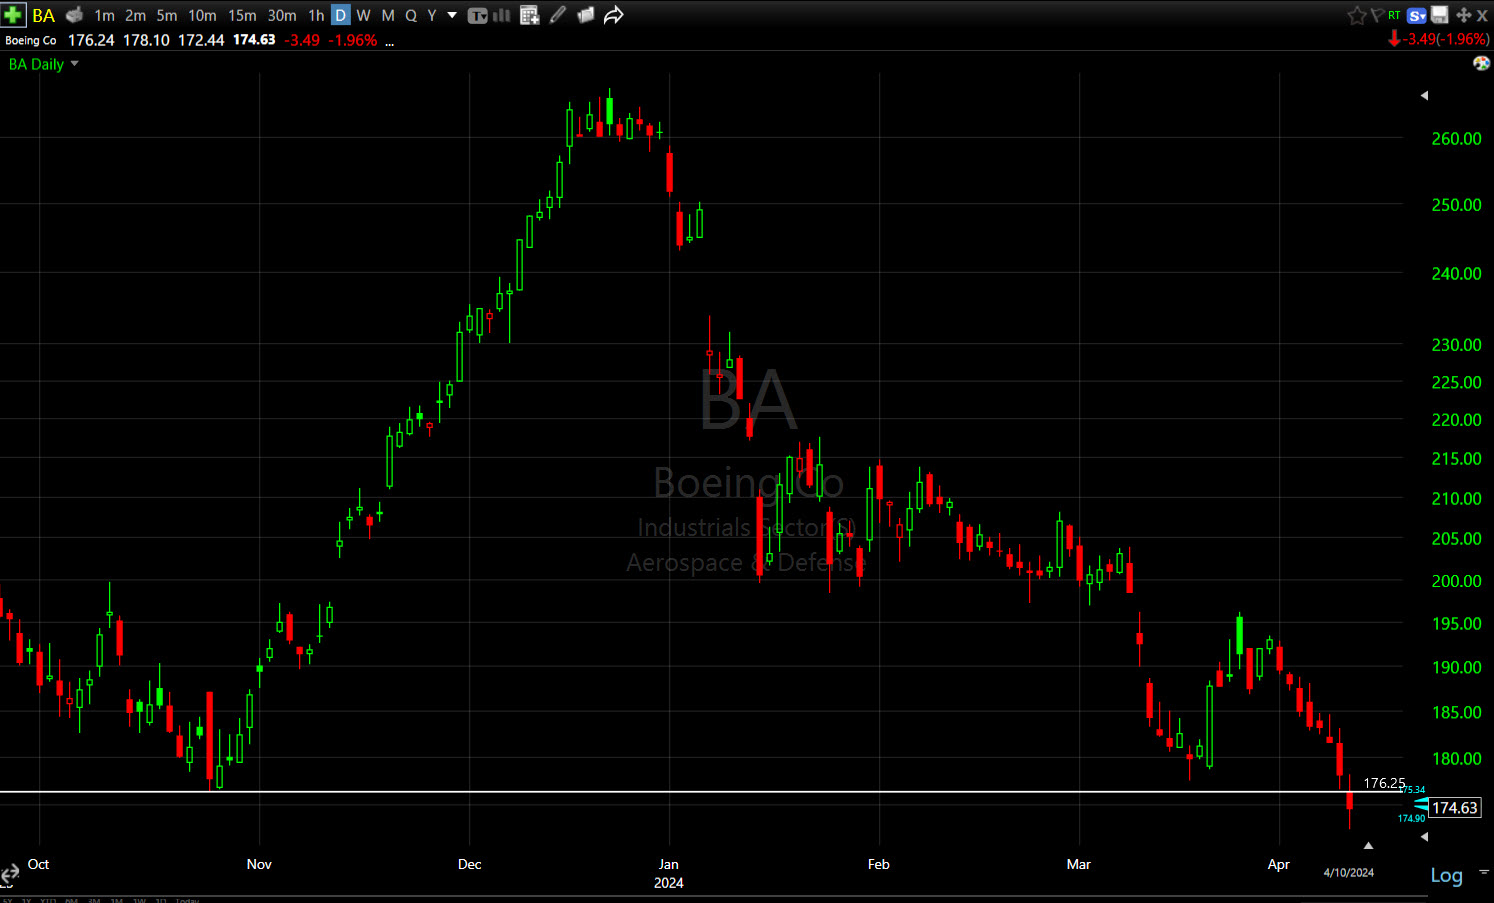 BA (daily) – This isn’t what I’d call a definitive break, but I think Boeing is worth putting on a watchlist as a short sale candidate. Often price will briefly climb back above support and stop out new shorts. If so, we’ll watch how it acts there. Say there’s something like a bear flag around the trend line – that would make BA a more attractive short, but the primary consideration is to go with the flow of the broader market. When the broader market turns lower, stocks like Boeing will be easy picking low hanging fruit.
The Energy sector looks like it might be consolidating and if Crude oil continues to do the same, it should too. This may give you an opportunity to get long some reflationary themed sectors like Energy and Materials (see last night’s Daily Wrap for even more reflationary themed ideas in commodities).
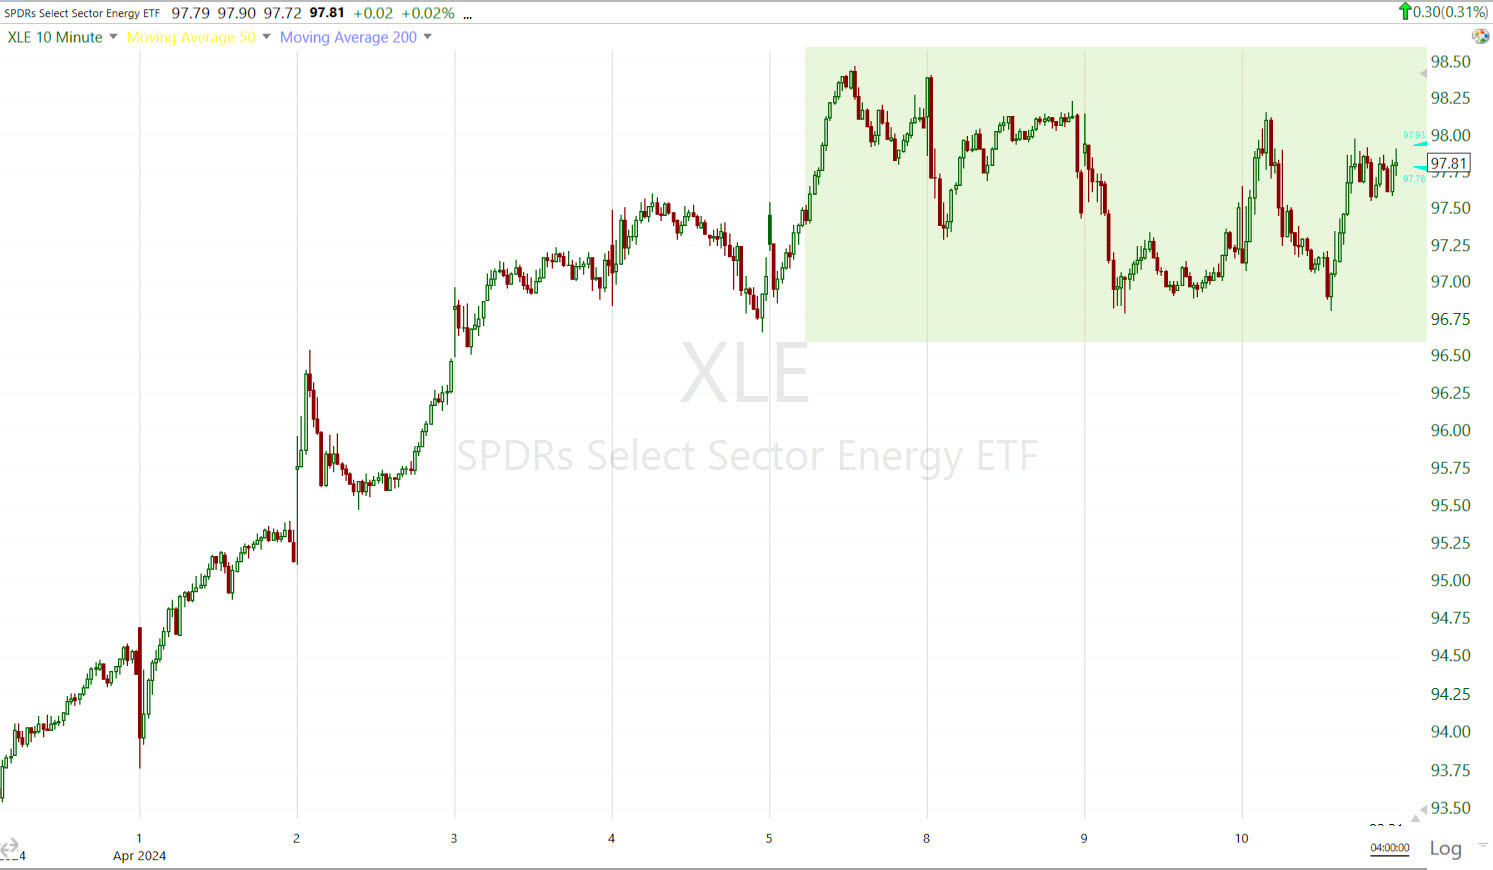
Energy sector (10m) appears to be entering a bullish consolidation phase.
Internals
Selling was broad-based with NYSE Decliners (2352) outpacing Advancers (415) by better than a 5-to-1 margin. Volume was heavier at 930 mln shares, but not huge.
The Dominant price/volume relationship was very strong at Close Down/Volume Up, which rounds out the 3 necessary conditions for 1-day oversold internals.
That’s to say nothing of breadth oscillators going from sharply overbought yesterday (94) to deeply short-term oversold today (20)
Briefly touching on the earnings season stats from last night’s Daily Wrap,
“The bar for the top 10 stocks is quite high. 2024 bottom up consensus EPS revisions are +18% for the top 10 S&P stocks, but -6% for the other 490 companies”
This could be a big problem in earnings season as the “average” stock is not doing anywhere near as well, which doesn’t leave much support should the top-10 leadership stocks not meet lofty earnings expectations.
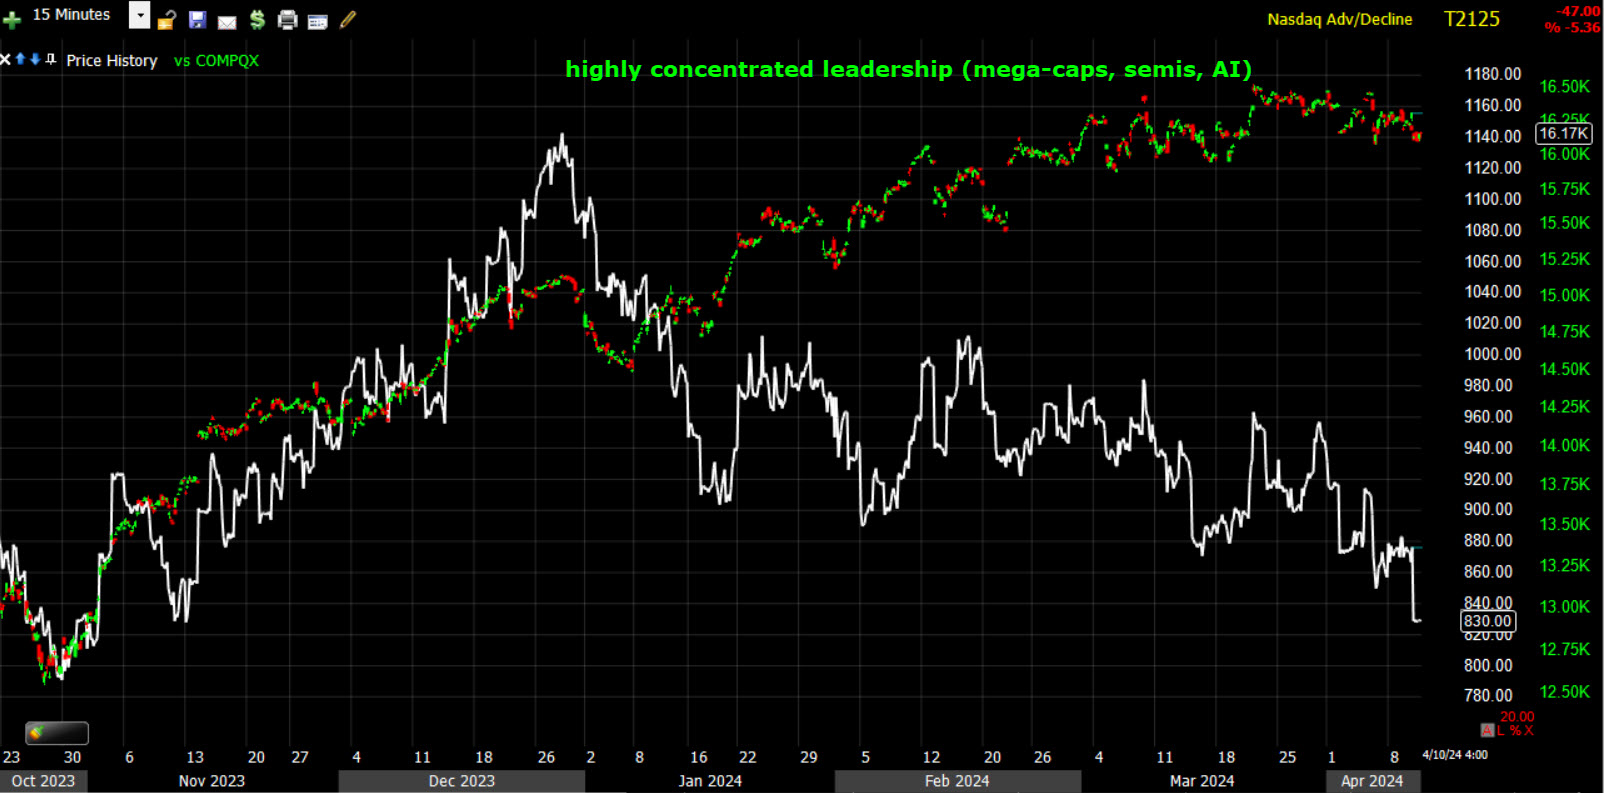
NASDAQ Composite (15m) and it’s A/D line that’s been falling apart since heading into 2024’s new year. The A/D line has almost completely retraced the entire rally off late October lows.
Treasuries
Treasuries settled with sharp losses in response to the March CPI report. The 2-yr yield jumped 22 basis points to 4.97%, within a tick of 5.00% today for the first time since mid-November.
The 10-yr yield climbed 19 basis points to 4.56% making today the biggest jump since September 2022.
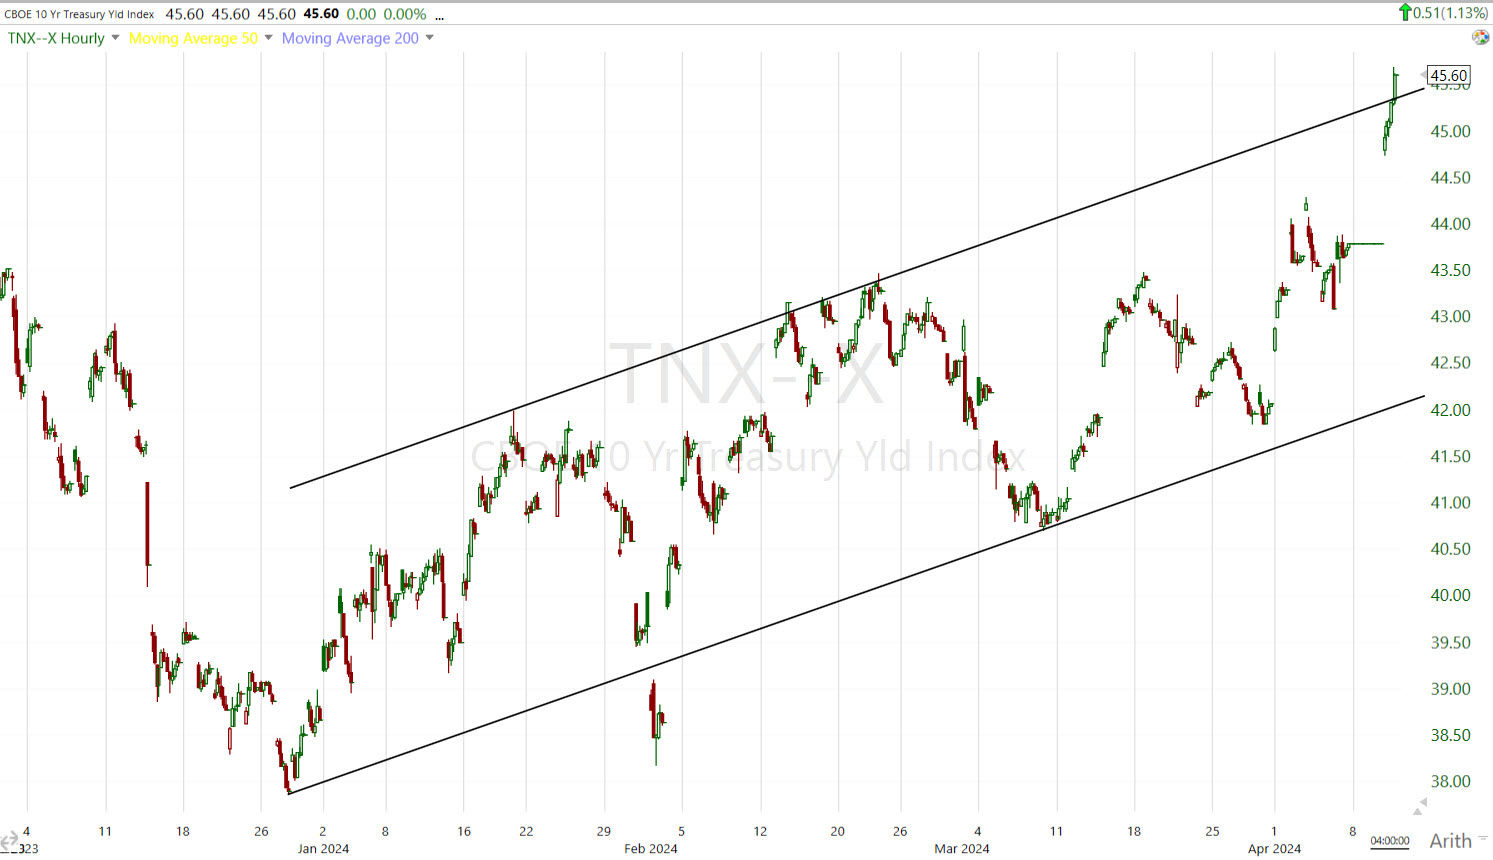
10-yr yield’s (60m) YTD up-trend channel. Remember the food inflation aspect of last night’s Daily Wrap,
“From the St. Louis Fed’s analysis from 2001…
“We see that past inflation in food prices has been a better forecaster of future inflation than has the popular core measure [CPI and PCE]…Comparing the past year’s inflation in food prices to the prices of other components that comprise the PCEPI (as in Table 1), we find that the food component still ranks the best among them all…” – Source: St Louis Fed
And what drives food prices? Agricultural commodities, that just started going parabolic (see DBA above) in Q1 2024.”
If the Fed is right, then recall the Agricultural Commodities price chart from last night going parabolic…
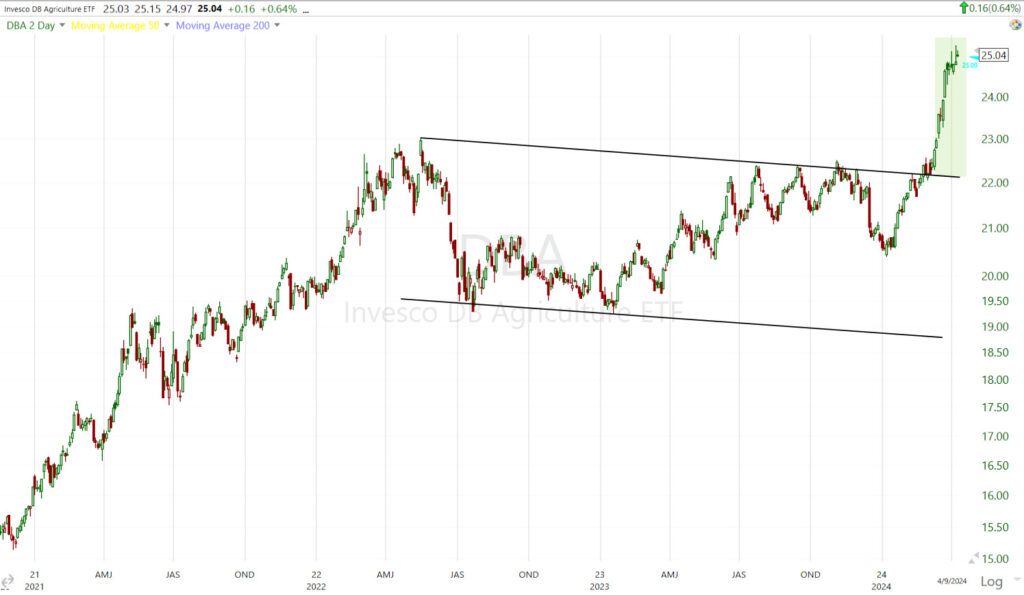
DBA (2d) with price going parabolic in Q1 2024. That doesn’t bode well for a slow down or end to Q1’s reflation.
Goldman Sach’s macro guru said this a few days ago: “…a move towards 4.80%[10yr] is where things would get tricky for stocks.”
I think any move higher in yields here gets increasingly tricky for stocks, but let’s go with the macro guru. Just look at the catch-up the 10-yr yield is doing with oil prices. Based on where oil prices sit now (assuming they don’t gain more), it’s very reasonable to expect the 10-yr yield to trade above 4.80%.
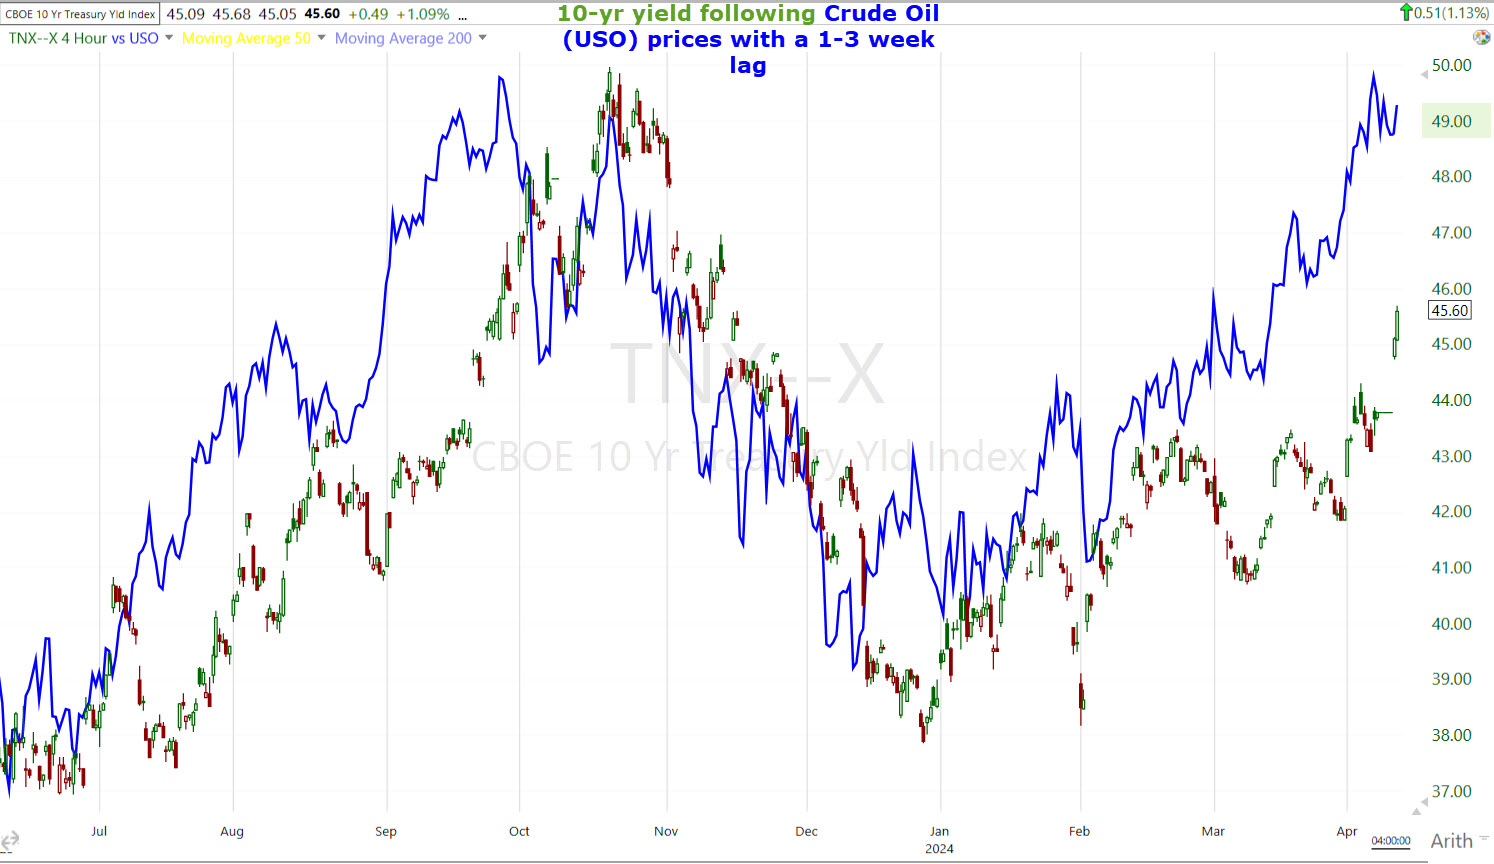 Based on what oil has already done, the 10-yr should have no problem hitting 4.90% over the next couple of weeks, and that’s assuming oil doesn’t add more gains in the interim.
Not surprisingly, HY Credit (HYG -0.9%) was relatively weak, which just extends the negatively divergent trend with the S&P that’s persisted all year. This is definitely one of the larger divergences between the two.
Currencies and Commodities
The U.S. Dollar Index jumped +1% to $105.16 on the hot CPI, and that’s a huge move for the dollar. The Dollar made new YTD highs with yields, and the highest since mid-November.
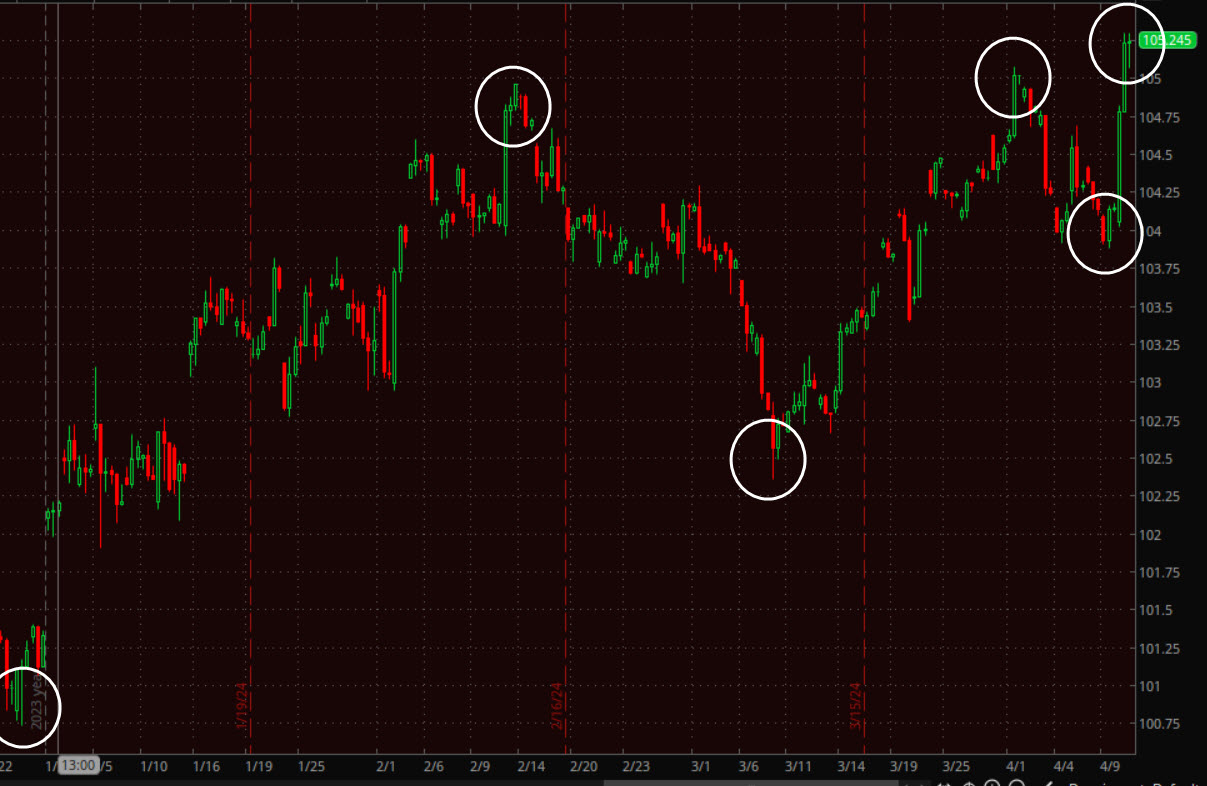 U.S. Dollar Index (2H) 2024 up trend. The rule of thumb since April 2020 has been a higher dollar puts downward pressure on stocks, and a lower dollar (such as November-December) is turbo fuel for stocks to rally. The Dollar’s trend is not headed in a helpful direction for stocks, and as shown last night, it is tracking the reflationary impulse with Treasury yields.
WTI crude oil futures gained +1.2% to $86.26/bbl. There was a minor decline on CPI as the dollar surged and oil is a dollar denominated asset, but it really didn’t act bad considering the jump in the dollar, and certainly considering it’s bullish trend. This afternoon there were reports that the US intelligence sees a “High-Precision Missile” strike on Israel by Iran as “Imminent”, and that sent crude higher on geopolitical risk.
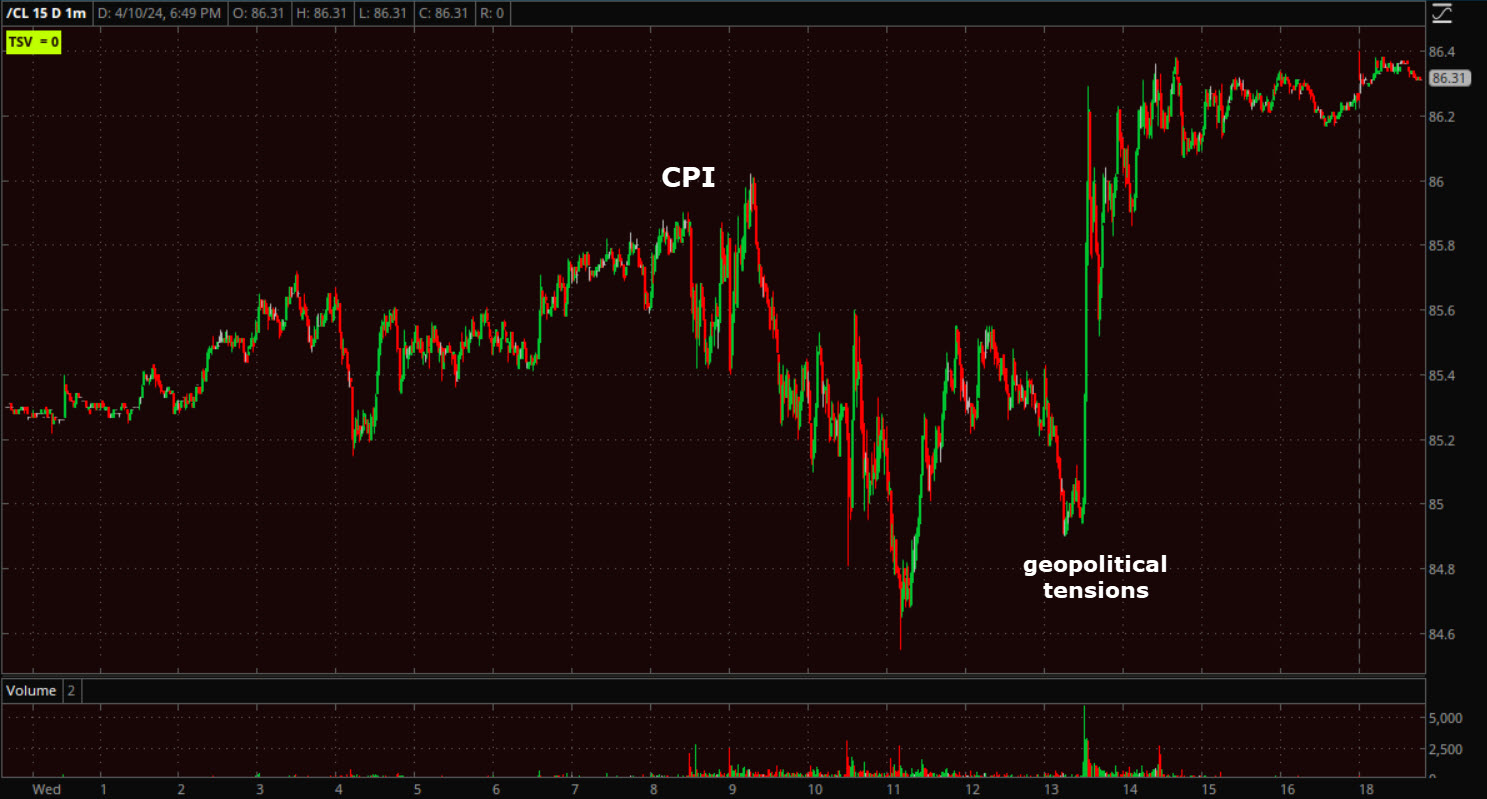 WTI Crude Oil (1m)
Price is consolidating bullishly just off 5.5 month highs…
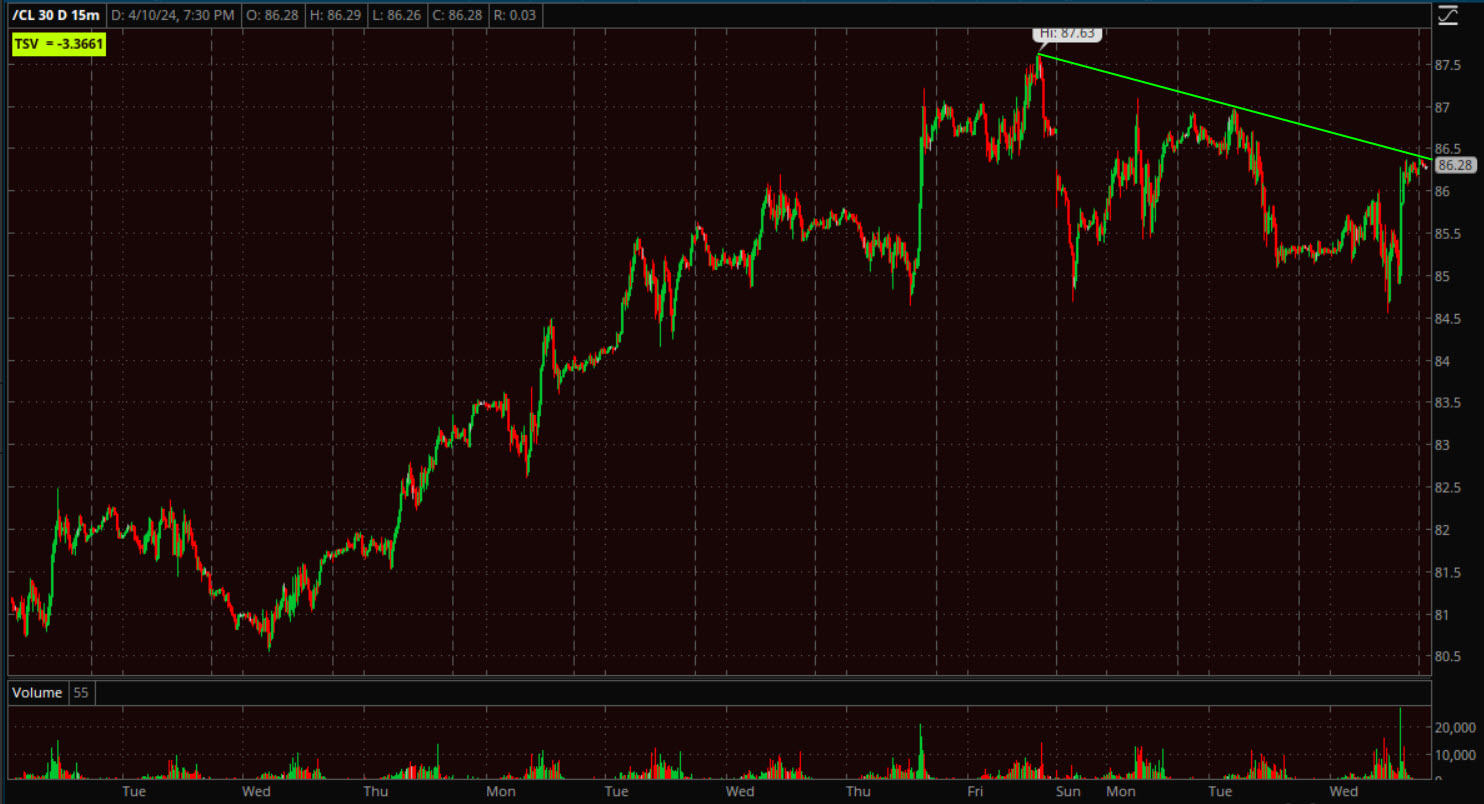 WTI Crude (15m) – Volume could be a little better for such a consolidation, but given the price trend and price consolidation, it’s nothing I’m remotely concerned about.
I mentioned URA (+1%) earlier today as looking like it may be getting ready to break out of a bullish consolidation.
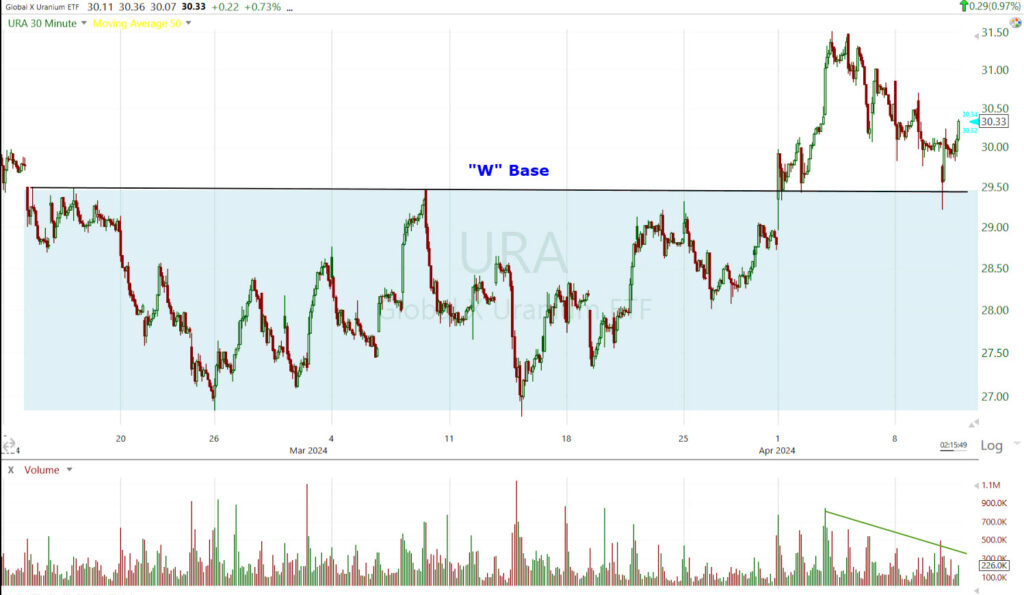
URA (30m) – Price action has improved. Since breaking out of a “W” base, price bullishly consolidated into a test of the “W” base’s top and held. Volume has been declining during this smaller consolidation. I think it’s likely URA is getting ready to breakout to the upside.
Gold futures settled lower by -0.6% to $2,348.40/oz, pressured by a much stronger greenback and yields as CPI hit.
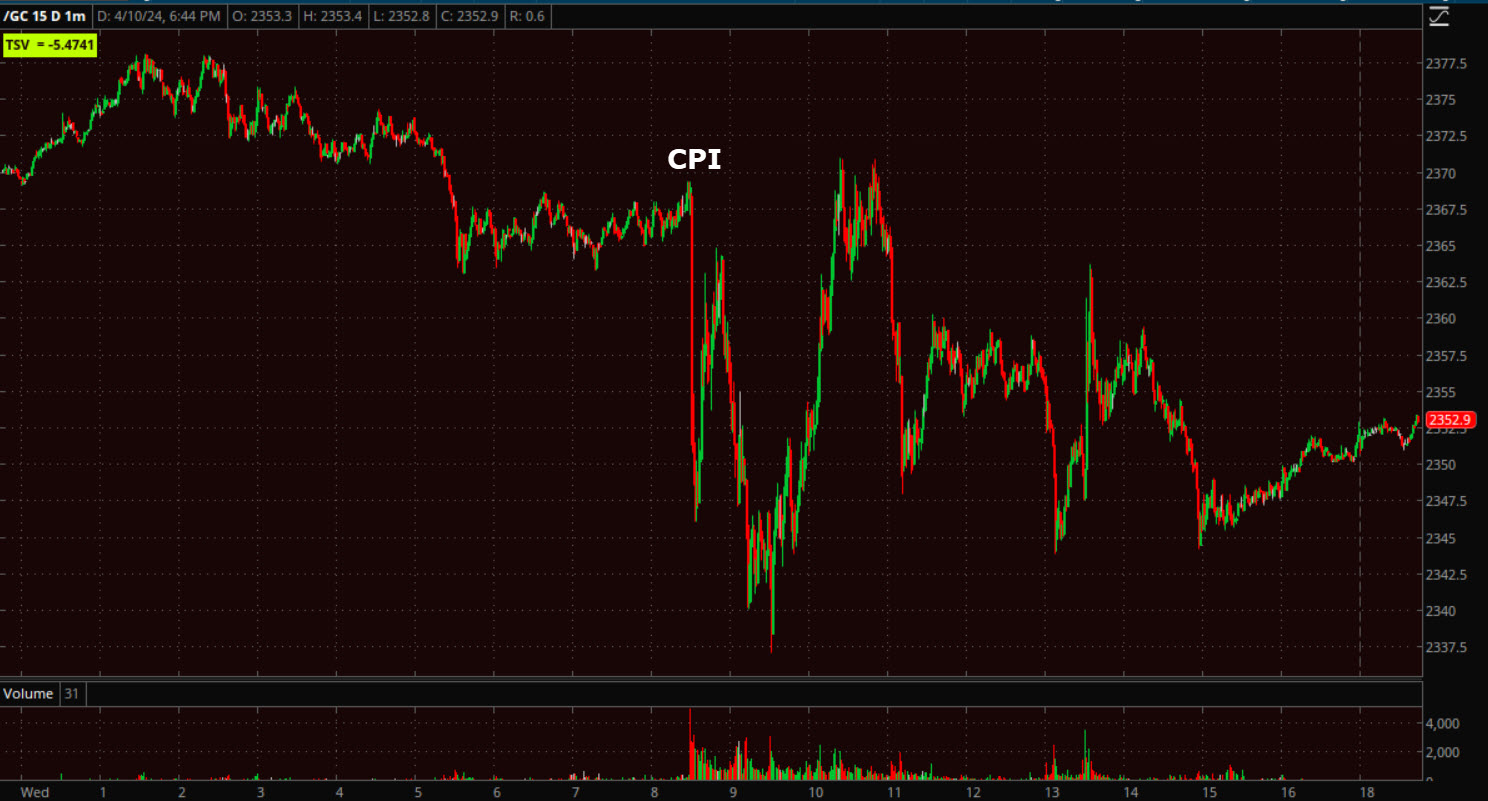 Gold futures (1m)
I have to say, I thought gold held up way better than I’d expect on such a move in the Dollar and yields.
Also recall the consolidation/correction I think gold is due, or near due, as mentioned last night in the Daily Wrap,
“Gold’s price trend has been phenomenal and volume good. The only thing I see to be on the lookout for is a price consolidation as measured moves are either hit, or nearly hit.
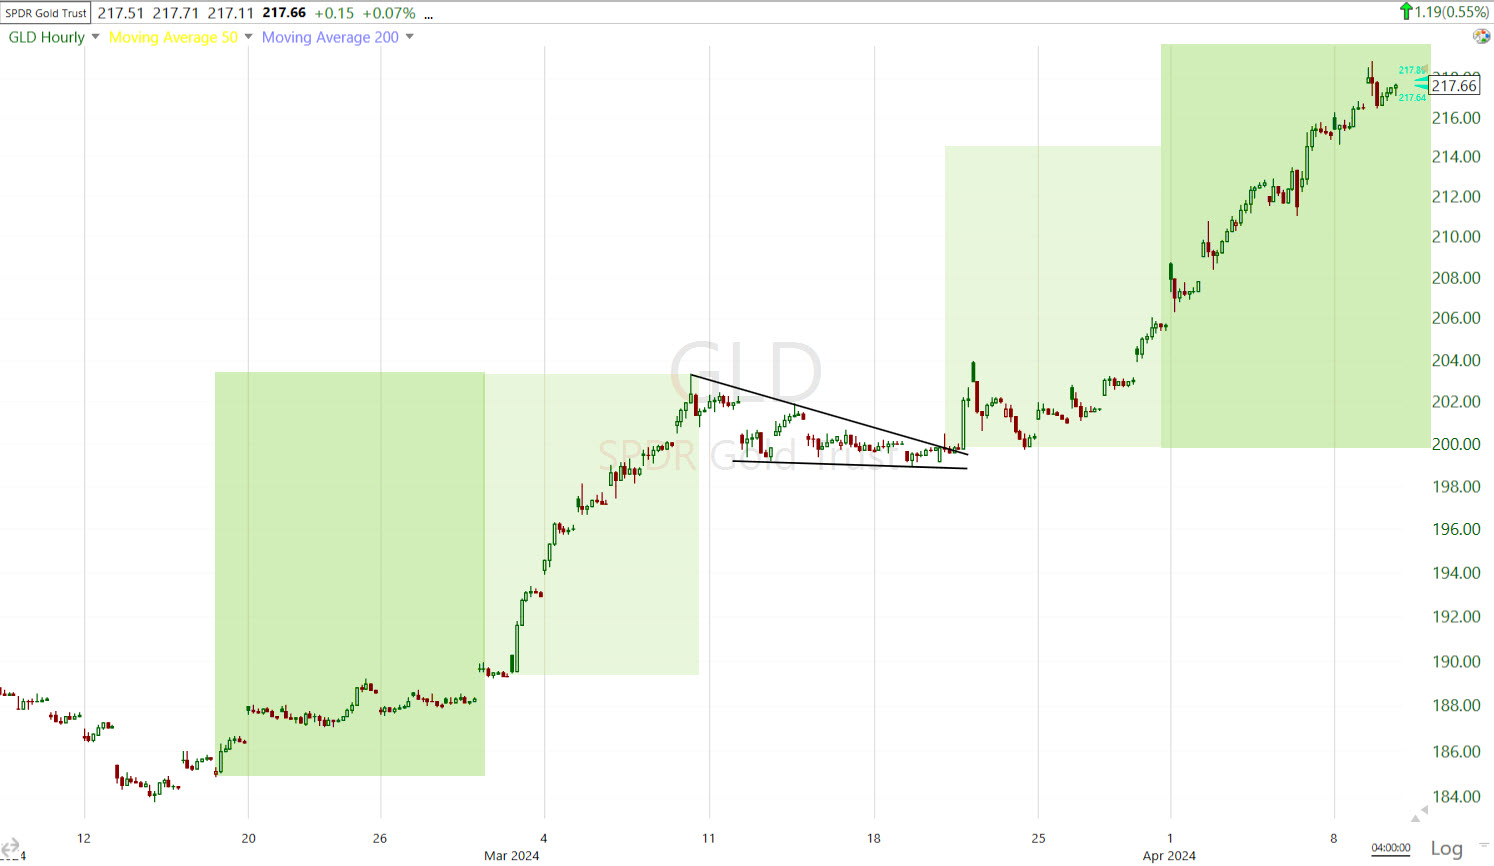 GLD (60m) measured move (light green) and a more liberal interpretation of the measured move (darker green).”
We’re only a day in, but price action does look like there’s a reasonably strong chance of a consolidation starting, which is good news and bullish for gold.
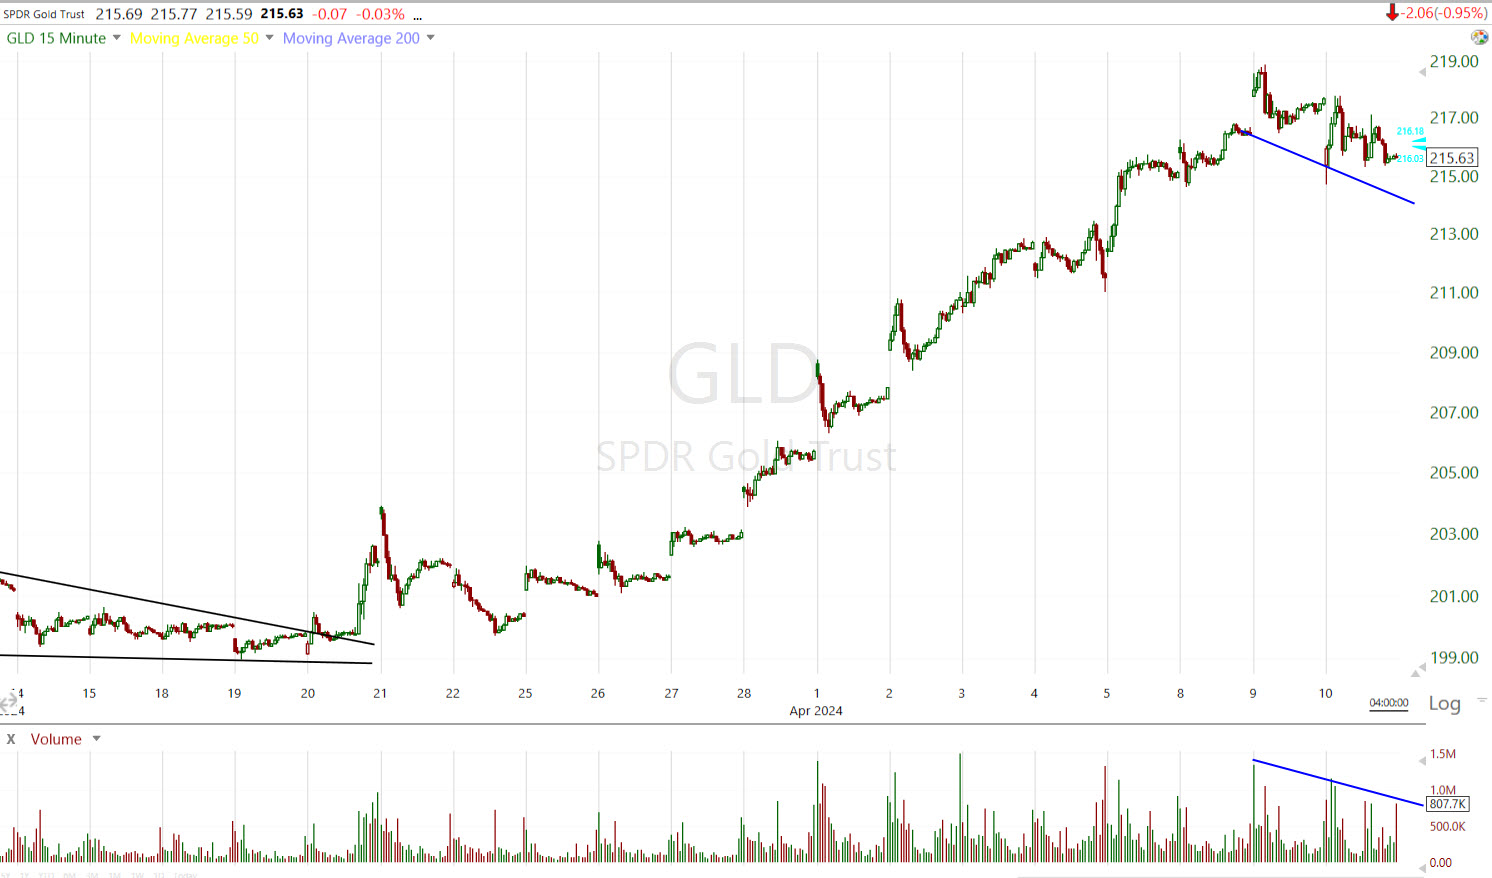 GLD (15m) – so far, so good. That’s a monster trend.
Summary
Markets, especially stock markets, can get into irrational funks and stay that way longer than seasoned veterans expect. Tops are almost always a process, not an event. However, I think we’ve been seeing this unfold and it’s getting worse, or more intense, or what I’ve called, “fertile ground” for a topping pattern and market trend reversal. I’m not sure I’d say that “the perfect storm is brewing”, but I would say that there’s a “serious storm brewing” in equity markets.
Considering the equity market was rallying in December and into 2024 on the certainty of a March rate cut and up to 7 cuts priced in for 2024, and considering where rate probabilities are today with only 1.5 expected rate cuts now, the stock market has been asleep at the wheel in some sort of Goldilocks La-La Land. Reality on the ground is baring down faster and harder as we move deeper into 2024’s reflation.
As demonstrated last night, systematic funds like CTAs are near max, record long equity exposure (as are most others), but their mechanical estimated sell trigger price levels are getting closer and closer, meaning with a normal bull market correction of 5% or so, they could trigger a tidal wave of selling — first selling their near record long holdings for the first time this year, and if selling is bad enough and other deeper price triggers are hit, flipping to net short and even full short which is about where they were October of last year. The first short-term CTA sell trigger is estimated to be SPX $5120.
This is among many reasons I said last night,
“the upside gains vs. the downside risks here are getting very much out of whack and asymmetric.”
Tomorrow we’ll get the Producer Price Index (PPI) and Friday we kick off earnings season with the banks.
We’re getting there.
Overnight
S&P futures are down -0.2%.
The U.S. Dollar Index is down -0.05% as it starts to consolidate today’s gains. The Dollar cold certainly see more tomorrow on a hot PPI print.
WTI Crude Oil futures are unchanged at $86.22/bbl.
Gold futures are up +0.15%, consistent with the idea of some consolidation starting.
Bitcoin futures are up +0.65%.
Yields are unchanged tonight.
Looking ahead, Thursday’s economic calendar features:
- 8:30 ET: March PPI (prior 0.3%), Core PPI (prior 0.6%), Weekly Initial Claims (prior 221,000), and Continuing Claims (prior 1.791 mln)
- 10:30 ET: Weekly natural gas inventories (prior -37 bcf)