The CPI repot ended up being influential (coming in hotter than expected), influential enough to send the Dollar and 10-yr yield –both of which were consolidating bullishly ahead of the CPI report — breaking out to the upside with the 10-year easily crossing above the 4.20% level I’ve thought would be trouble for stocks for well over a month, and it was.
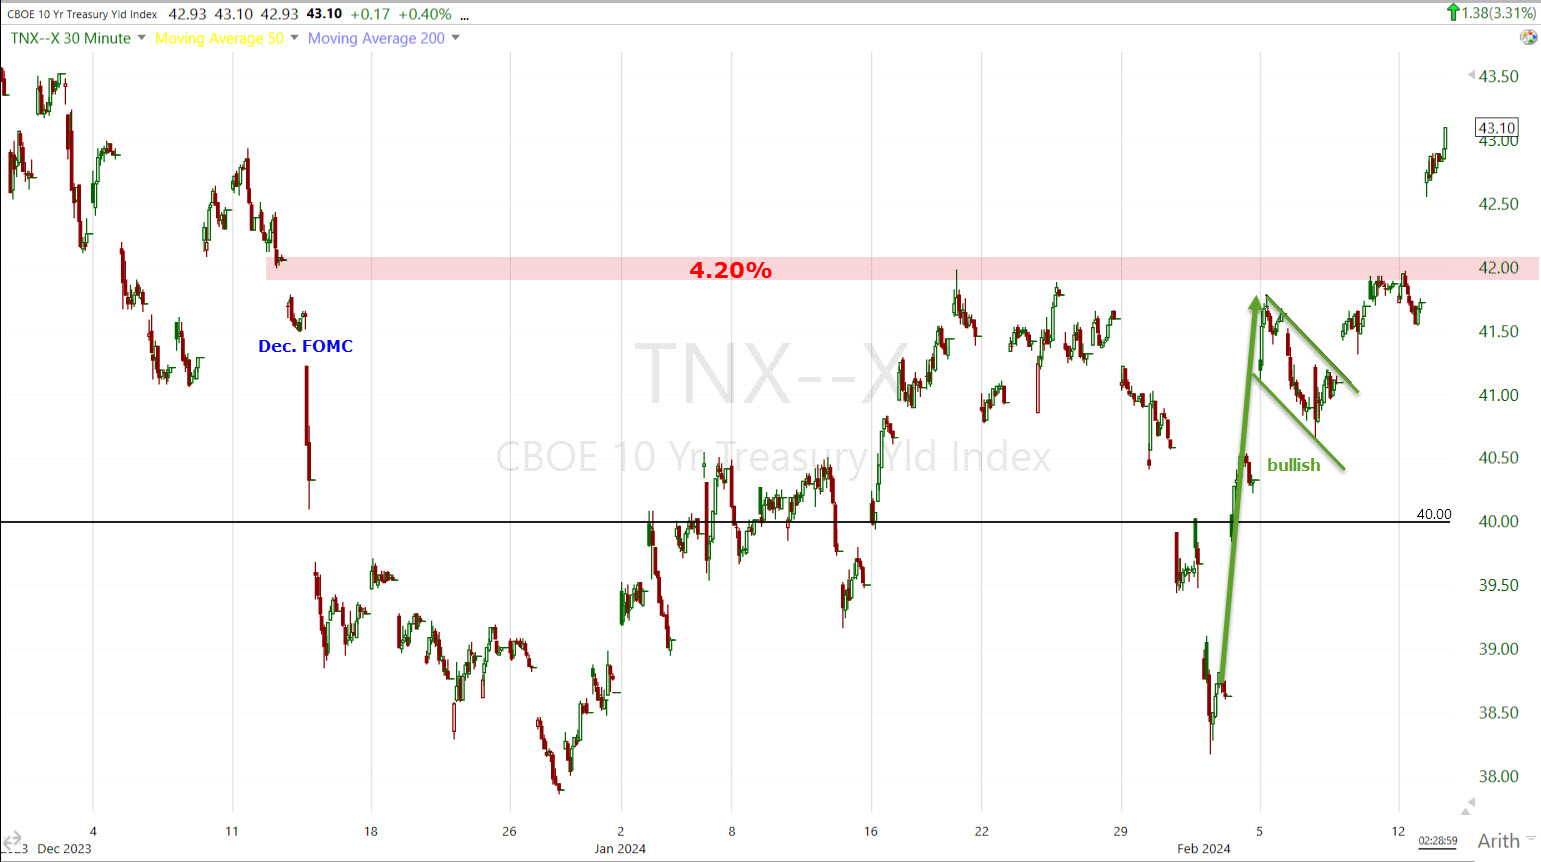
10-yr yield (30m) trading above 4.20% and above the December collapse in yields after an unusually dovish press conference from Powell.
The catalyst was the “bump” in inflation I’ve been expecting as seen in this morning’s CPI (Consumer Price Index).
That’s just more confirmation that the Q4 GDP number is completely bonkers. Here’s the post on the “wonky” GDP. The gist of the report was, there’s no way Q4 GDP came in at 3.3%. The only way they got to that print was by using a ridiculously low deflator of 1.5%. Here’s an excerpt from the post,
“What hit me immediately was the “deflator” component of GDP print this morning. I’m not sure where it came from at 1.5%. The consensus expectation for the deflator was for 2.8%, which sounds reasonable to me. The deflator is the proxy for inflation. Instead it was 1.5%, almost half of consensus expectations of 2.8%. Hmm.
The most recent CPI (inflation) from December was 3.4% according to… the government run BLS (Bureau of Labor Statistics). By the way, the last (Q3) GDP deflator was 3.3%. If you believe the inflation rate is 1.5%, then the GDP growth number 3.3% is legit, but if you use the government’s own, most recently released inflation of 3.4%, then GDP is overstated by 190 basis points and growth is more like 1.4%.
It’s a screwy report.”
The last official, government released inflation data we had was the December CPI at 3.3% Y.o.Y. and this morning we get +3.1% YoY. That just confirms there’s no way that the 1.5% deflator is realistic, and thus GDP is WAY overstated, buy, HEY, IT’S AN ELECTION YEAR!
The issue with today’s CPI is that much of the equity market’s gains from late November and December were the result of the market pricing in a March rate cut from the Fed and 170 basis points in rate cuts for 2024. The obvious contradiction, and problem, is that markets have since priced the March rate cut and half of the 170 bp in 2024 cuts, out. Stocks, though, haven’t discounted the newly, more hawkish probabilities — the same ones they were happy to rally on when they were pointing to a March rate cut.
According to the CME’s FedWatch tool, this morning’s CPI caused Mach rate cut expectations to be slashed in half from yesterday and now stand at just 8.5%, down from 77% a month ago.
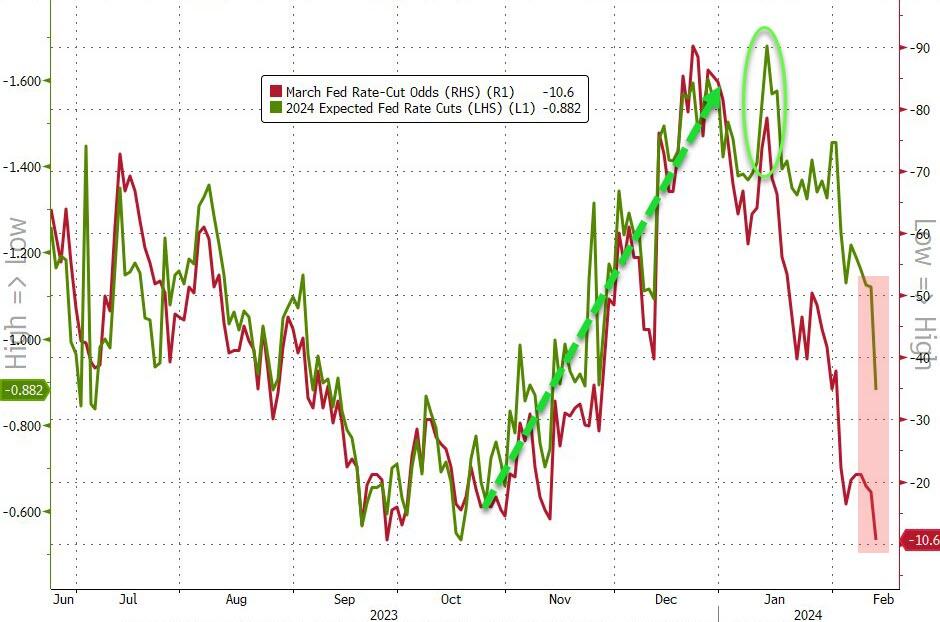
Source: Bloomberg
March rate cut odds (red) are below where they were in October as the S&P traded at $4100. I’m not saying the entire rally should be retraced because it was all due to March rate cut expectations, but pretty much all gains above SPX $4600 are a result of the market pricing in that rate cut.
Euphoric bullish investors have been ignoring the realities the rest of the market has priced in all of 2024.
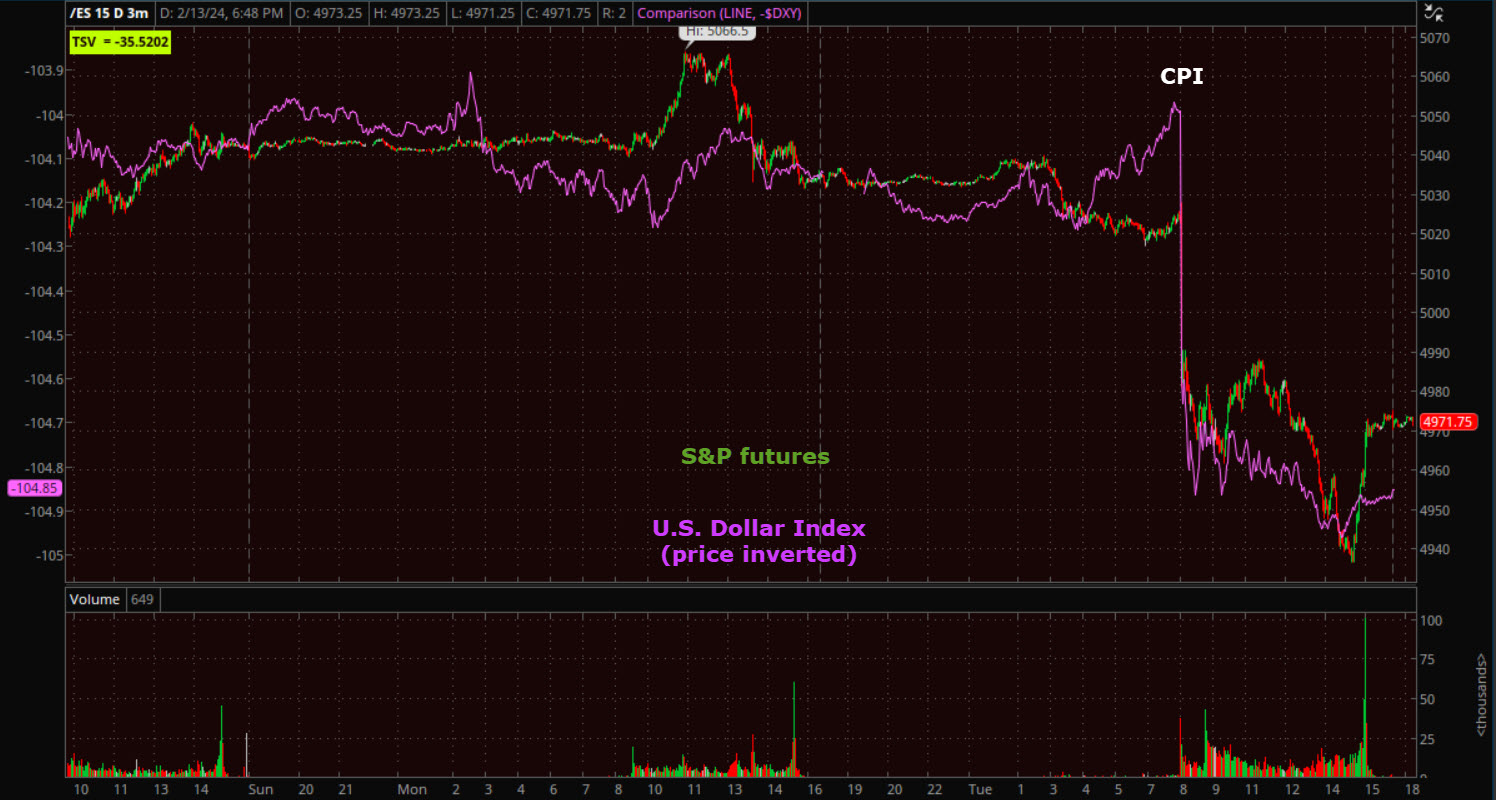
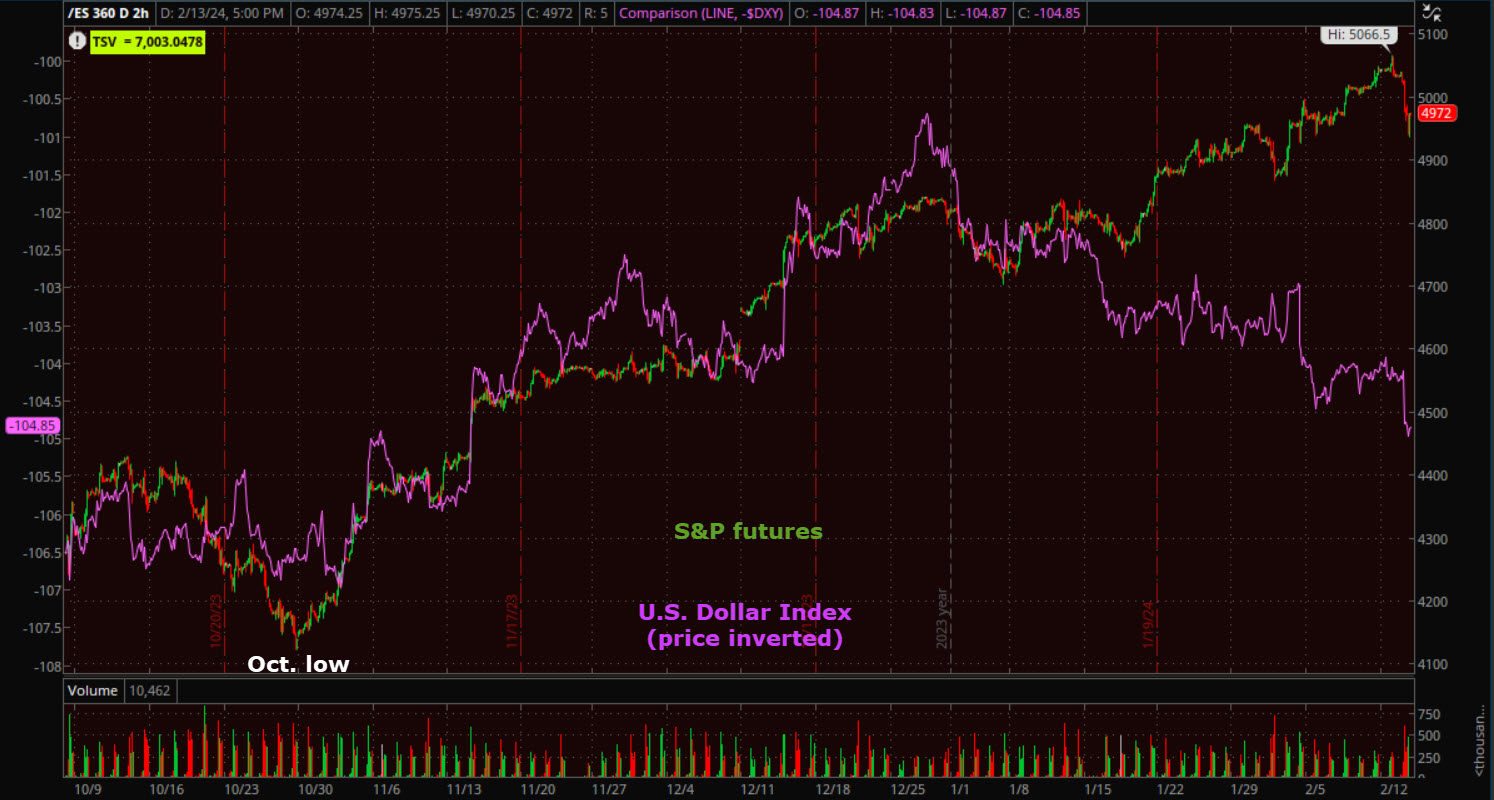 (2h) The Dollar priced in the reality, and its been one of the strongest correlations (inverse) with stocks since Q2 2020. Stocks have ignored it under this euphonic mindset.
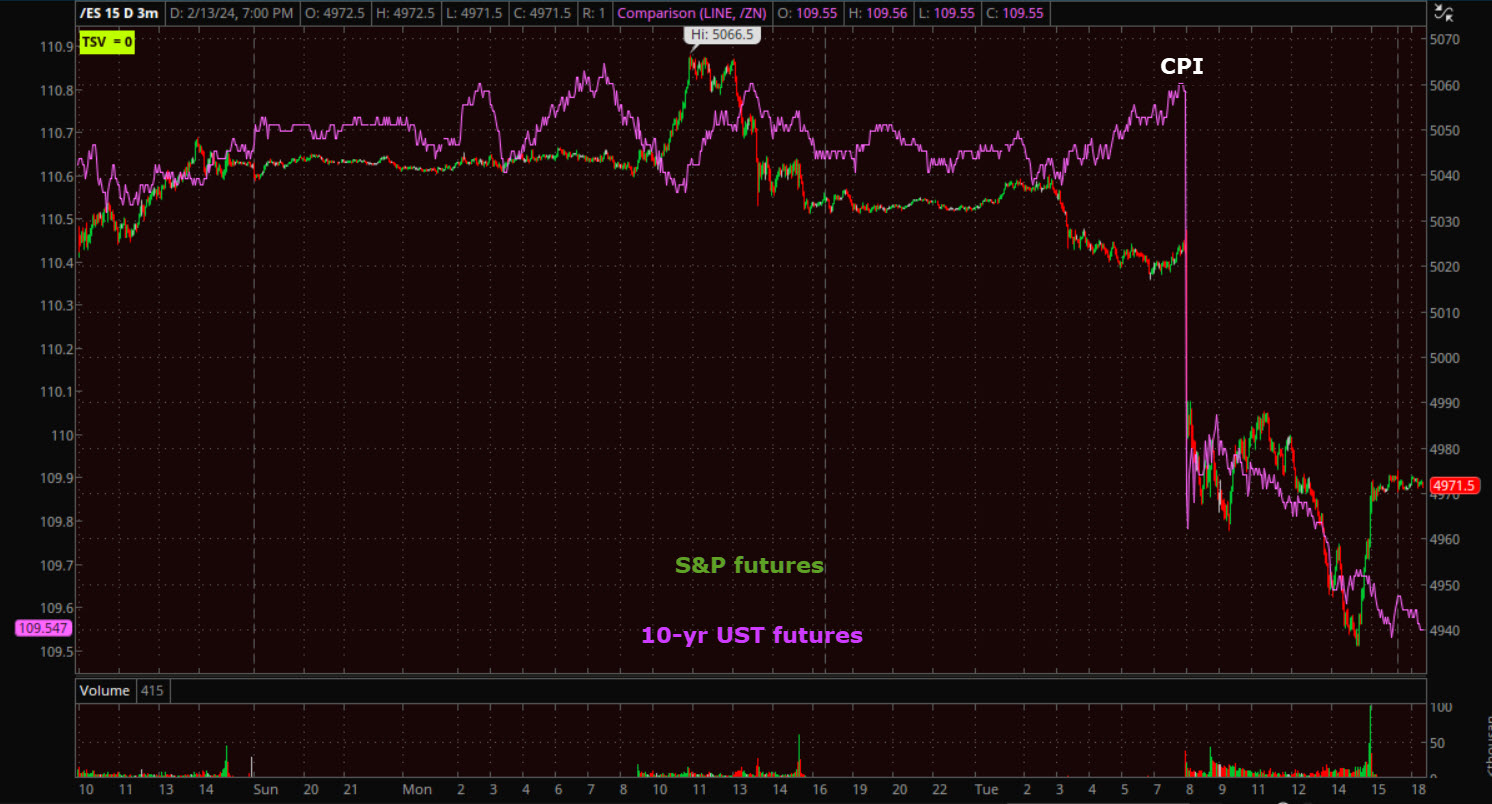
The same with the rates market…
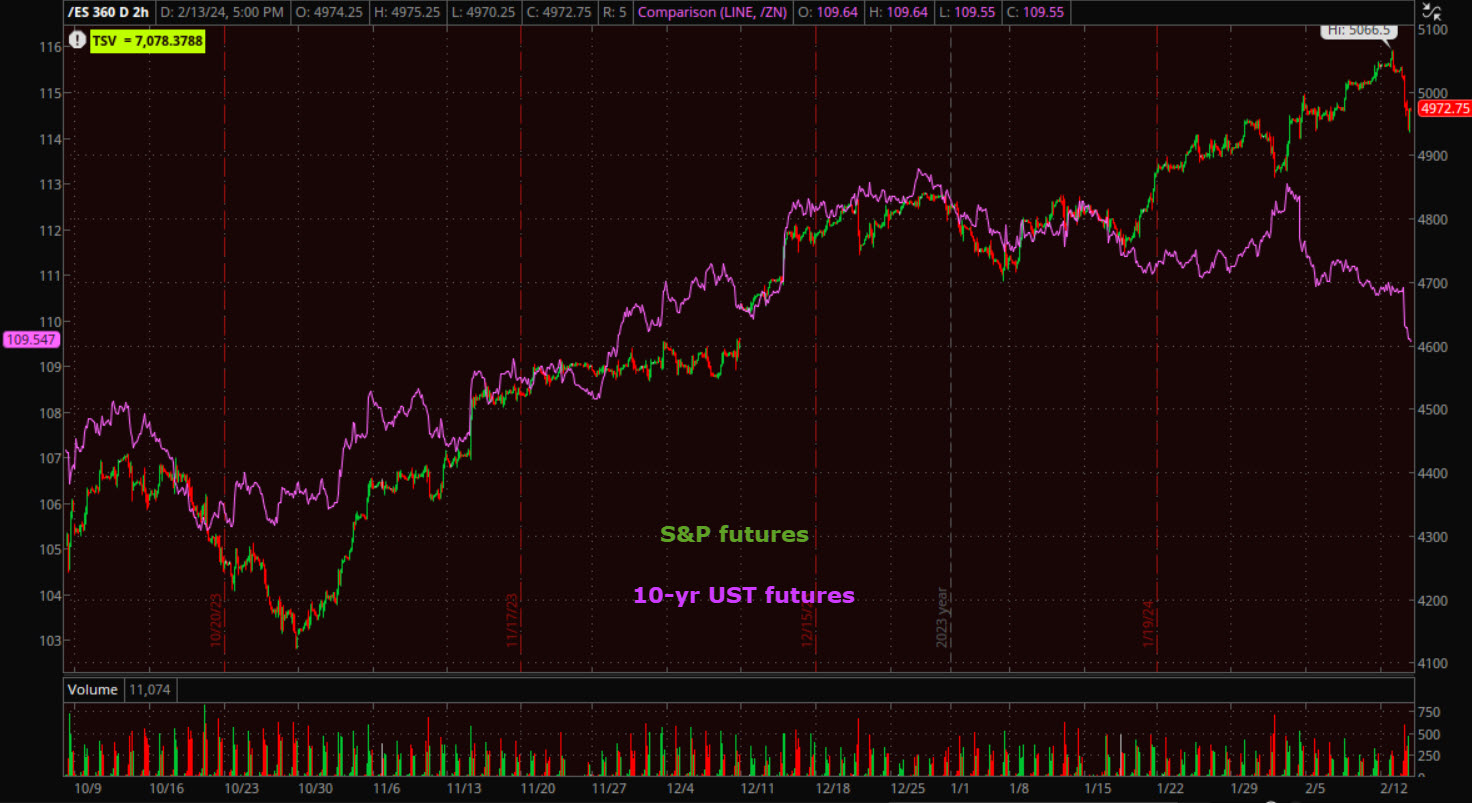 (2H)
(2H)
That is that stocks ignored it until today…
 (3m)
(3m)
 (3m)
(3m)
The stock market has a lot more to go to catch down to the bigger picture.
I personally don’t see evidence that were going to see a 1970’s or early 1980’s resurgence in inflation, but I have been expecting this “bump” in inflation, which means the Fed is going to have to keep policy tight, or “higher for longer”, which does more damage to the economy. With the 10-year yield no longer constrained by resistance at 4.20% (and the Dollar for that matter), yields can rise more from here and pressure the extremely high valuation market leadership that’s already highly concentrated into a half-dozen or so mega-cap and semiconductor stocks. In short, the environment is unfolding as I’ve been expecting.
I’ve flagged the 4.20% level on the 10-year yield for weeks, maybe more than a month, as being the point at which the stock market was going to run into trouble. Today’s CPI was the catalyst, but the price action in the 10-year yield suggested we were nearing that point of a breakout above 4.20%.
 10-year yield (15m) – You could probably view this as the market starting to reprice what rate expectations have told us for weeks. The market rallied on a certainty of March rate cuts following the dovish December FOMC, but while most asset classes priced out the possibility of that Mach rate cut, the equity market ignored it and kept trending higher. Whether in the market or in life, we don’t tend to make good decisions at emotional extremes and the market has been pegged in Extreme Greed since December.
Averages
Just 52 (or 10%) of the S&P-500’s stocks closed green, just 6 of the NASDAQ-100’s component stocks closed green, and 5 of the Dow-30 Industrial Average. today was a bloodbath of selling.
So much for Goldman’s view that Small Caps may somehow rotate in and save the rally. Small were down almost 5% at intraday lows and lost 3 times more than the S&P, for their worst day in more than 3 years – the worst day since December 2020. The S&P also had its worst day since December 2020.
Dow Transports were second worst, losing -2.6%.
The Dow, Small Caps and Transports all experienced failures of yesterday’s modest breakouts of their respective resistance zones – one local resistance, one multi-month resistance and one multi-year resistance.
S&P-500 ⇩ -1.37 %
NASDAQ ⇩ -1.58 %
DOW JONES ⇩ -1.35 %
RUSSELL 2000 ⇩ -3.96 %
It turns out that a number of bearishly biased daily candlesticks yesterday were confirmed with today’s ugly price action, leaving what may end up being bearish breakaway gaps. As for my near-term views, they’re little changed from the Afternoon Update and the Supplemental I posted shortly after. In short, I think probabilities are high that we see some volatile, choppy price action for the next several days, maybe weeks, but today was certainly what I’d consider to be a serious crack in the bullish dam’s wall.
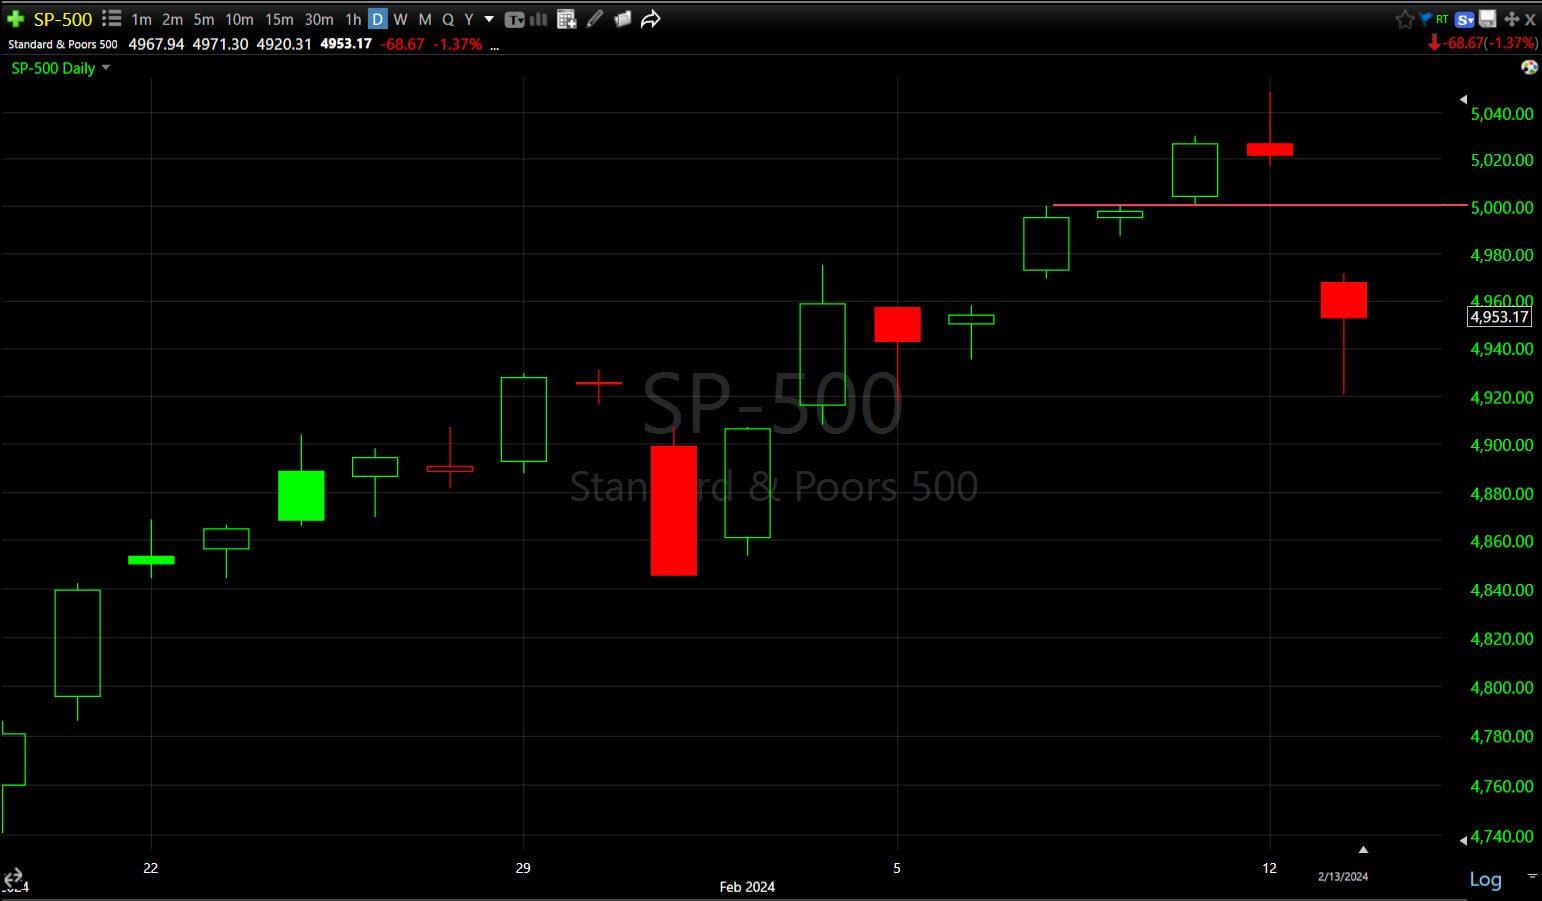 SP-500 (daily) lost 5,000 and left a big gap down, possibly a bearish breakaway gap such as we saw shortly after July’s Key Reversal Day. However, the S&P did close off the low of the day with buying in the last 30 minutes posting a bullish hammer (likely short-term support) with a very deeply short-term oversold market.
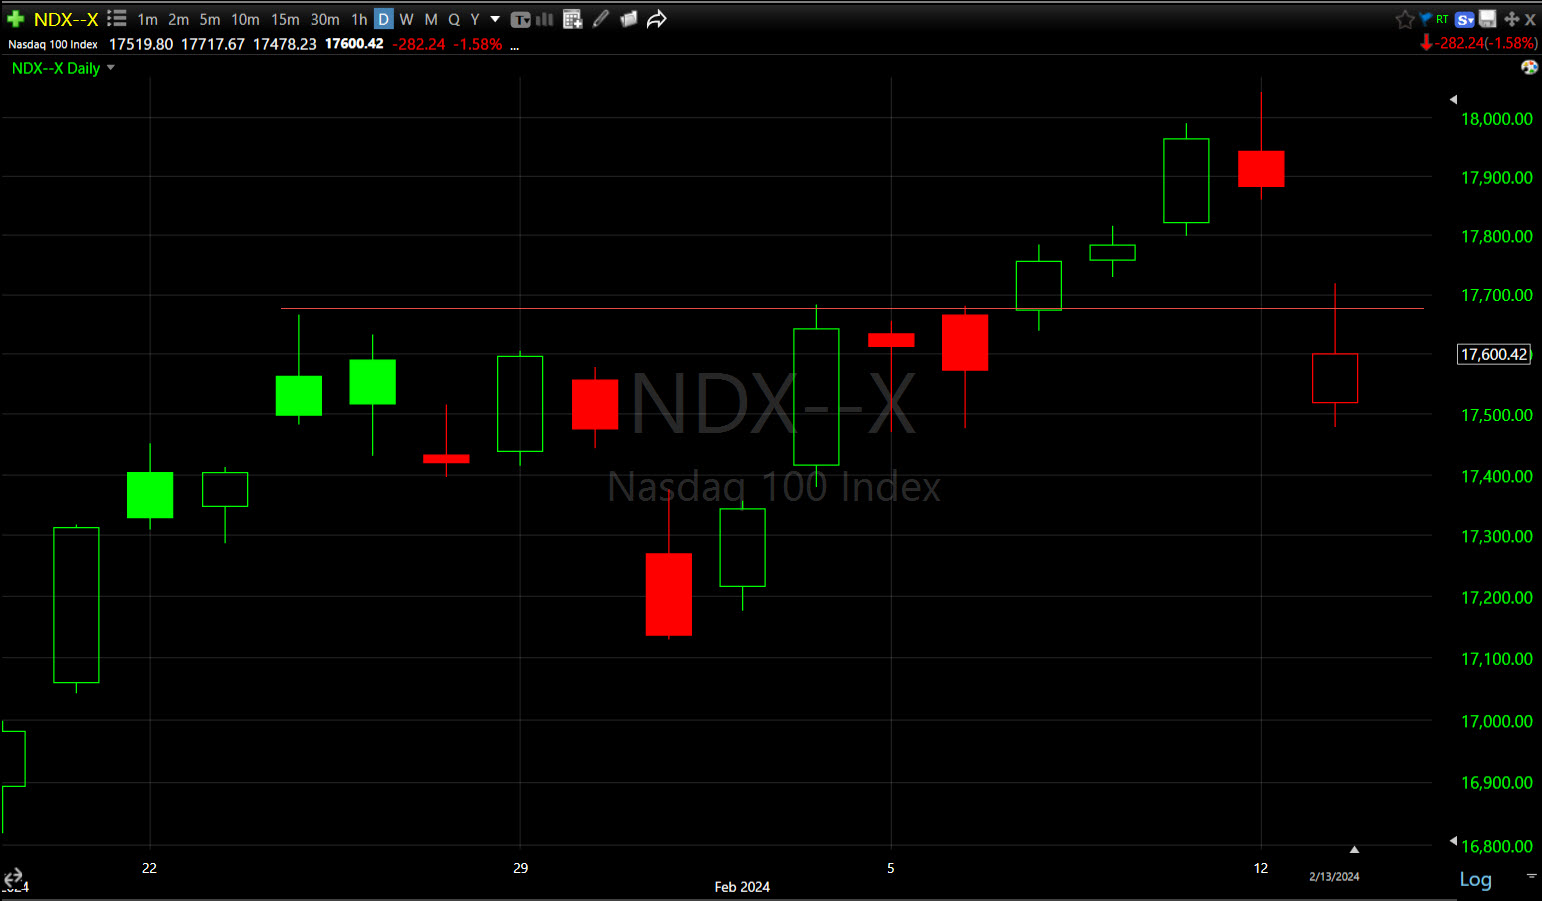 NASDAQ-100’s (daily) inside day yesterday was confirmed with today’s bearish gap down. The $17,675-$17.685 area (red trend line) is a short-term area of interest as it may provide some local resistance.
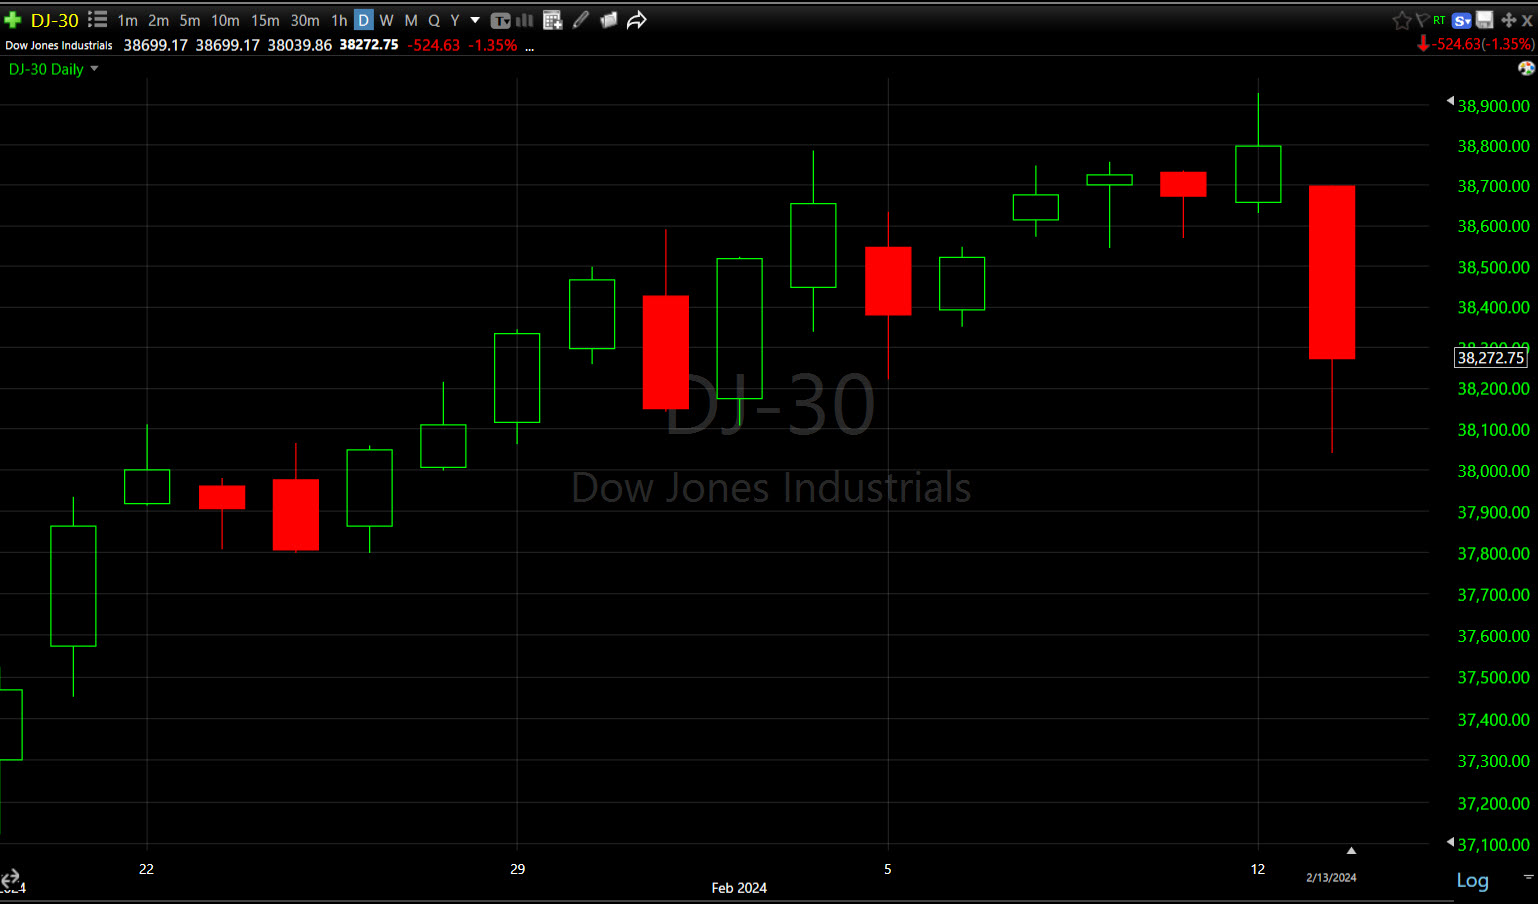 Dow (daily) – while a pretty big red candle, I see a more troubling development here I’ll touch on with the intraday chart below.
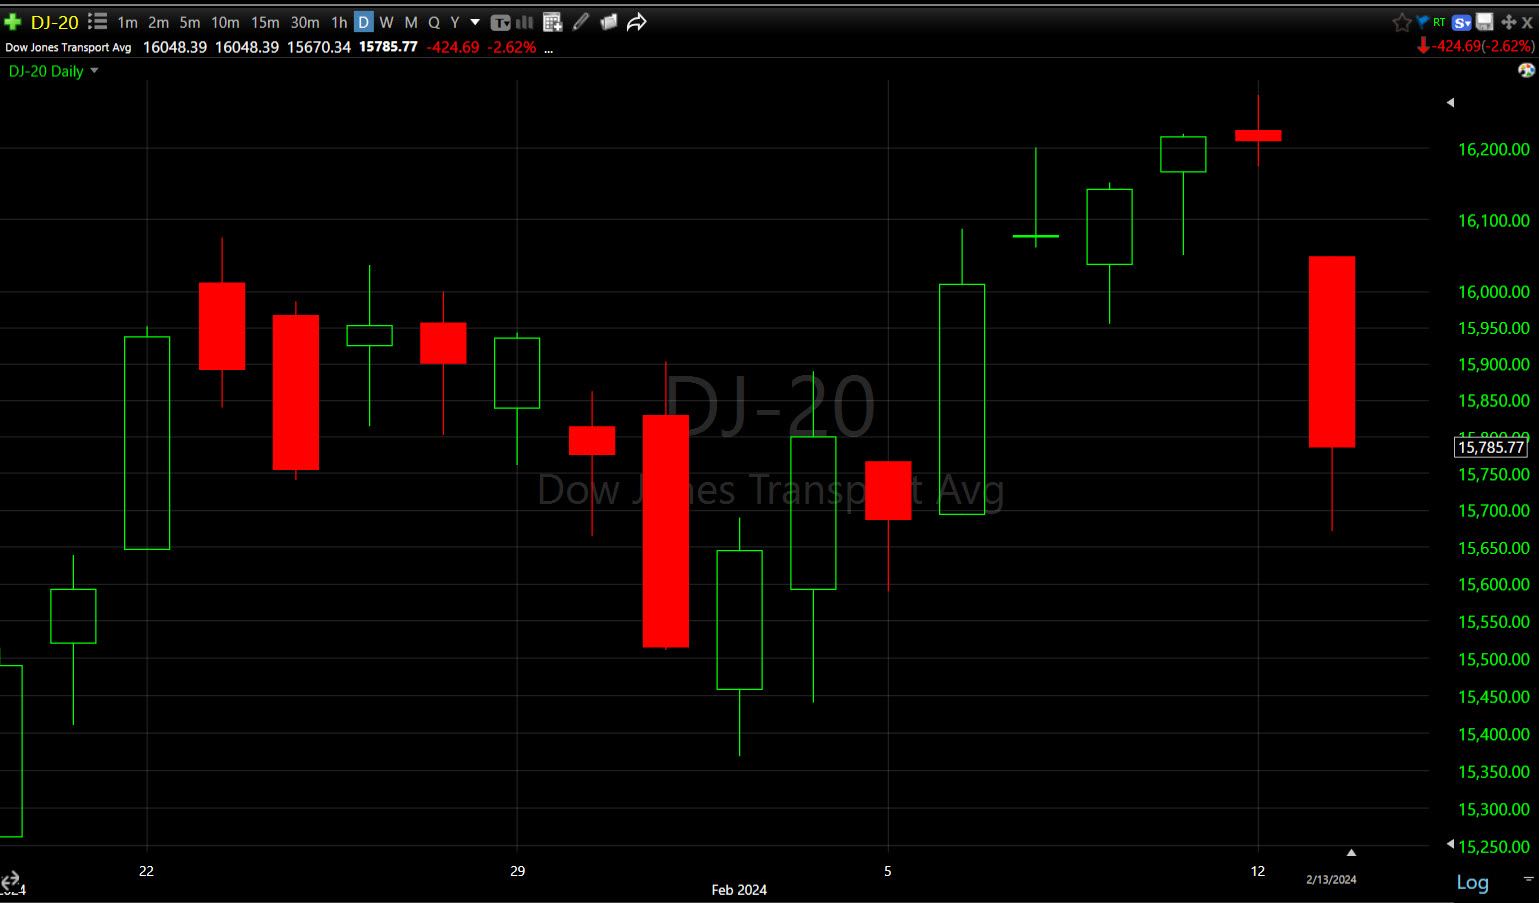 Dow Transports (daily) were simply uglier and also have an issue more apparent on intraday charts (below).
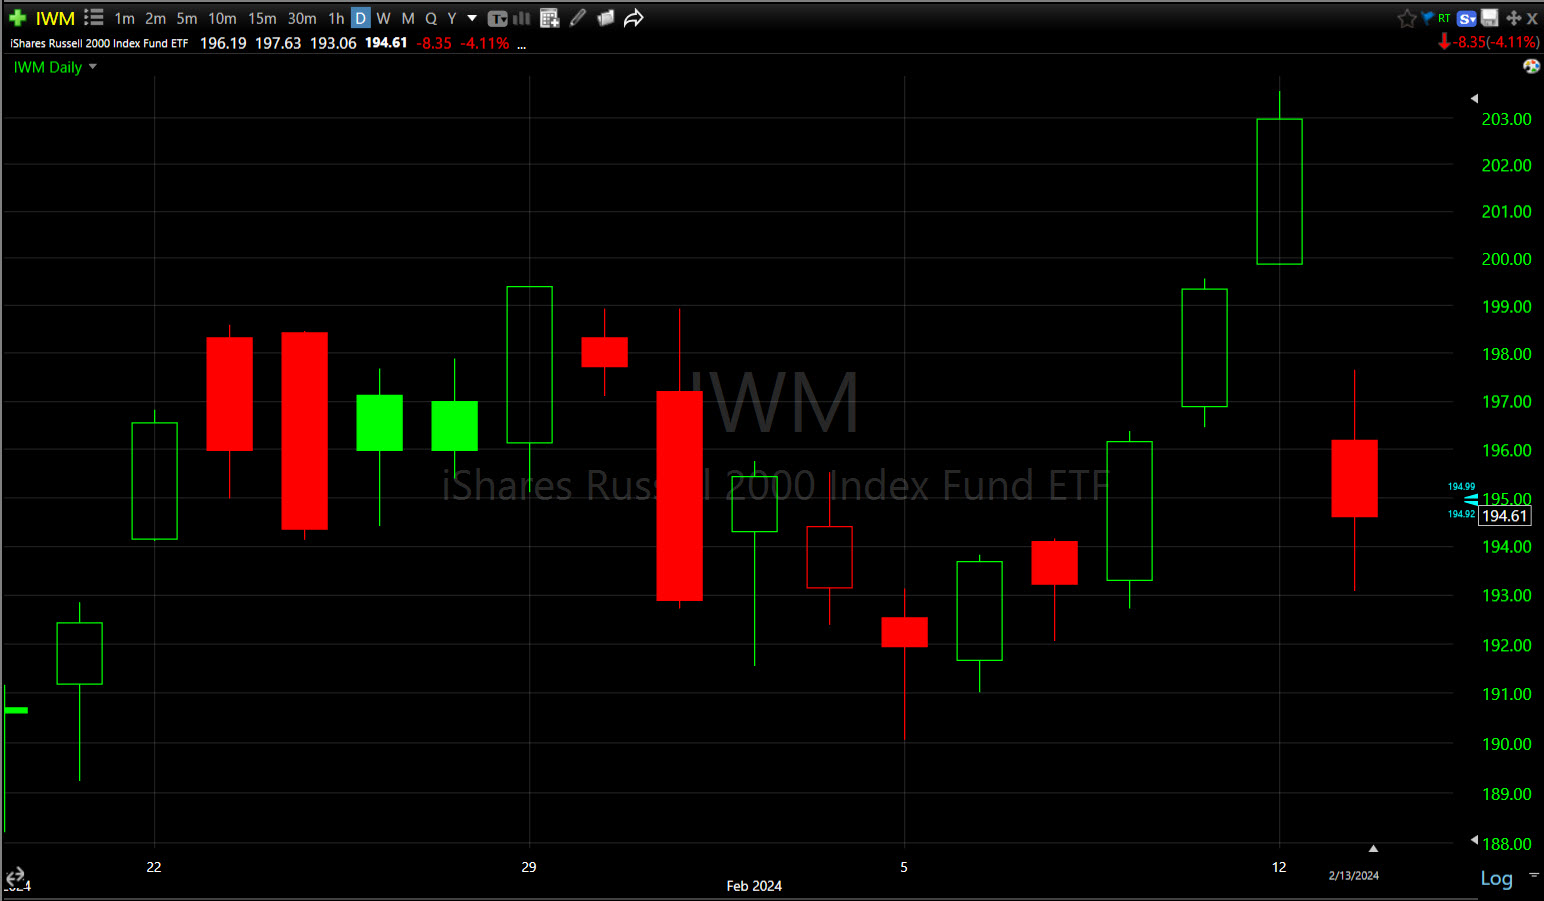 Small Cap IWM (daily) was the only average with a solidly bullish price candle yesterday and it was the worst performing today. That just goes to show that Small Caps really can’t do much without short covering to drive them higher. As mentioned in last night’s Daily Wrap, if higher rates are going to drag on the market’s very narrow and concentrated leadership, I simply don’t believe small caps can rotate in to the extent they take over market leadership and extend the rally for the broader equity market.
Intraday charts reveal some more troubling developments for a few of the averages… You know what I often say about failed moves, and in this case, “failed breakouts”, often lead to fast price reversals.
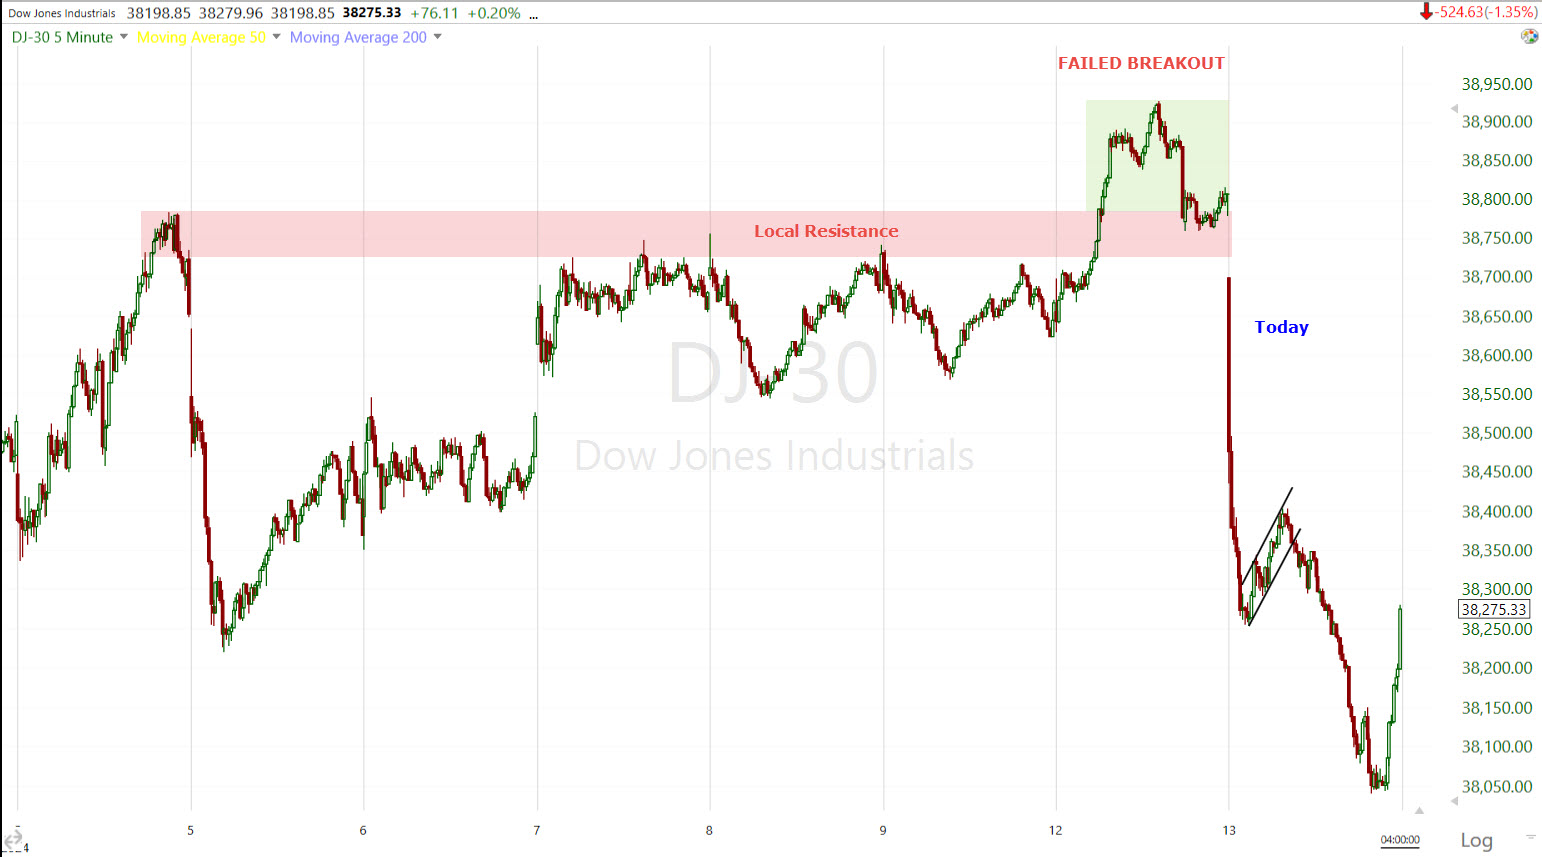 The Dow was struggling with this local area of resistance and just closed above yesterday, and quickly lost it. Dow also had some of the more bearish intraday price action with a leg down, a small bearish consolidation and another leg down before some late day buying (likely short traders covering and taking profits before the close) lifted it off its lows, but that’s still a hard won breakout that failed.
![]() Dow Transports (2H) have had a lot of trouble with this area for a much longer time than shown on this chart. They just barely closed above yesterday, like last July as all of the H&S tops formed. They lost that breakout today.
Dow Transports (2H) have had a lot of trouble with this area for a much longer time than shown on this chart. They just barely closed above yesterday, like last July as all of the H&S tops formed. They lost that breakout today.
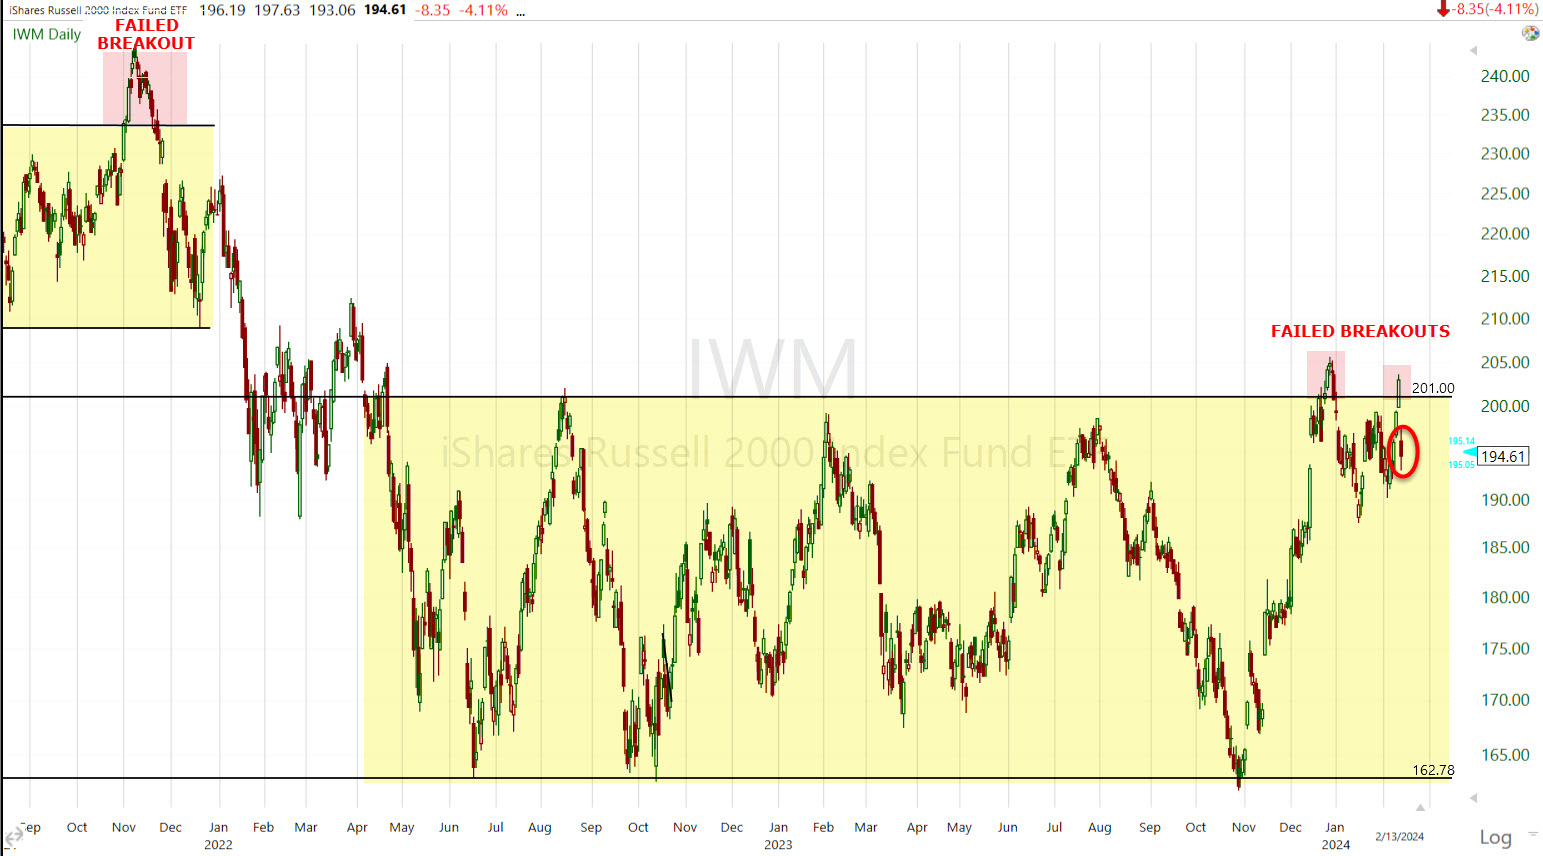 Small Cap IWM (daily) has struggled in this lateral zone for nearly 2 years. This is the second breakout above it that has failed
As for the my Most Shorted Index, which saw a 5-day short squeeze that was bigger than the December FOMC short squeeze…
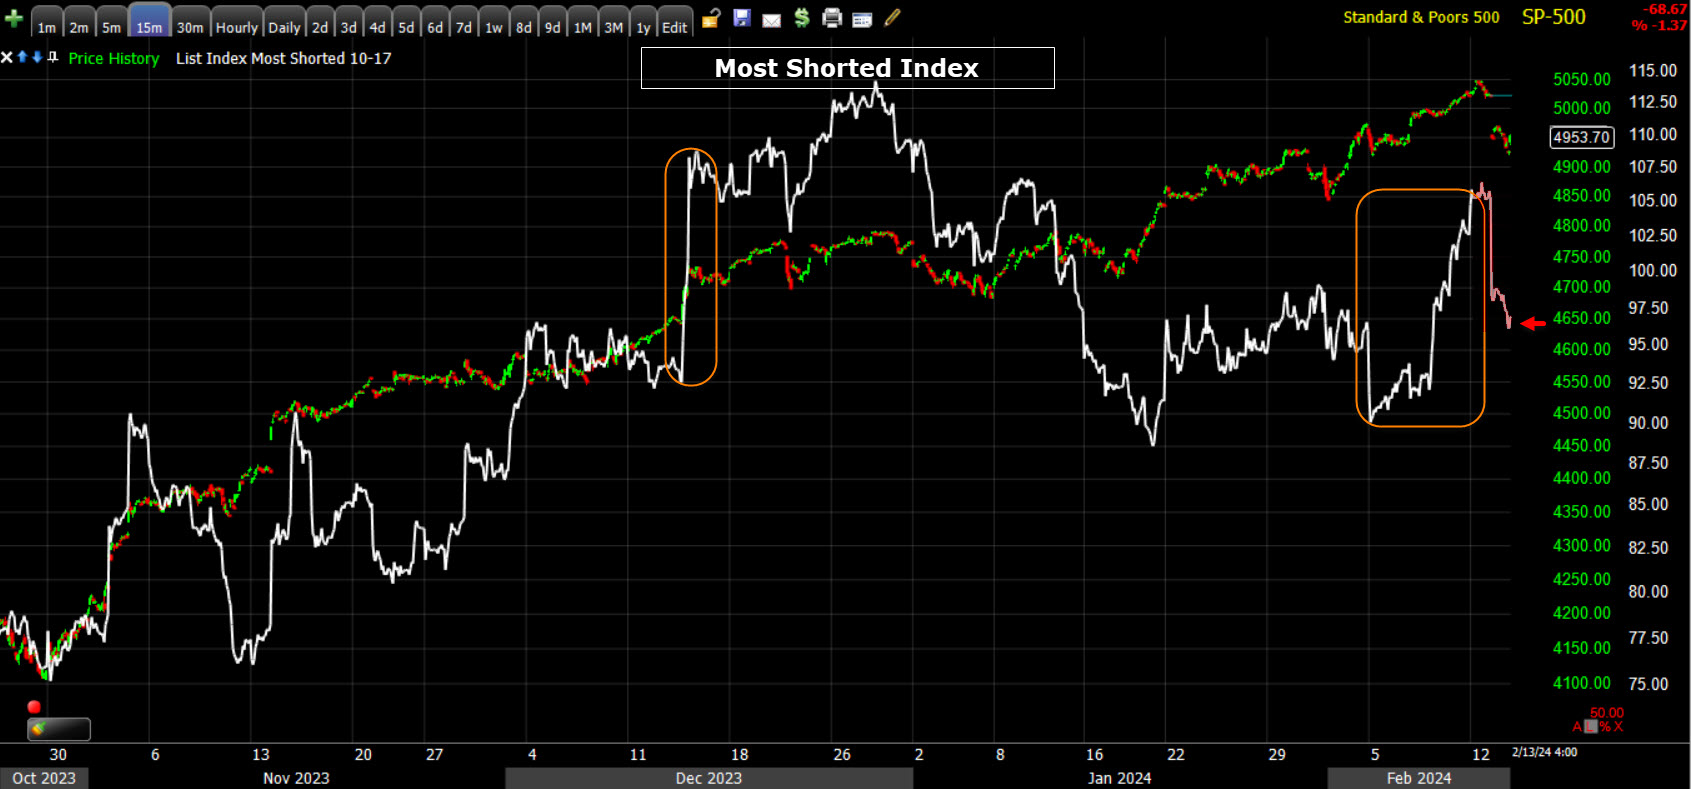 Today erased about half of the last week’s short squeeze gains with a -6% 1-day drop.
VIX gained +13.8%, but it was yesterday’s 7.75% gain when the S&P was only down a tenth of a percent that was more telling, as well as VVIXs relative strength last week that suggested we were going to see some decent movement in VIX soon. VIX ended well off the day’s highs…
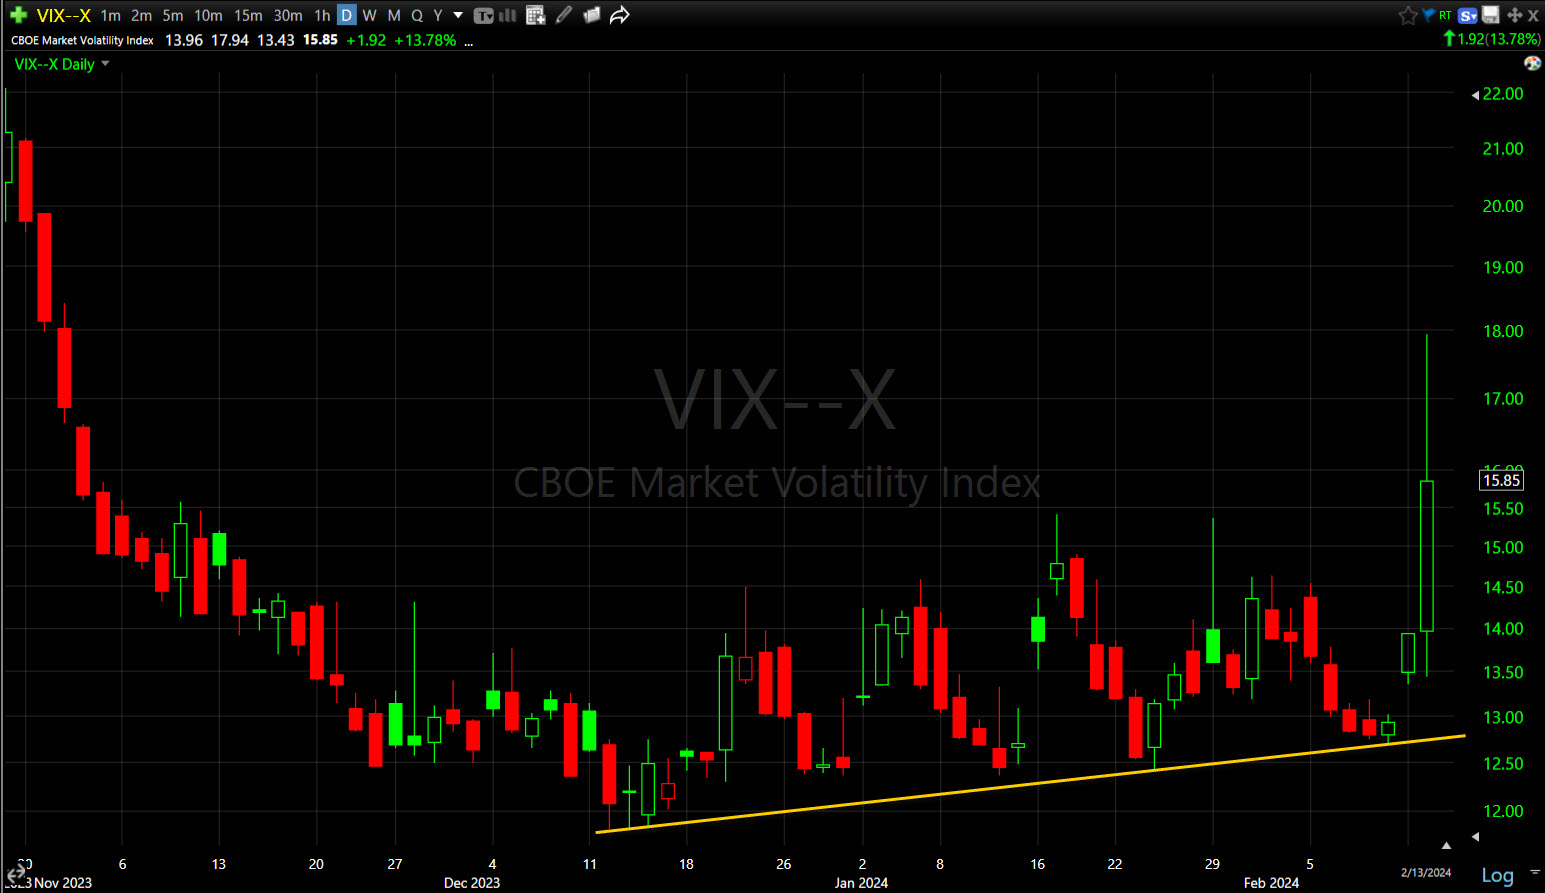 VIX (daily) with a long upper wick on today’s candlestick as price reached as high as $17.94, or a as much as a +29.6% intraday gain. Still, what’s more interesting to me is the trend of relative strength (yellow) that’s been developing. The first time I noticed something like this was into the market’s 2007 record high preceding the Financial crisis, and numerous times since then before market tops, mini-crashes or outright crashes.
That’s not tot take anything away from today’s move in VIX. For a little bit today it started to wreak of pure panic…
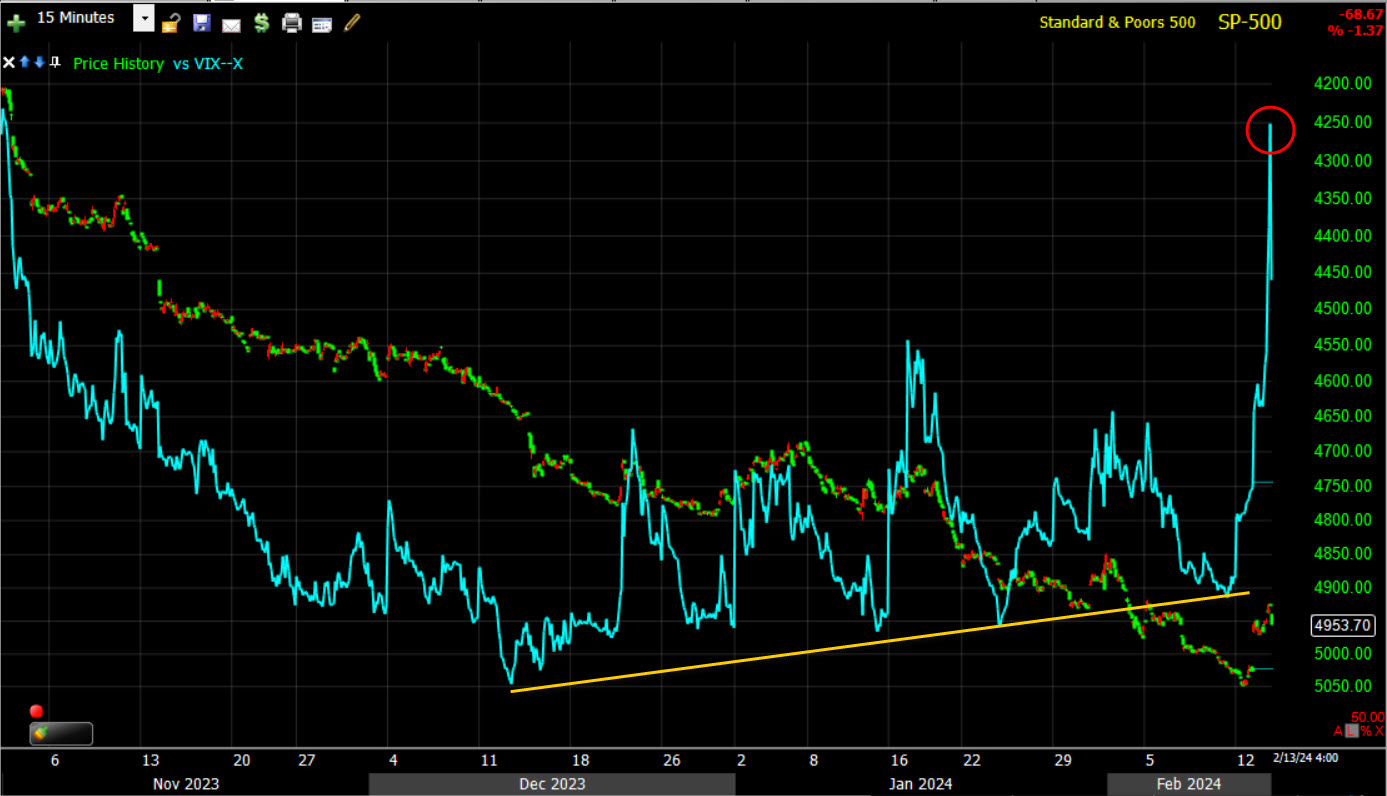 SP-500 (15m) with price inverted and VIX (blue) with panicky action in VIX today (red), but still it’s that trend of relative strength where VIX “should” be making lower lows, not higher lows.
Near term, VIX contracts roll over tomorrow and with it, a lot of dealer gamma which should calm VIX down a little in the near term.
The Absolute Breadth Index ended the day at 22, down from the mid 25’s yesterday. I’m actually surprised it wasn’t lower today.
S&P sectors
All 11 S&P sectors closed lower with 10 of the 11 closing at least 1% lower. Among the 4 worst performing sectors were the defensive, but rate-sensitive Real Estate and Utilities sectors, and as suspected with higher yields, the mega-cap heavy Consumer Discretionary and Technology sectors.
Consumer Discretionary was weighed on by its mega-cap components, Amazon.com (AMZN -2.2%) and Tesla (TSLA -2.2%). With regard to the former, I just saw that Executive Chair, Jeff Bezos, sold 12mn shares for about $2bn between Friday and Monday and $4 bln in shares in just the last week according to regulatory filings. Bezos will offload 50 million Amazon shares by January 31, 2025 according to a recent regulatory filing. There’s a lot of reasons he could be selling shares, but one reason is not, “I think the stock is going a lot higher”.
The mega-caps (MGK -1.3%) held up in line with the benchmark S&P-500 index and outperformed the S&P Equal Weight Index (-1.7%) by 40 basis points, but still had their second worst day since the rally kicked off in October. The worst day was in the first week of January which resulted in the worst start of a year in more than 2 decades.
Semiconductors (SOX -2%) underperformed Tech, but acted better intraday having rebounded off of opening losses of -3.35%. Nvidia (NVDA -0.2%) was helpful in that regard as it had come off of opening losses of -3.7%. Investors still know what they know and are doing as they always do and linearly extrapolating recent price trends into the future. That’s just human nature and that’s how we get to bearish and bullish extremes in sentiment.
Despite their recent short squeeze, Regional bank shares fell under renewed selling pressure today with a loss of -4.25% weighing heavily on the Small Cap Russell 2000. One of the reasons I highlighted last week that I think investors are going to have a hard time buying the Russell 2000/Small Caps, is that with the Fed’s bank bailout (BTFP) expiring March 11th, and already we’re seeing tremors in banks like New York Community Bank (NYCB -6.15%) and problems in Commercial Real Estate that these banks have a lot of exposure to, I don’t believe investors trust that the Regional Banks are safe and stable. Additionally, the “reflation trade” Goldman Sachs recommended (highlighted yesterday, including buying cyclicals, Value style factors, and Small Caps), it’s a hard sell to buy the growth narrative in a “higher for longer” rates environment and today’s CPI report just confirmed the Fed is likely to stay higher for longer than the market would like.
Materials ⇩ -1.41 %
Energy ⇩ -1.01 %
Financials ⇩ -1.35 %
Industrial ⇩ -1.02 %
Technology ⇩ -1.70 %
Consumer Staples ⇩ -1.07 %
Utilities ⇩ -1.66 %
Health Care ⇩ -0.93 %
Consumer Discretionary ⇩ -1.99 %
Real Estate ⇩ -1.83 %
Communications ⇩ -1.41 %
Here are the 3 groups’ relative performance vs. the SPX.
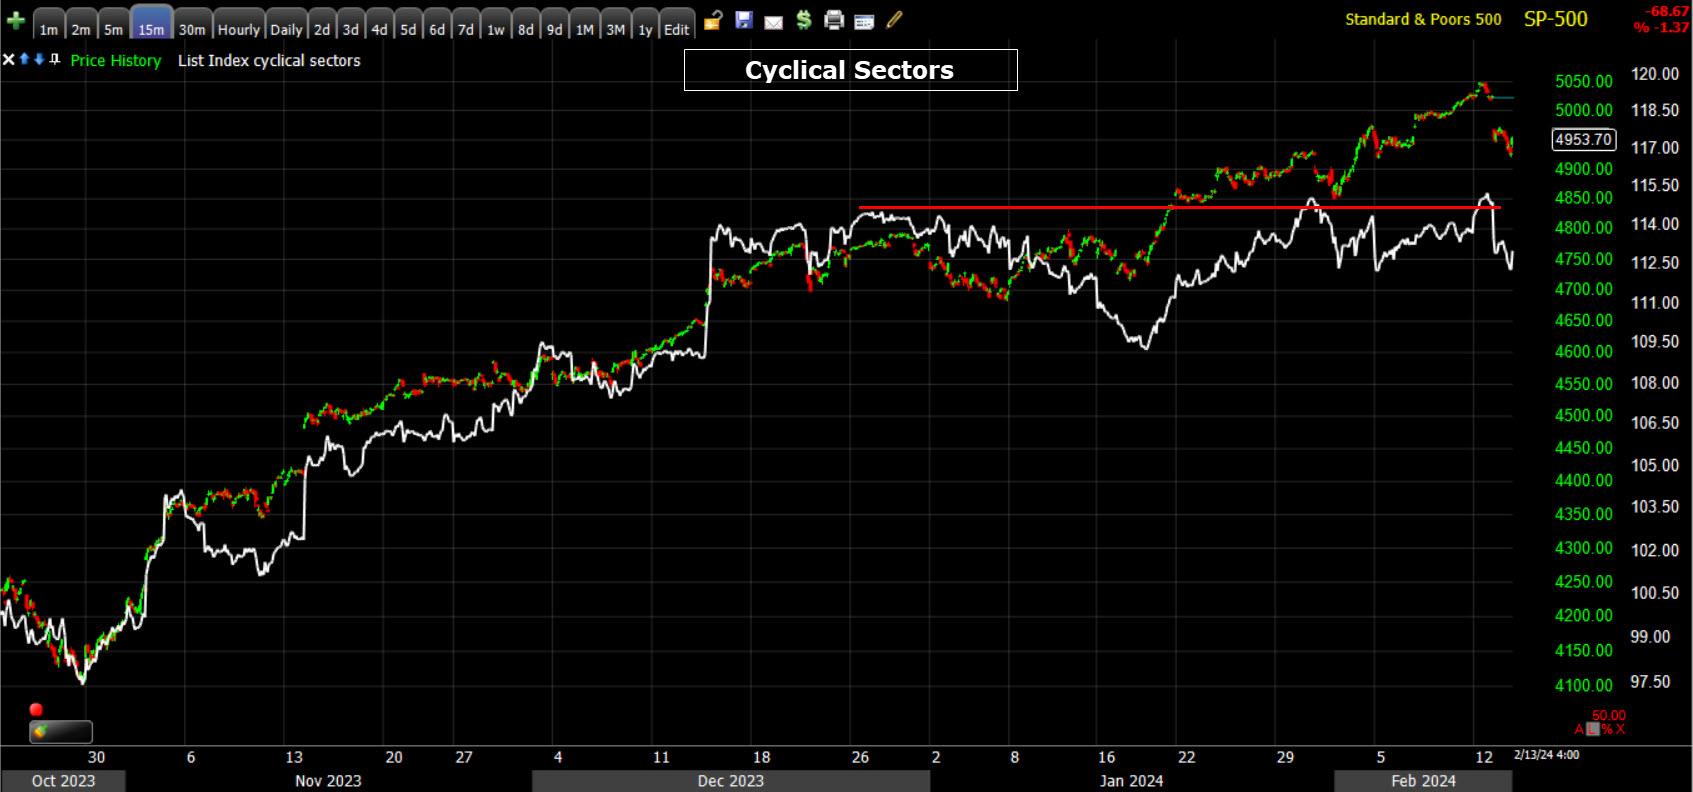 The cyclical sectors have done virtually nothing since December, much like the equal weighted S&P.
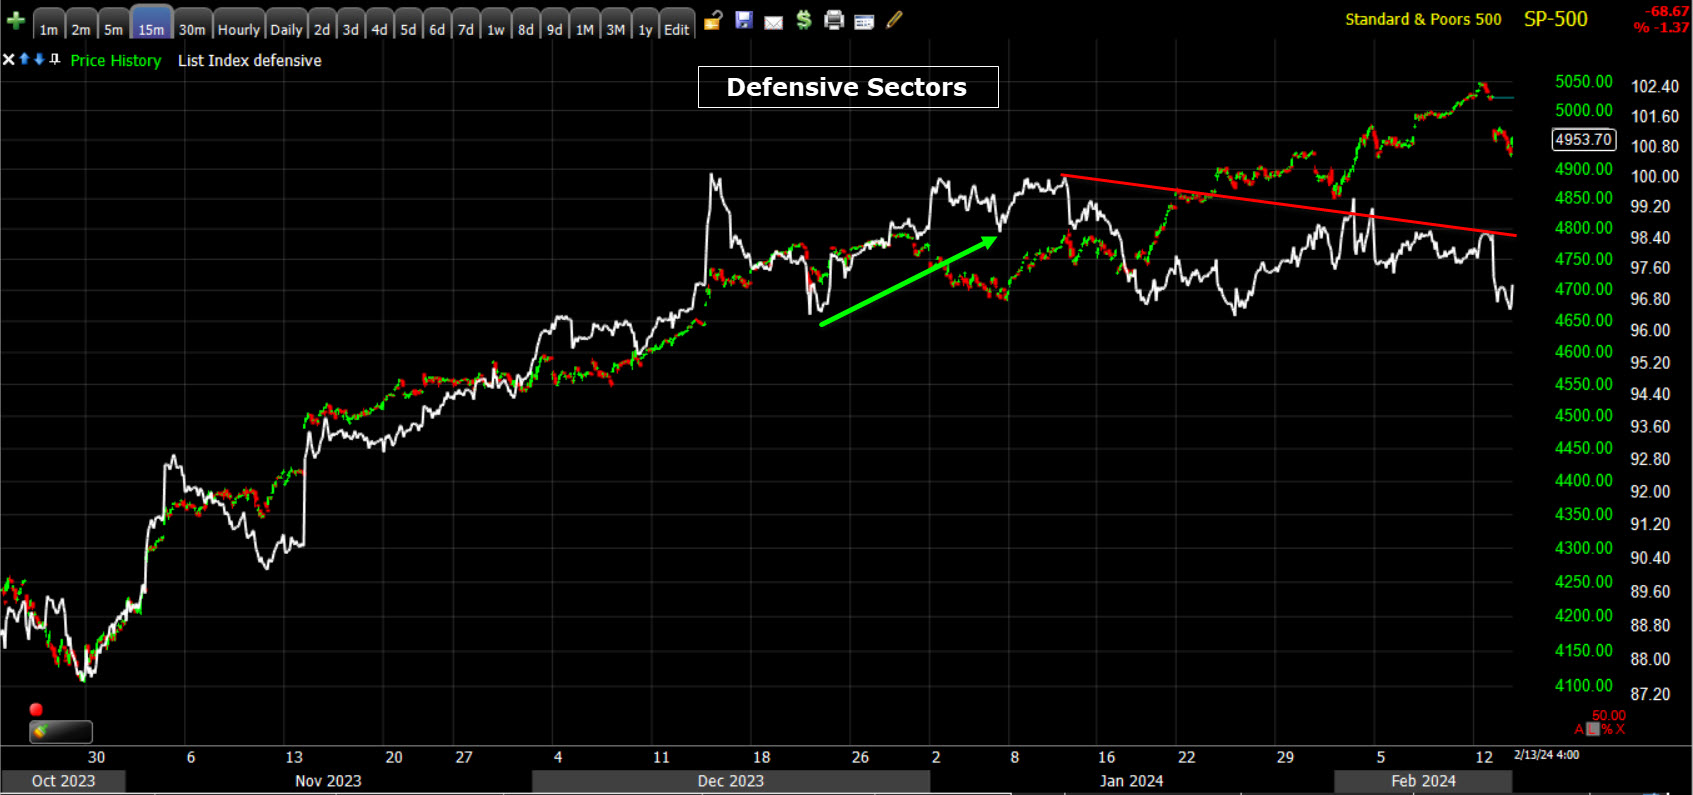 Defensive sectors tried to rotate in at the start of the year, but yields were just coming off their lows and that rotation to failed.
Health Care is included in the group above, but it’s not rate sensitive like the others so here are the others without healthcare.
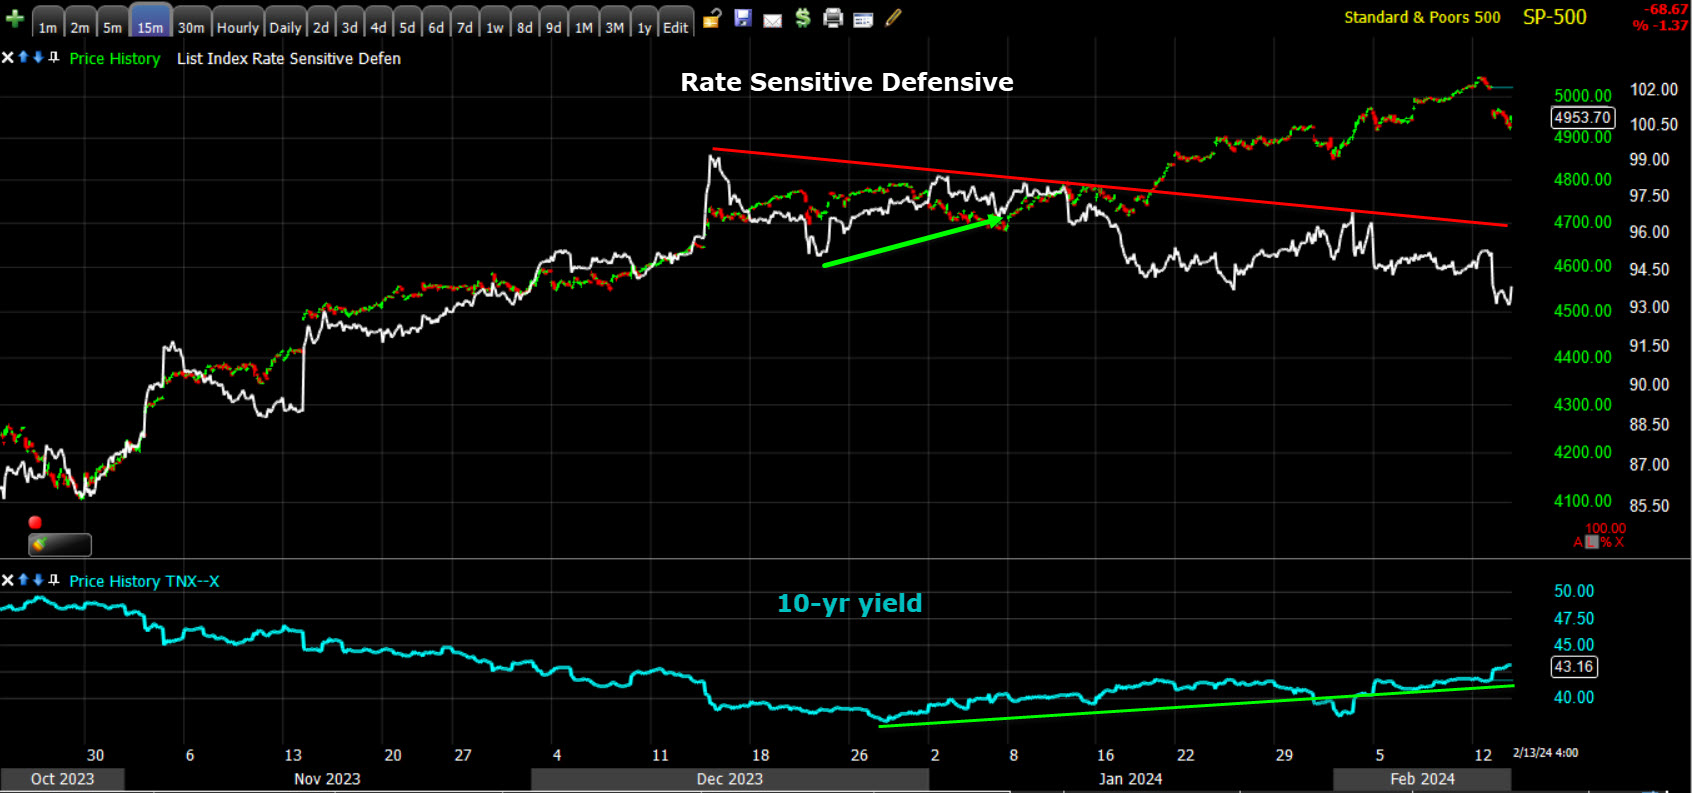 You can clearly see that the early 2024 attempt to rotate in was stymied by yields rising off their lows.
That leaves the only group that’s provided leadership – the mega-caps and even in that group the Magnificent 7 has turned into the “Fab-4” and the “Meh-3”
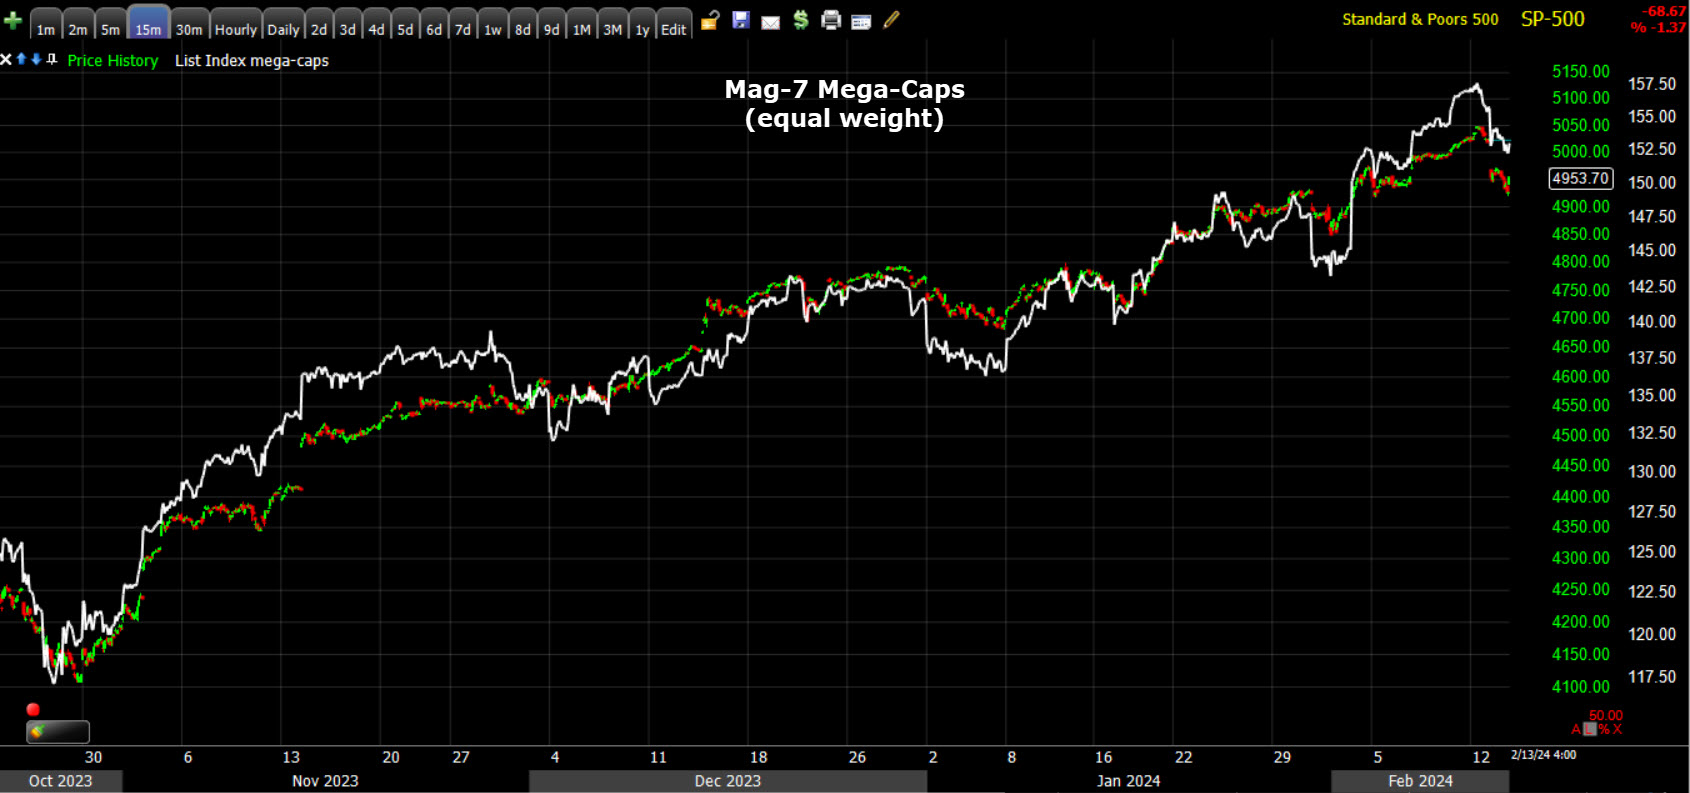 Mega-caps. The issue here is that market leadership is narrower and more concentrated than ever, and in richly valued stocks. Higher rates weigh on their very forward-looking valuations, which is why I’ve been writing almost every day that the 10-year yield above 4.20% is going to be trouble for the only leadership left in this market.
Internals
As you can imagine by the number of stocks that closed lower in the major averages, market breadth was abysmal. NYSE Decliners (2353) outpaced Advancers (237) by nearly a 10-to-1 ratio, slightly better than the 14-to-1 ratio this morning. That’s one of the biggest, broadest purges I can remember.
Somewhat surprising was the Dominant price/volume relationship came in at Close Down/Volume Down – that negates what would otherwise be one of the strongest 1-day oversold internals signals in my recollection. For that reason, we may very well see the averages see additional weakness in the morning. I used the Dow as an example in the Afternoon Update, suggesting it continue lower in the morning to meet it’s intraday bearish consolidation’s downside measured move. Here’s the chart and excerpt…
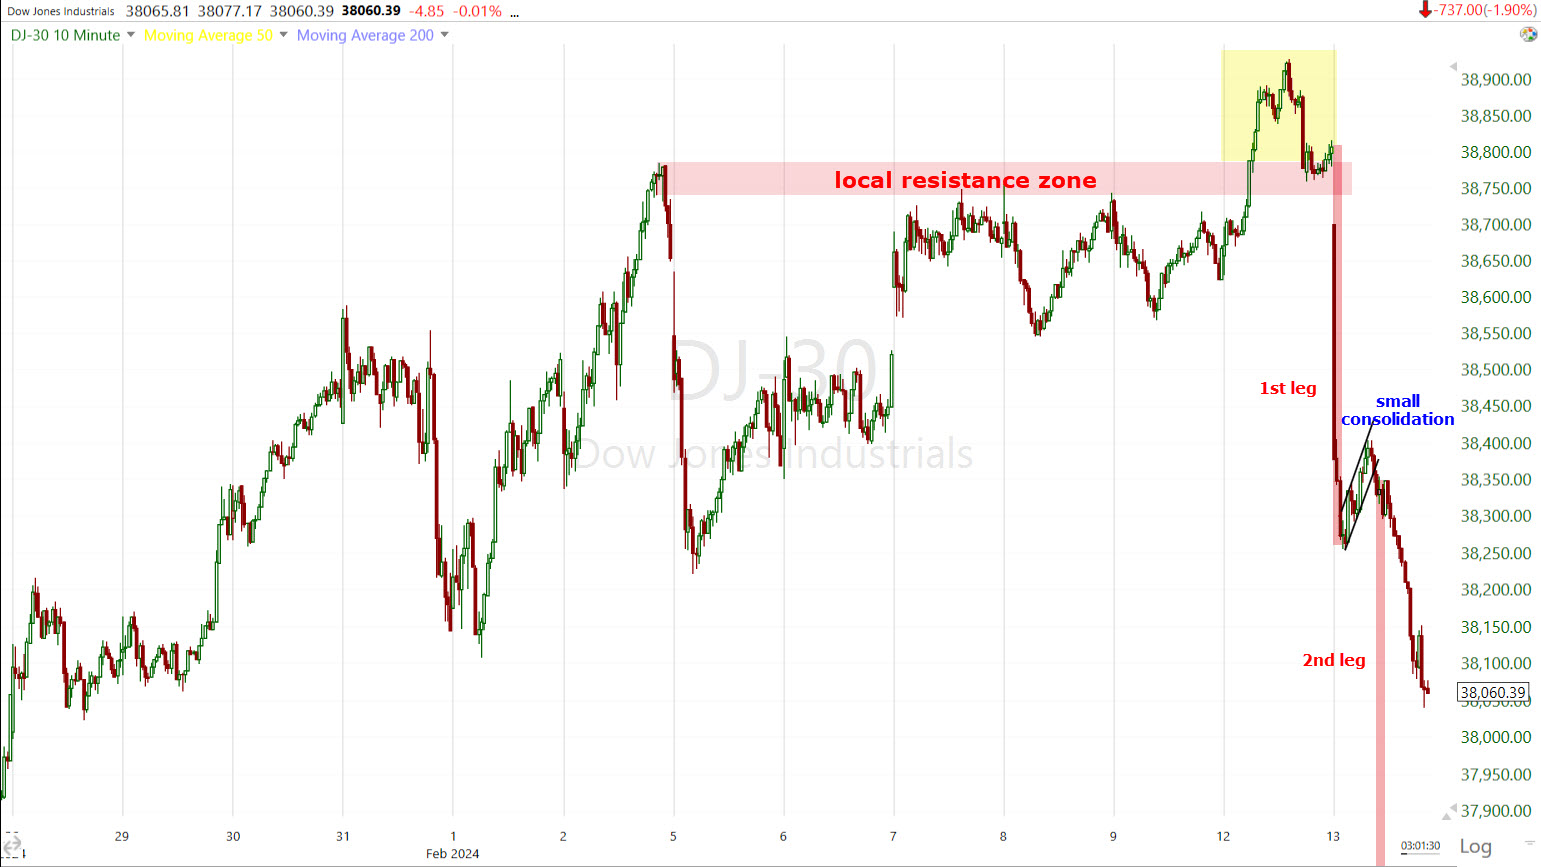 “Dow Industrial Average (10m) – There are a few bearish developments on the chart. The first is the short-lived, failed breakout above local resistance yesterday (yellow). “Failed breakouts often lead to fast price reversals”. The second is the small intraday bearish consolidation between what appears to be a second leg down. In this case, since we have the consolidation, we can estimate the second leg down’s price target for near term trade. This is a quick and dirty estimation, but I get $37,800. Price doesn’t need to fulfill it by the close. If it doesn’t, probabilities are that the rest will be filled tomorrow morning, at which point the 1-day oversold internals are likely to kick in.”
I think that’s probably a reasonable expectation given the late day buying appears to be day traders (shorts) taking profits before the close.
Otherwise, breadth oscillators are the most deeply oversold of the rally off October lows, hitting 8 intraday (scale 0 to 100) and settling at 16. I want to show you the chart…
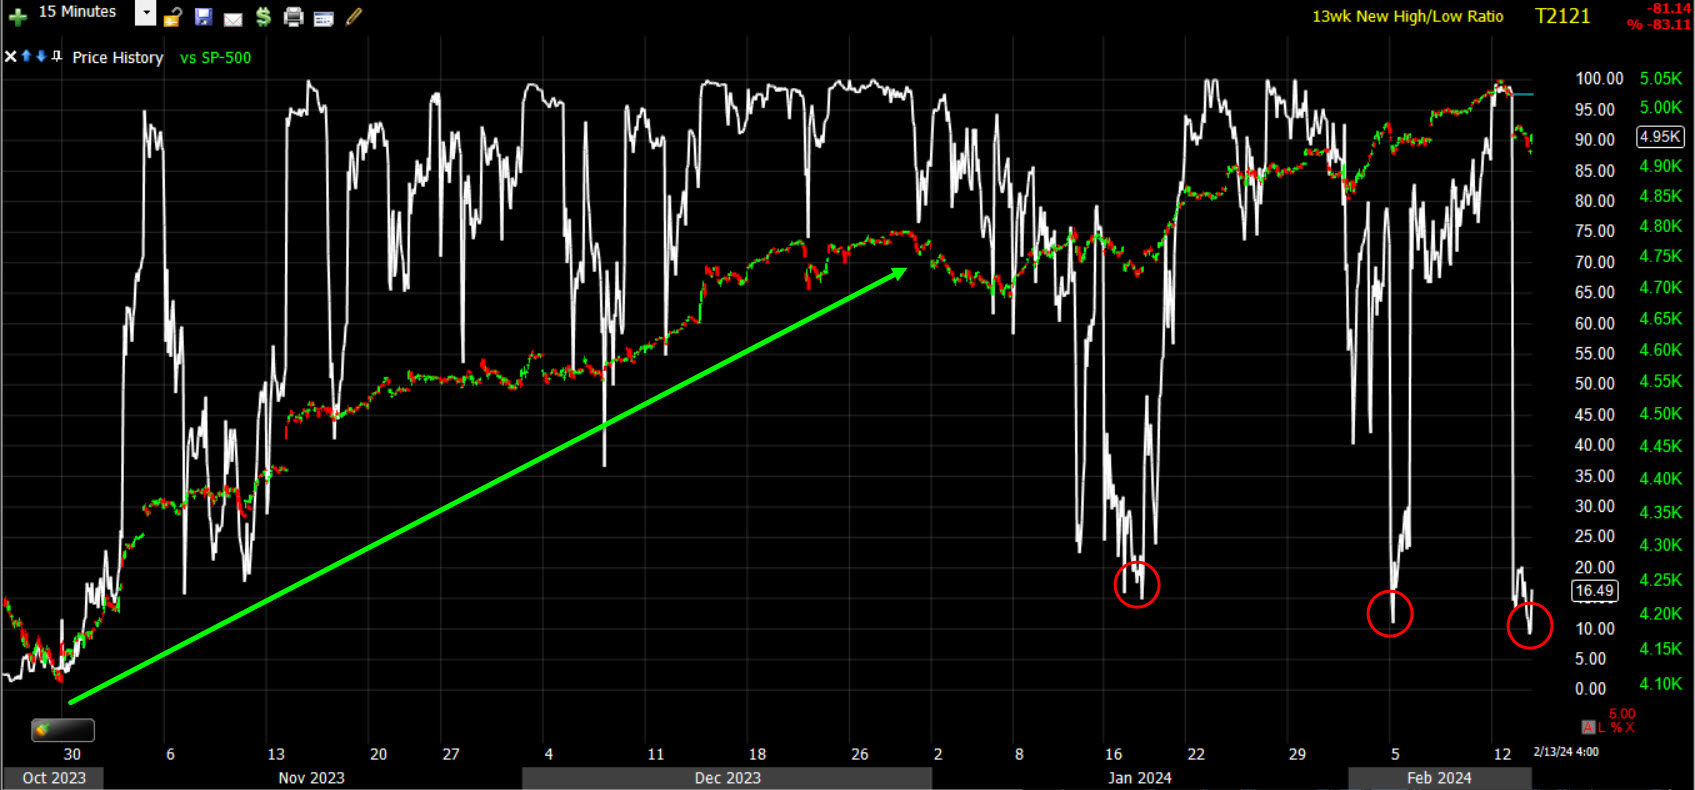 SP-500 (15m) and NYSE 13 week new highs/new lows. Notice the first two months of the rally (green arrow) off October’s low don’t see any really deep short-term oversold readings. Then in the New Year, we’re getting the kind of deep short-term oversold readings that you’d normally see after a 5% decline. This is not how a bullish market trading at new highs, at least not a healthy one, acts. The deeply oversold reading does mean it’s likely that we get some oversold bounces, or consolidations.
Oversold conditions get worked of through price (bounces/rallies) or time (price consolidations). Either way, it fits pretty well with my outline or game plan of what to expect in the next few days or perhaps weeks as outlined in the Afternoon Update.
I won’t run through all of the market breadth charts tonight, but I’ll be watching them closely over the next few days.
Treasuries
The 10-yr yield, which sat at 4.14% just before the CPI data, settled 14 basis points higher at 4.32%, well above the 4.20% resistance. The Fed-sensitive 2-yr yield, at 4.44% just before the 8:30 CPI report, jumped 20 basis points today to 4.67%. That’s basically one rate cut priced out just on CPI.
With higher yields, I figured HY Credit, which is already probably the most troubling leading market signal on my radar, had an ugly day with HYG -0.8% on HEAVY volume. More to the point, up until now HY Credit has not been confirming S&P gains in the new year, in fact rather than lead the market higher as it would usually do in a strong bullish environment that institutional investors trust, it’s made lower highs as the S&P made higher highs. Today it solidified a series of lower lows as well.
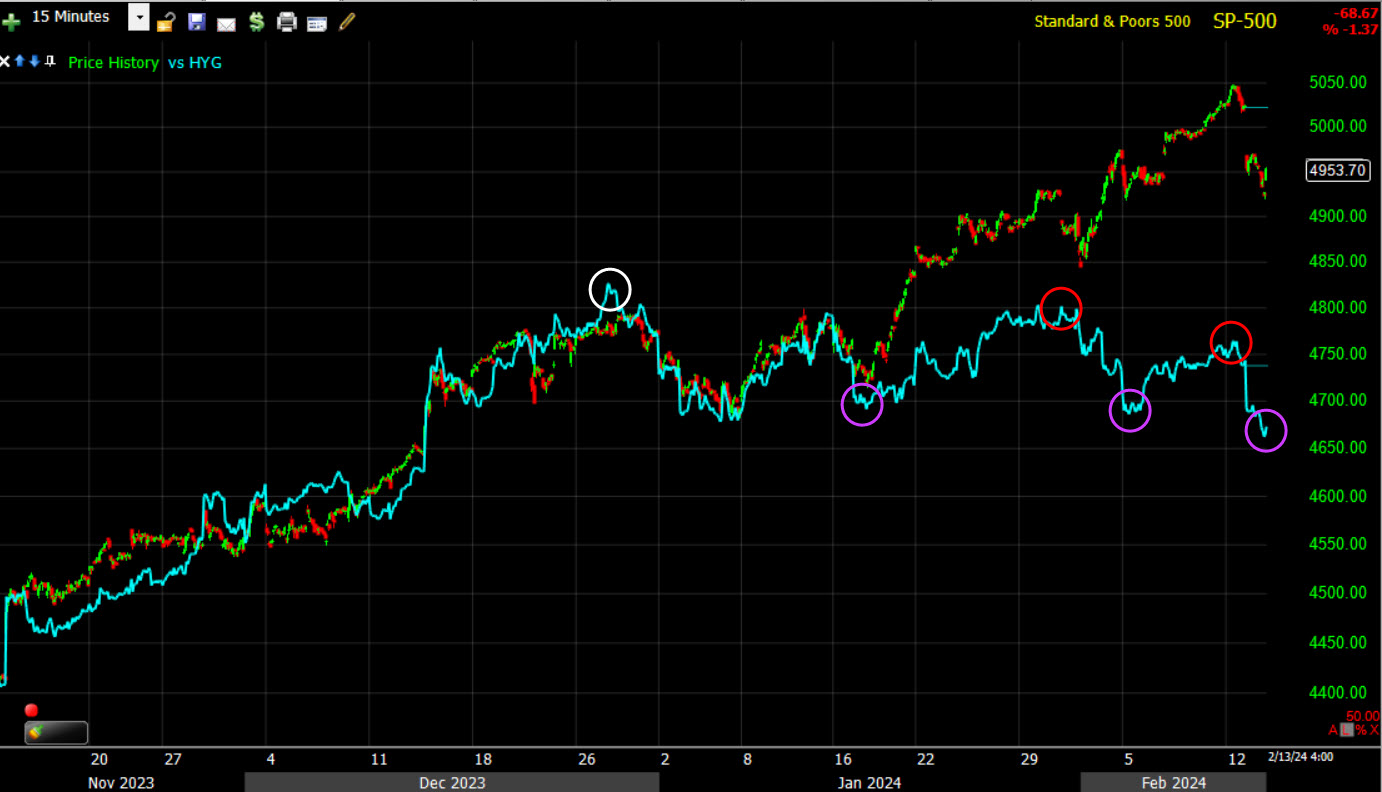 SPX (15m) and HYG (blue) making lower highs (red) and now a series of lower lows (purple). The relative performance and size of the divergence here is similar to VIX’s trend, it’s telling us that a much bigger story is unfolding than just a correction in the market’s rally.
Currencies and Commodities
The U.S. Dollar Index broke out of its bullish consolidation as bullish price action had been pointing to the probability of, gaining +0.75% (a big move for the Dollar)…
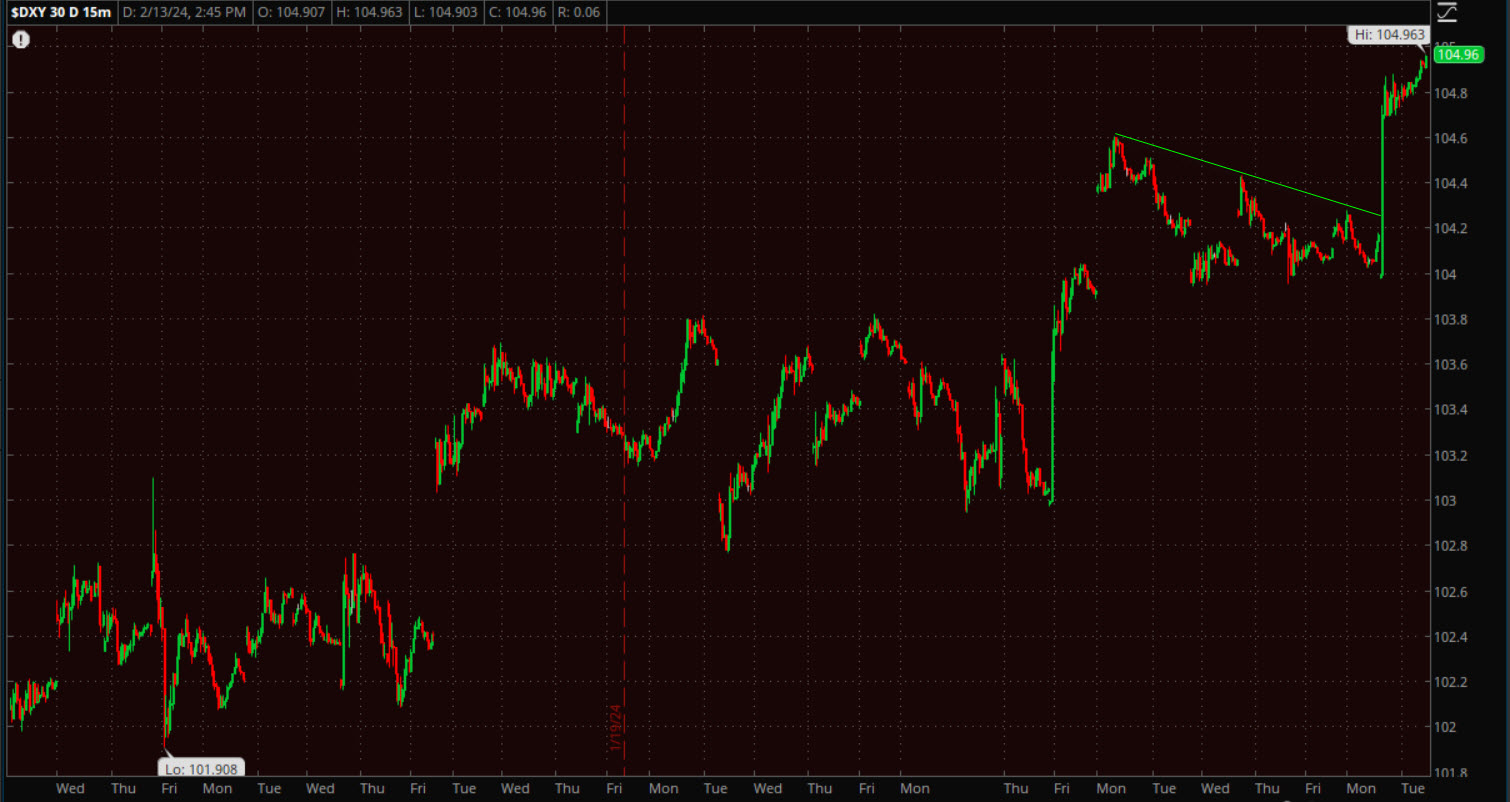 Dollar Index (10m)
And broke out above a technical resistance level at its 100-day…
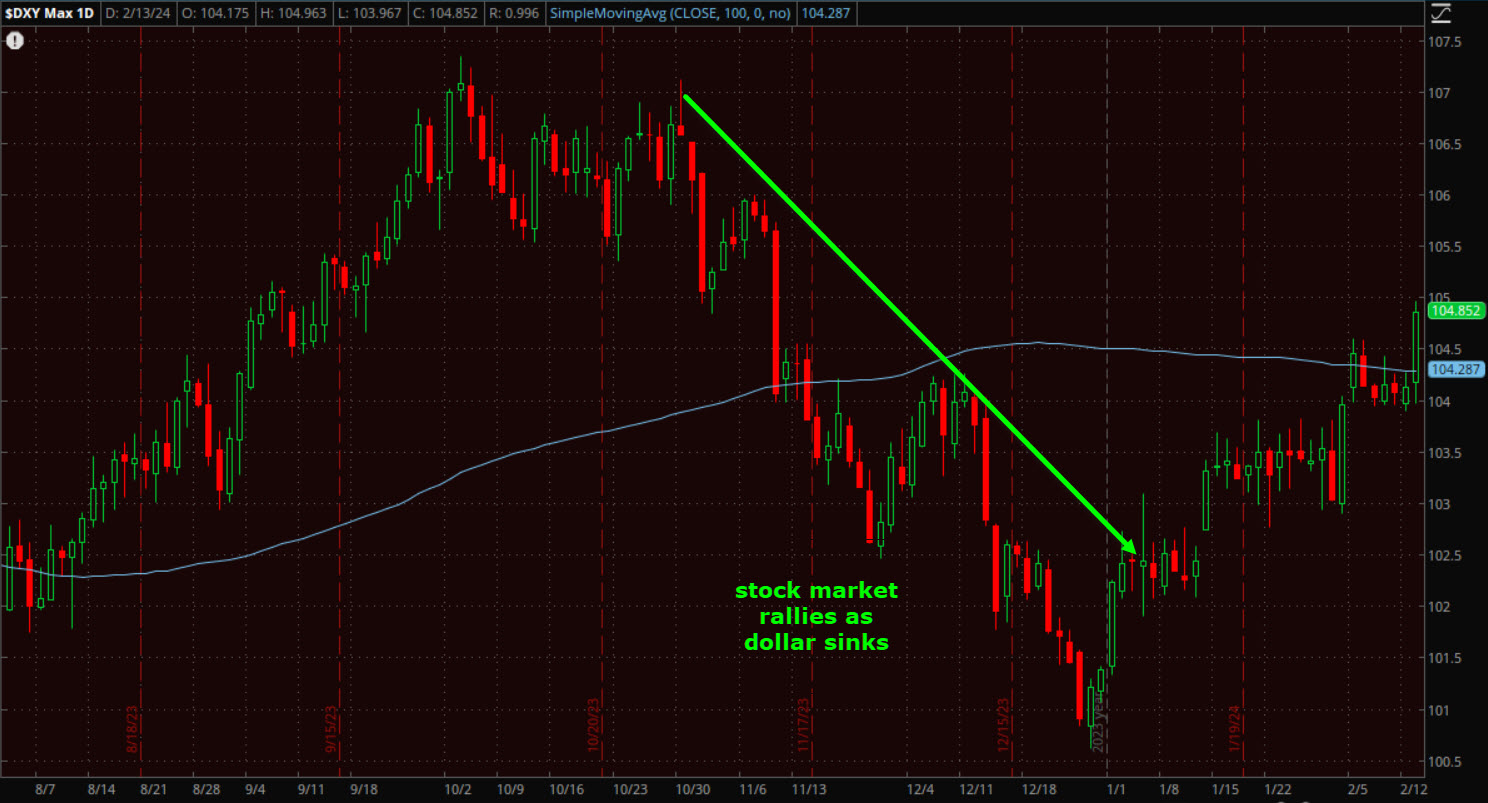 Dollar Index (daily and 100-day SMA) – the stock market’s rally off late October lows started as the dollar rolled over, but since then the Dollar has priced in the more hakwish Fed rate path for 2024, while stocks have not. The Dollar is now above its 50, 100 and 200-day moving averages.
One of the few assets to trade higher today was WTI crude oil futures, climbing 1.3% to $77.83/bbl. with price back above its 100 and 200-day sma’s.
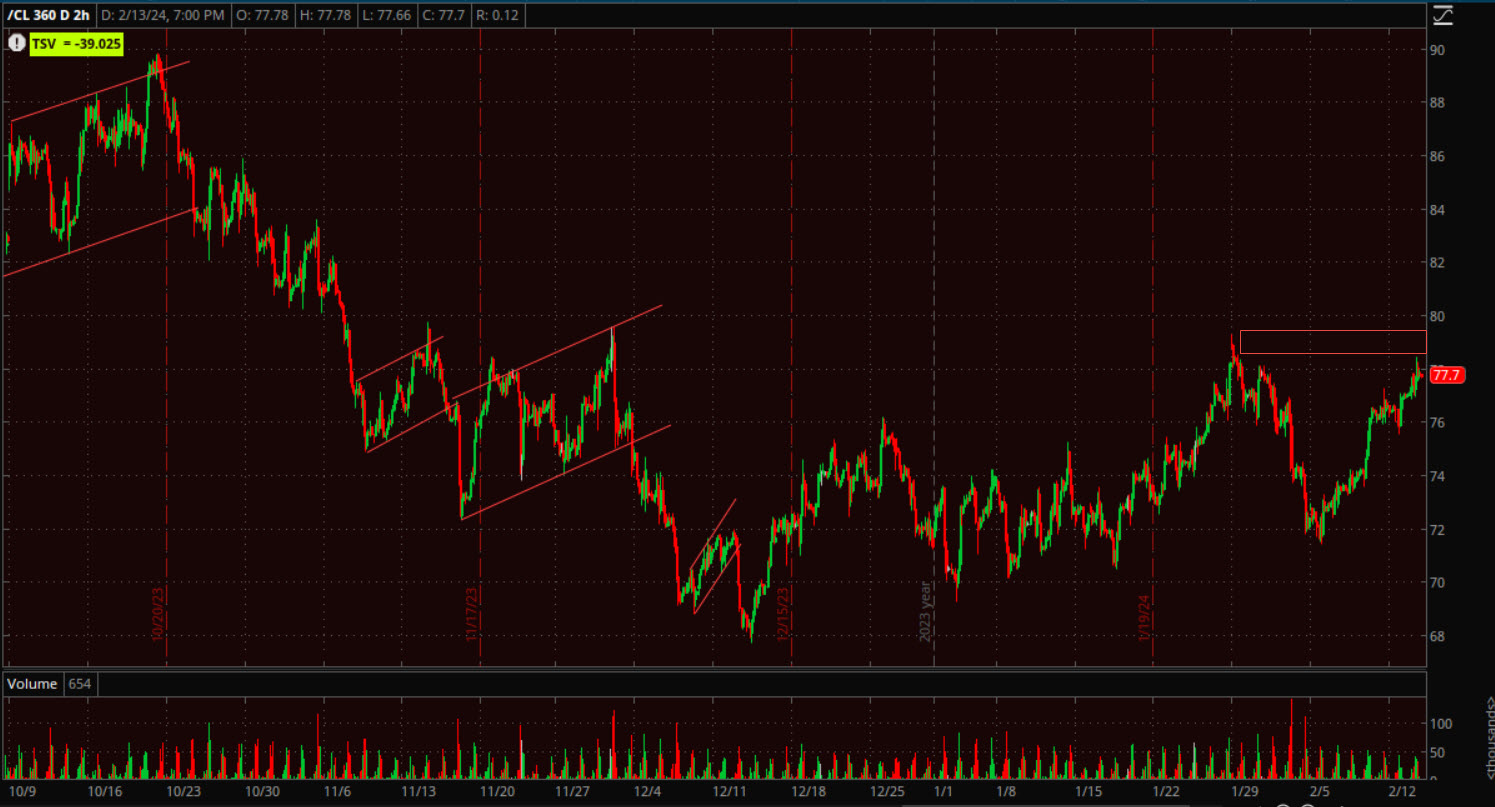 WTI Crude (2H) – While I’m watching Crude Oil closely, I’m not a huge fan of being long crude. It does have its work cut out for it near term with a resistance zone from here to $80. I imagine the biggest driver of oil prices will probably be the conflict in the middle east, and specifically the Houthi rebel attacks on Red Sea shipping.
The reason I’m so interested in what oil does is the “inflationary” bump, which has serious consequences for Fed rate policy, and thus the equity market. Yields have a pretty tight correlation with oil, although lagging by a few weeks.
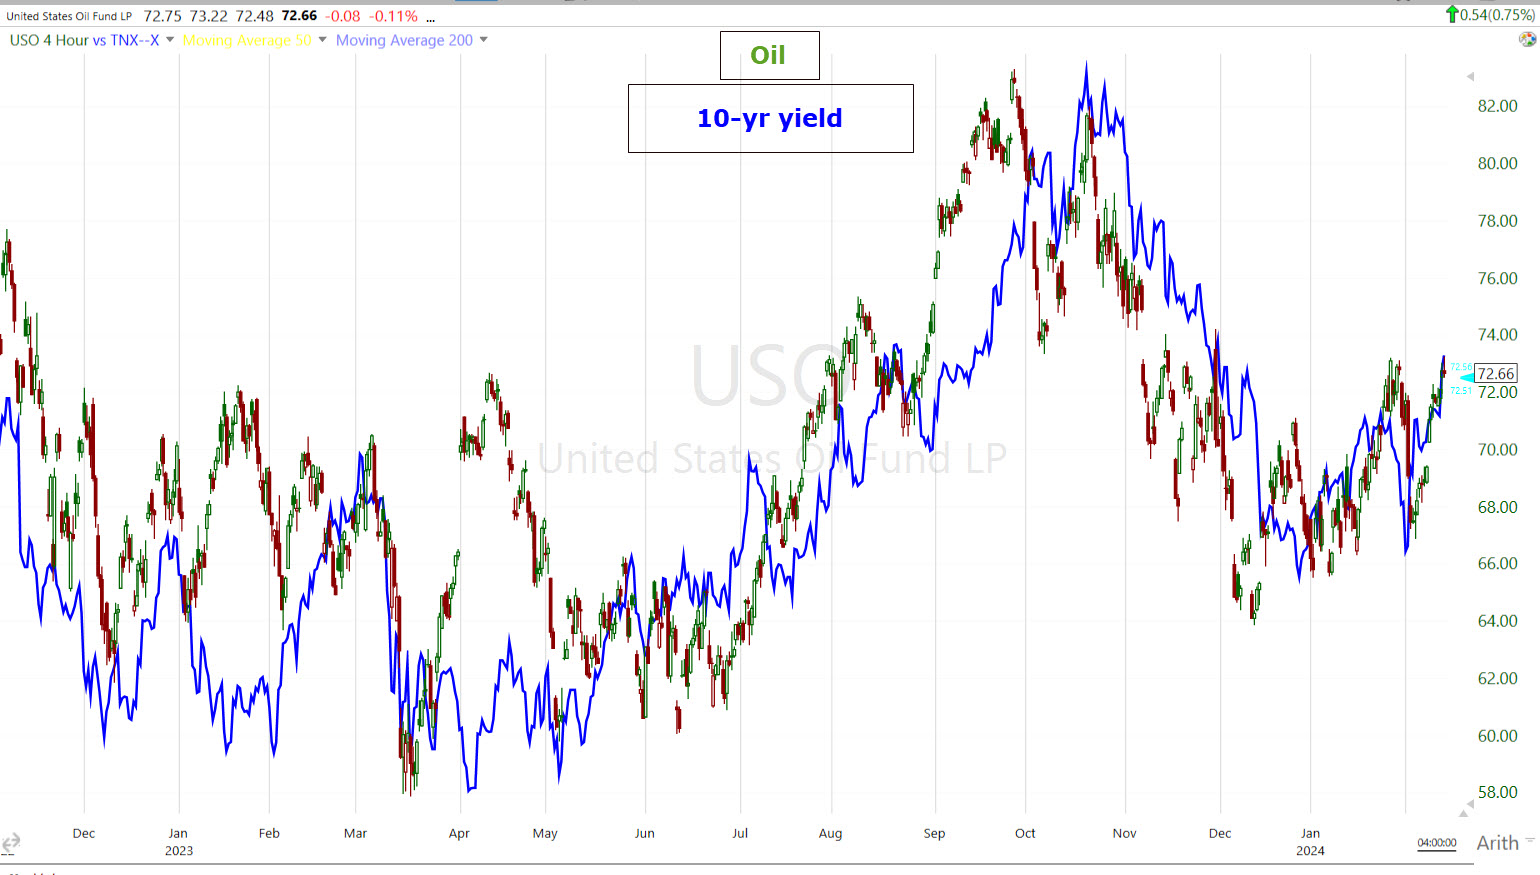 The higher oil moves, the higher rates move, the longer the Fed has to stay “higher for longer”, the more damage is done to the U.S. economy, the more it affects stock prices. I’d estimate that the 10-yr yield lags oil prices by 2 to 3 weeks on average. Of course there are numerous other factors, but oil price is a big one.
Gas prices are about to move higher, which will effect discretionary spending, and may just be a campaign issue in this election year.
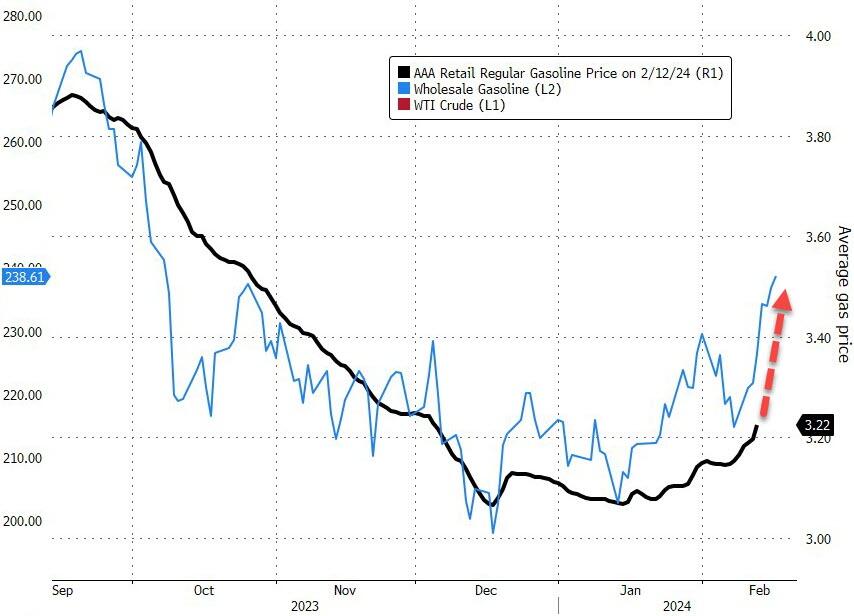
Source: Bloomberg
Ultimately I do think we see lower rates this year, I just think the equity market got carried away in pricing in the start of rate cuts, and I think (as is the historical precedent), stocks rally on rate cuts erroneously at this point in the economic/Fed rate cycle, but they always have as far as I can tell looking back more than a century.
Gold futures fell -1.3% to $2,007.20/oz, probing levels from mid-December. This isn’t what I’d prefer to see for gold in a vacuum as far as price action, although I have preferred to see gold consolidate around $2,000, but I’m not surprised either as I’ve expected a higher dollar and yields (both of which weigh on gold), which is why I’ve mentioned numerous times every week that Gold can trade lower and still retain a bullish bias. This is an excerpt from January 24th’s Daily Wrap,
“gold can trade even lower than that and still maintain the bullish consolidation, as long as price doesn’t trade below the December 11/12 area where the bottom trend line starts.”
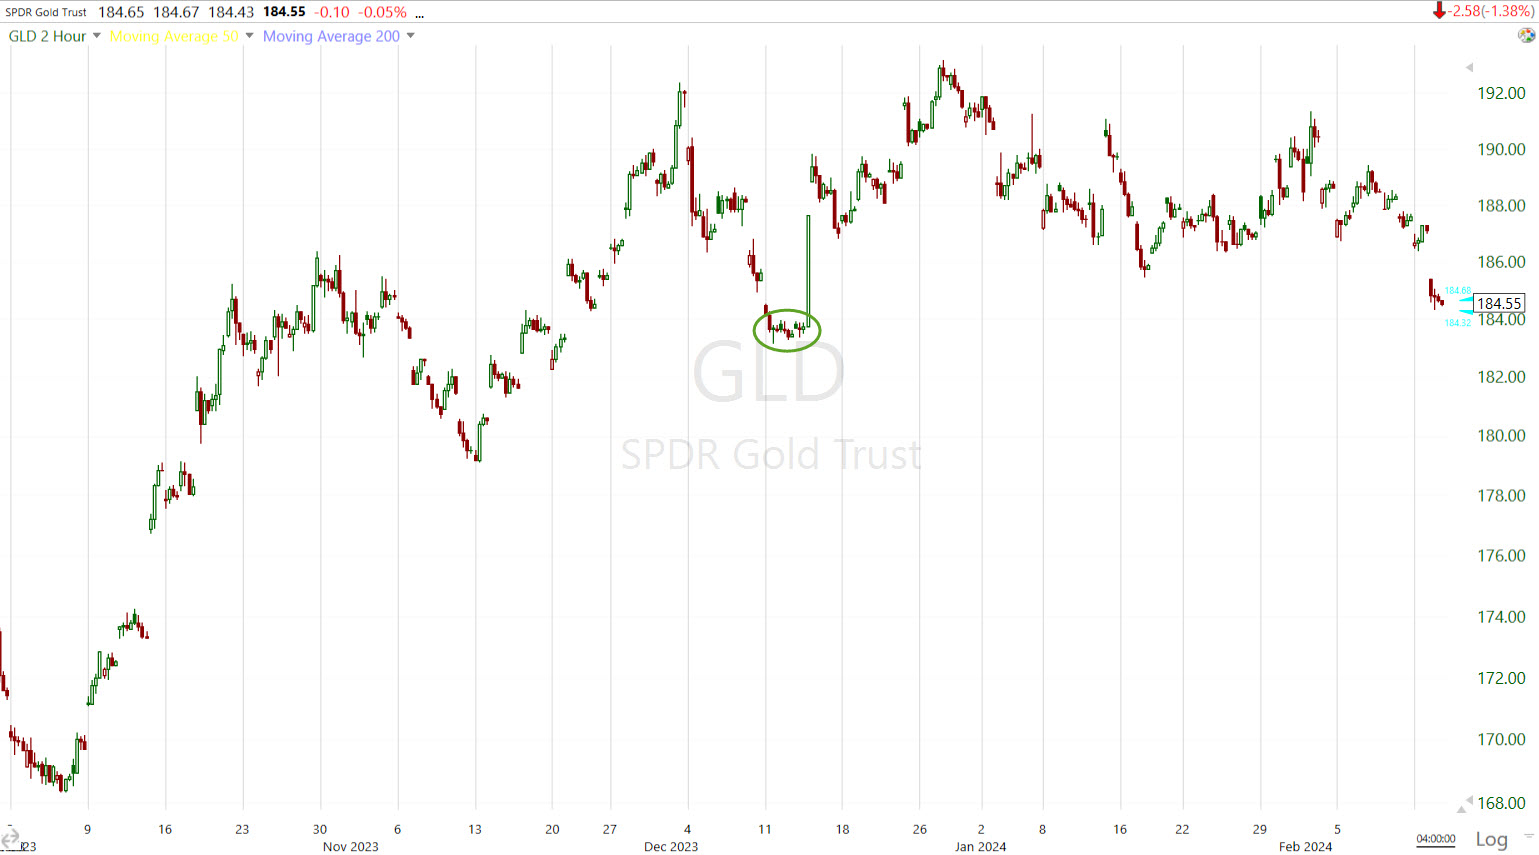
GLD (2H) the area referenced is circled green. Trading below that level constitutes a lower low within the trend, at which point gold would have to do more work to reestablish a new bullish consolidation or mid-term base. I think gold can do really well a little later this year (depending on the economy), but in the meantime, the more it bases/consolidates, the better it is for that eventual run higher.
URA fell -3.25%, trading below its 50-day sma where it found support yesterday. Just about everything was sold today, but I’m hoping that URA’s price climbs back above the 50-day in short order. It has had a strong tendency to hold the 50-day, but there have been times when it briefly traded below before regaining the 50-day.
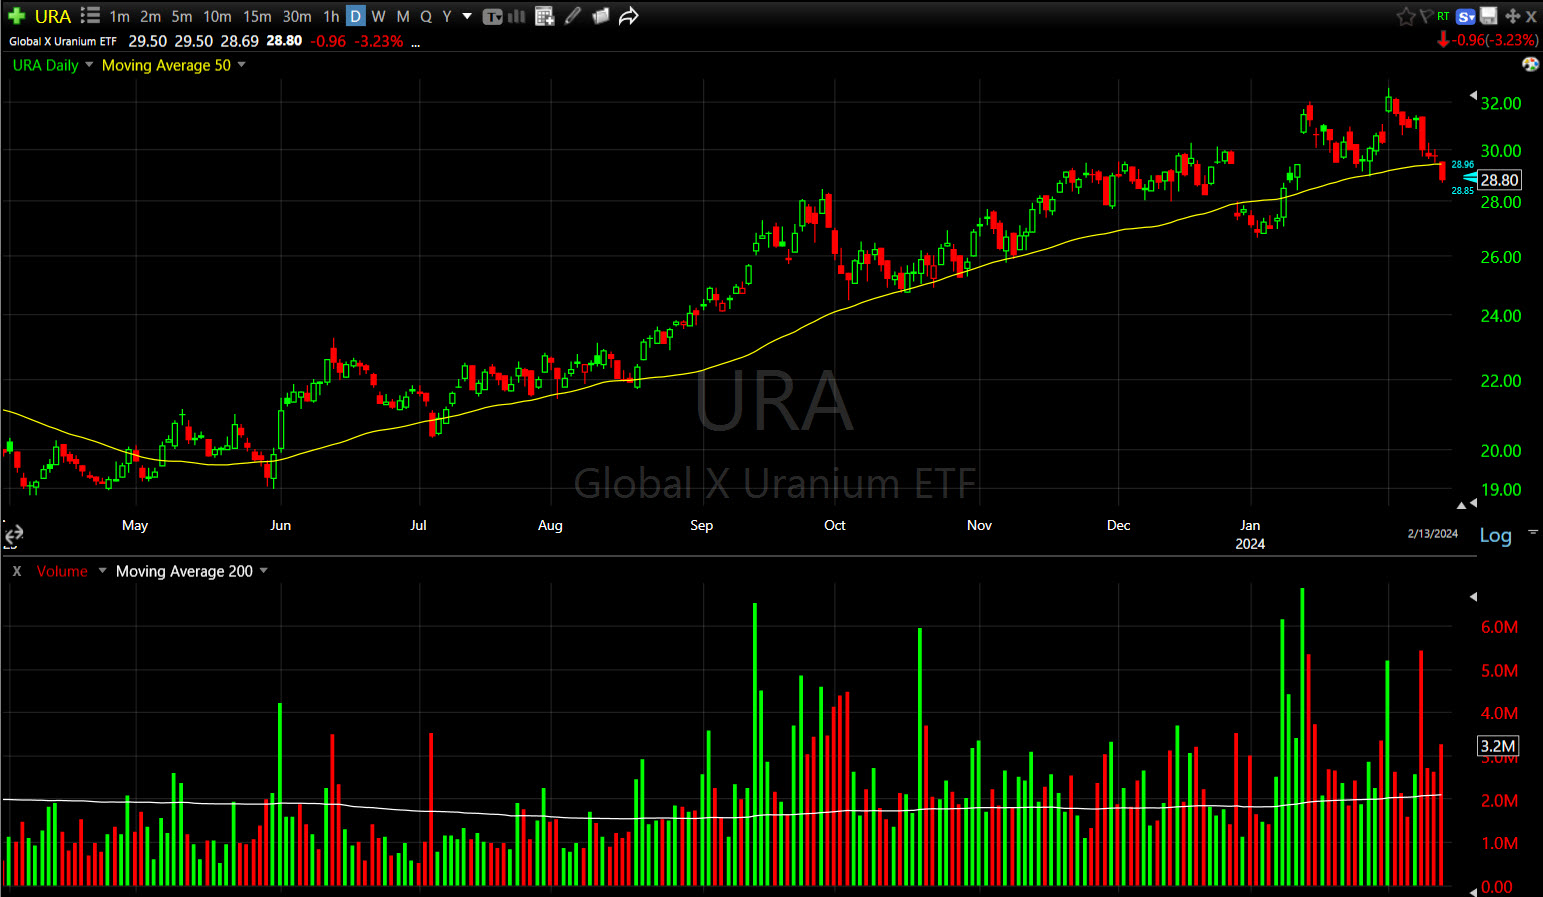 URA (daily) If you look closely at the chart, price traded below the 50-day last May, July and August before jumping back above, but if it’s going to jump back above, it should do it soon. The shorter-term 3C chart is acting like we typically see in a price consolidation/correction phase.
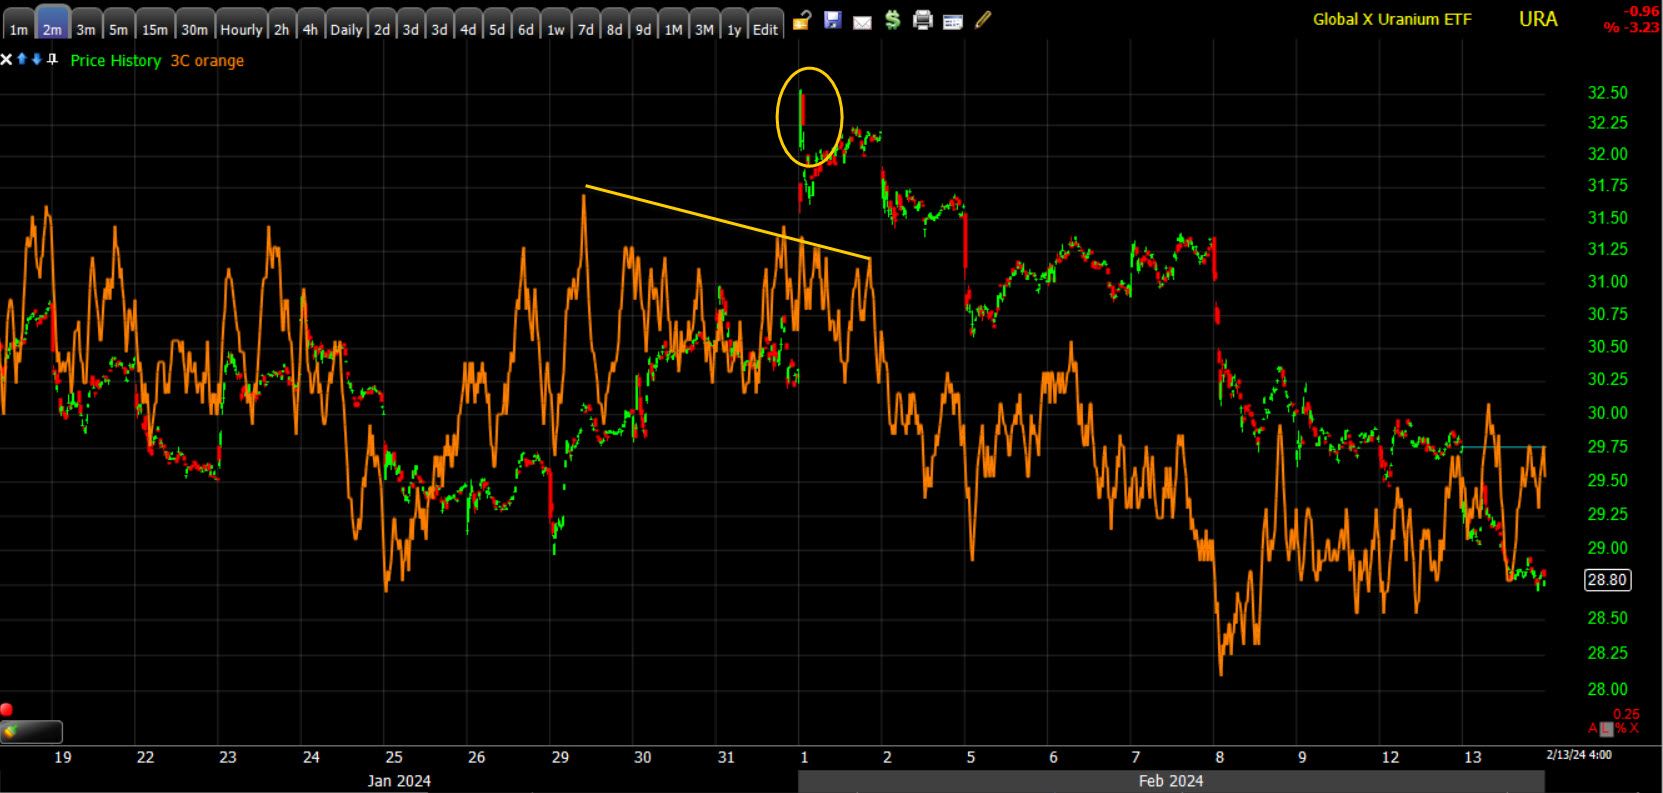 URA (2m) – this is pretty much what we almost always see headed into a consolidation (yellow) and the subsequent 3C action is typical of the consolidation itself. If I start to see some strong buyside movement on the chart I’ll send out an alert as a pull back to the 50-day has been pretty reliable support.
Bitcoin traded just above $50k before pulling back below.
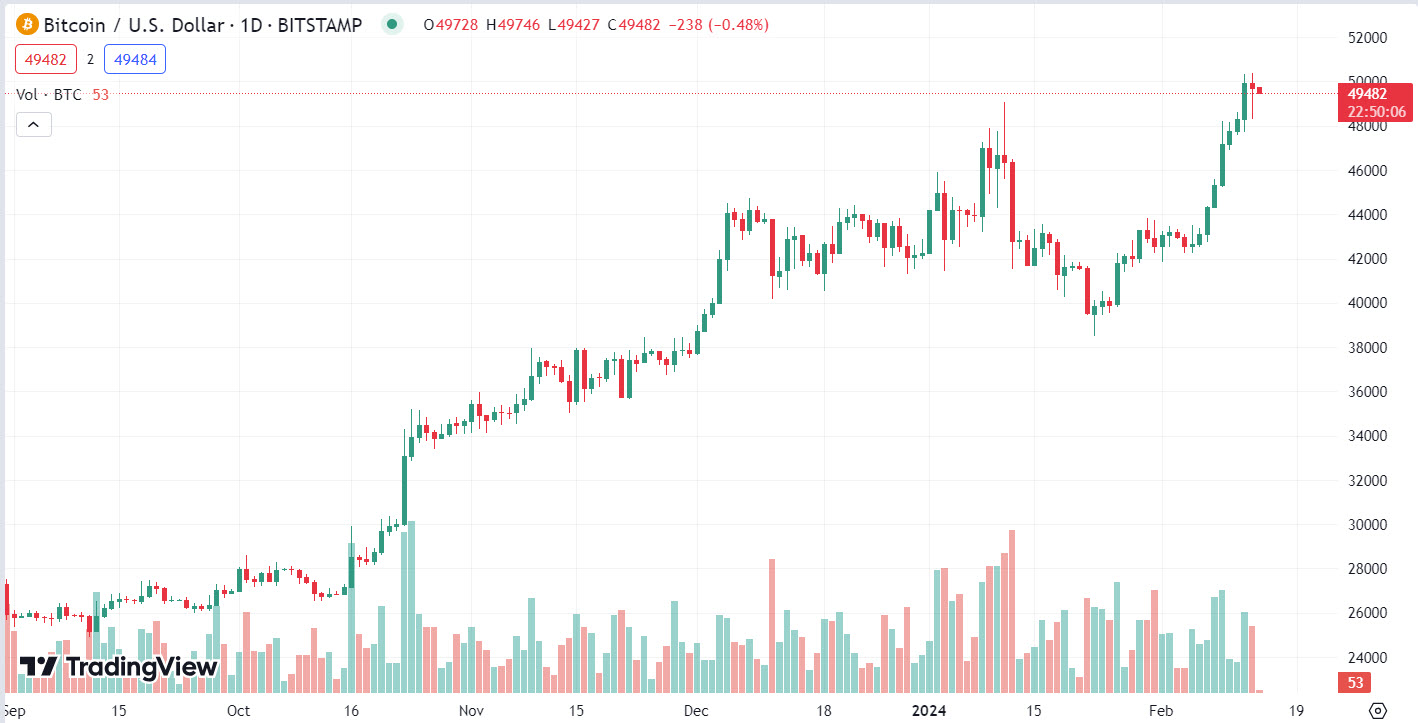 BTC/USD (daily) – Price/Volume hasn’t been stellar, but much better than the breakout toward the end of last year and into January, and holding up very well considering what happened to most every other risk asset today. I wouldn’t be too concerned about the rally unless BTC trades under $47,000, or unless the volume gets wonky.
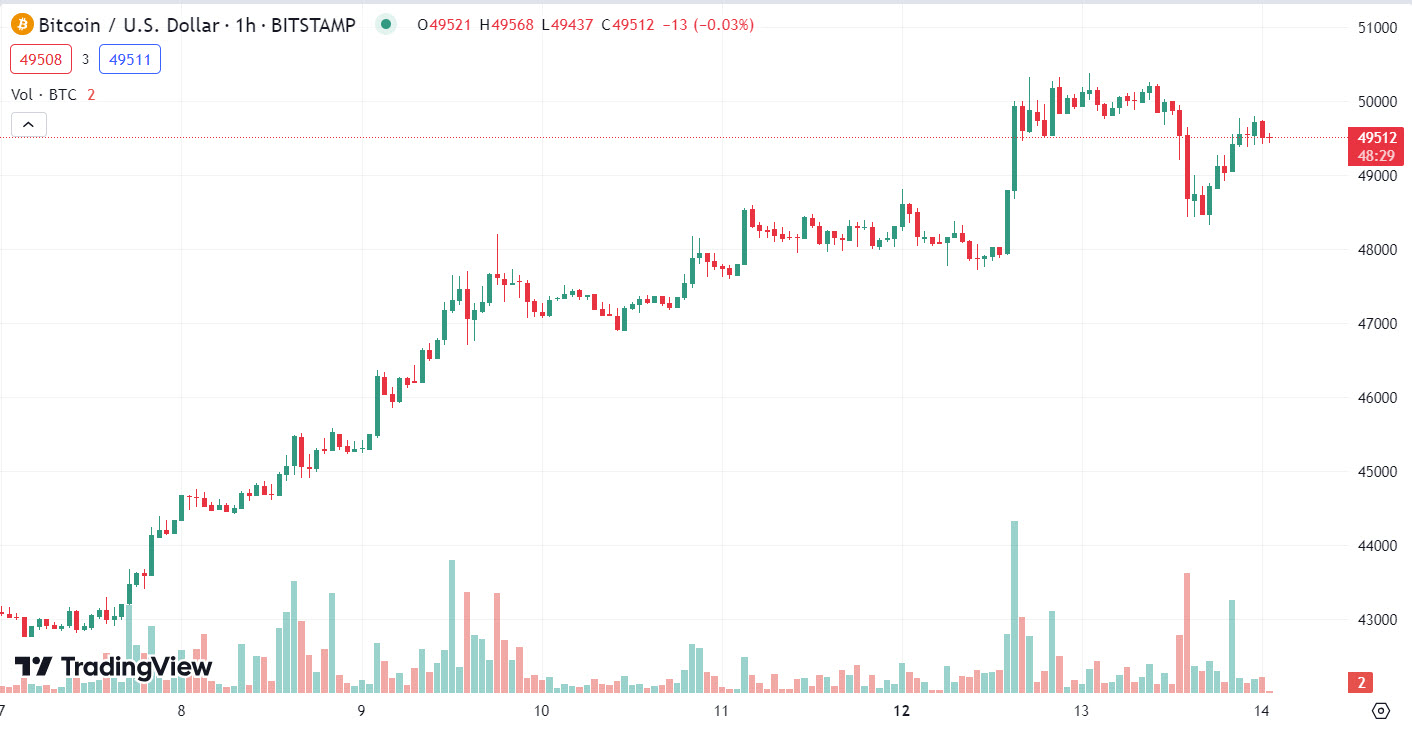
BTC/USD (60m) so you can see the $47,000 area and why I’d be more concerned if price traded below that.
Some of you expressed an interest in following up on FXI as a potential swing trade on the long side. I covered the overview of FXI in this post from last week. China is on holiday this week for the lunar new year so I don’t expect too much to happen until next week. What I’m watching right now is this price pattern…
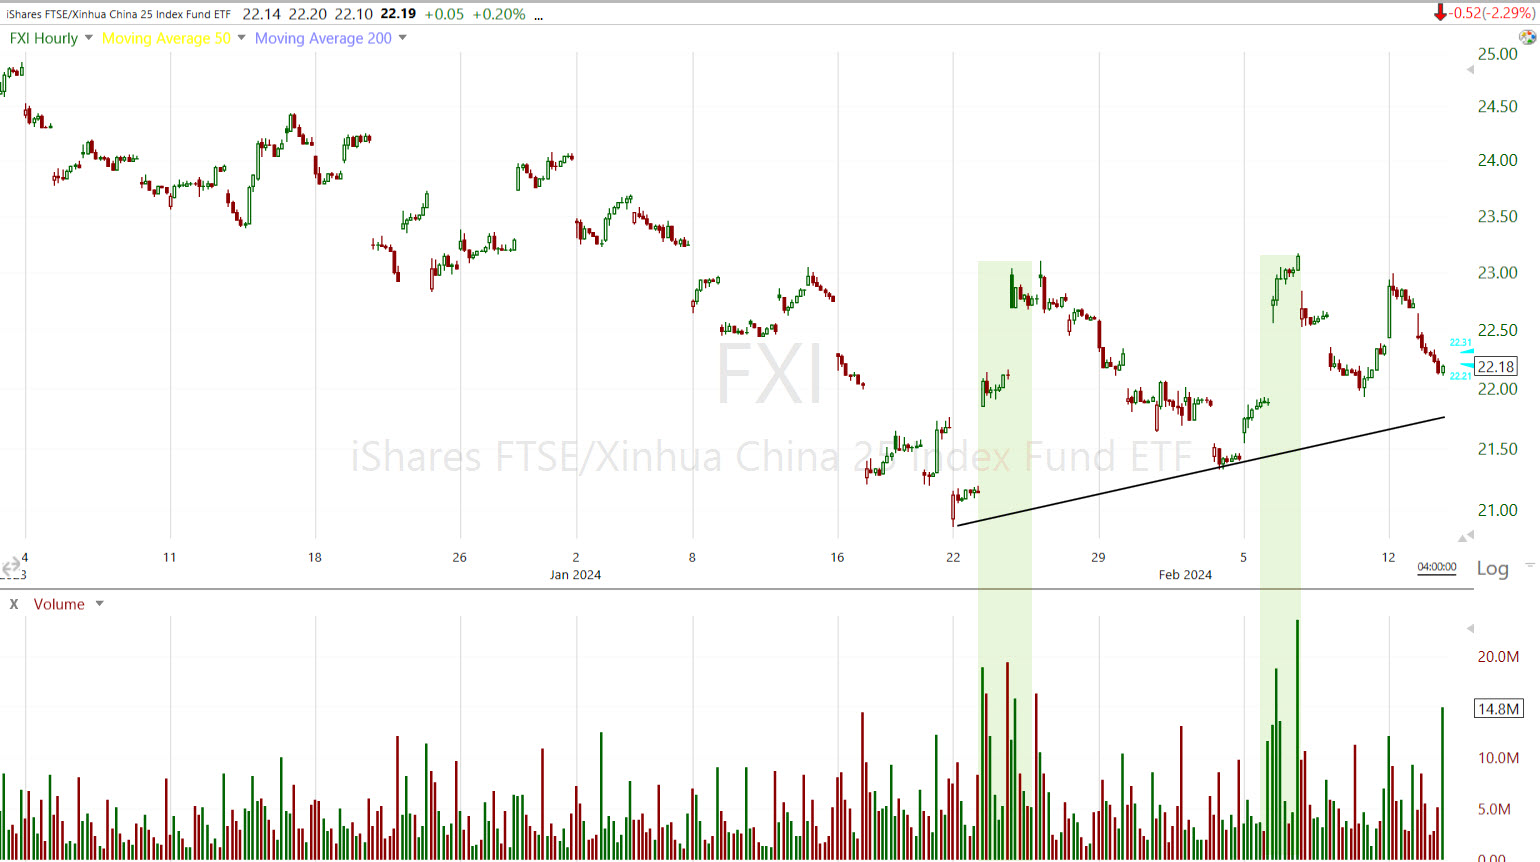 FXI (60m) – you may recall the heavy buy-side volume of the post linked above on a daily chart. That volume is buying on bounces off this trend line. It looks like a bullish ascending triangle with resistance at the $23 area. To be honest, you don’t usually find an ascending triangle in a verified downtrend, but it’s an improvement in price action. One potential play is a buy at the trend line with a TIGHT stop below. Remember this is an ugly downtrend, but has some interesting recent bullish developments. This is definitely a trade in which you want to have stops and tight risk management. The second approach is to wait for a breakout above the resistance zone of the consolidation, above $23. Or, wait for a breakout above $23, and then the first consolidation/pull back. If things continue to improve, the first consolidation after a breakout above $23 “should” be a bullish consolidation like a bull flag.
Each approach has it’s pros and cons. A but at the trend line allows you to place a stop very nearby and minimize risk, and offer a little more profit potential on a move upward. the second approach allows you to wait for a clear improvement in price action, increasing probabilities of a successful trade, and then to be able to (hopefully) buy the consolidation/pullback at slightly better prices. I’d probably place a stop at the $23 area with the second approach. If you haven’t already, make sure to read the overview in the post linked above. I see this as swing trade, maybe a trade that can last a month or two even, but I do not see it as an investment or longer term position and you’ll understand why with the background provided in last week’s post. Anyone interested can email me anytime about it.
Summary
I can’t find the exact quote, but last week I said that I wouldn’t be surprised to see a crack in the market over the next week. I said something similar last Wednesday in the Daily Wrap – “Market Breadth Is Concerning” just before the S&P closed above 5,000.
“I expect it [the S&P] will cross above 5,000, but considering the mounting evidence, I have serious doubts the S&P builds on to gains above 5,000. In fact, I wouldn’t be surprised to see a scenario reminiscent of the S&P’s price action in to July’ $4600 level that produced a Key Reversal Day once the mass psychological magnetic pull of $4600 had been reached.”
In the very short-term, as in tomorrow, I wouldn’t be surprised to see some early price weakness and then short-term oversold dynamics kick in. We don’t have any really consequential economic data tomorrow so that should be helpful for the market, as well as volatility rolling. Otherwise, I think the gap today is key in what happens over the next few days, maybe a little longer as in couple of weeks. I’ll let the Afternoon Update (click the link) stand until I see more from the market. I suspect we see some volatile chop and some sort of topping price action. Seasonally the second half of February tends to be a weak period for stocks as well.
Overnight
Index futures are basically flat pretty much across the board tonight. 3C has not improved tonight, and in some cases is a little worse and still bearishly biased.
Russell 2000 futures are the best of the bunch with a +0.15% gain, but 3C is still leading lower.
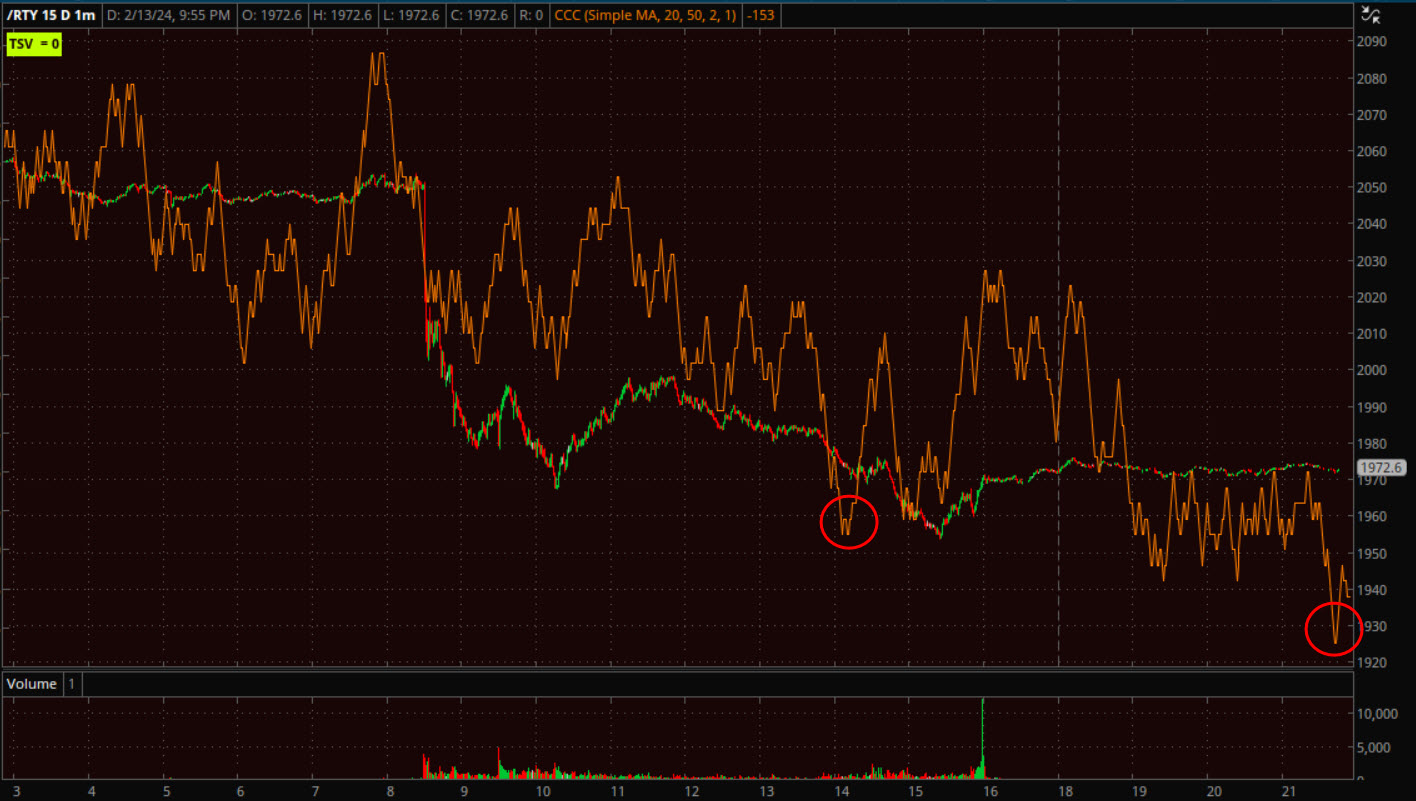 RTY (1m)
The U.S. Dollar Index is down -0.1%, but price action retains a bullish bias (not good for stocks).
WTI Crude Oil futures are down -0.2% and just consolidating gains. Remember that price is nearing some decent local resistance.
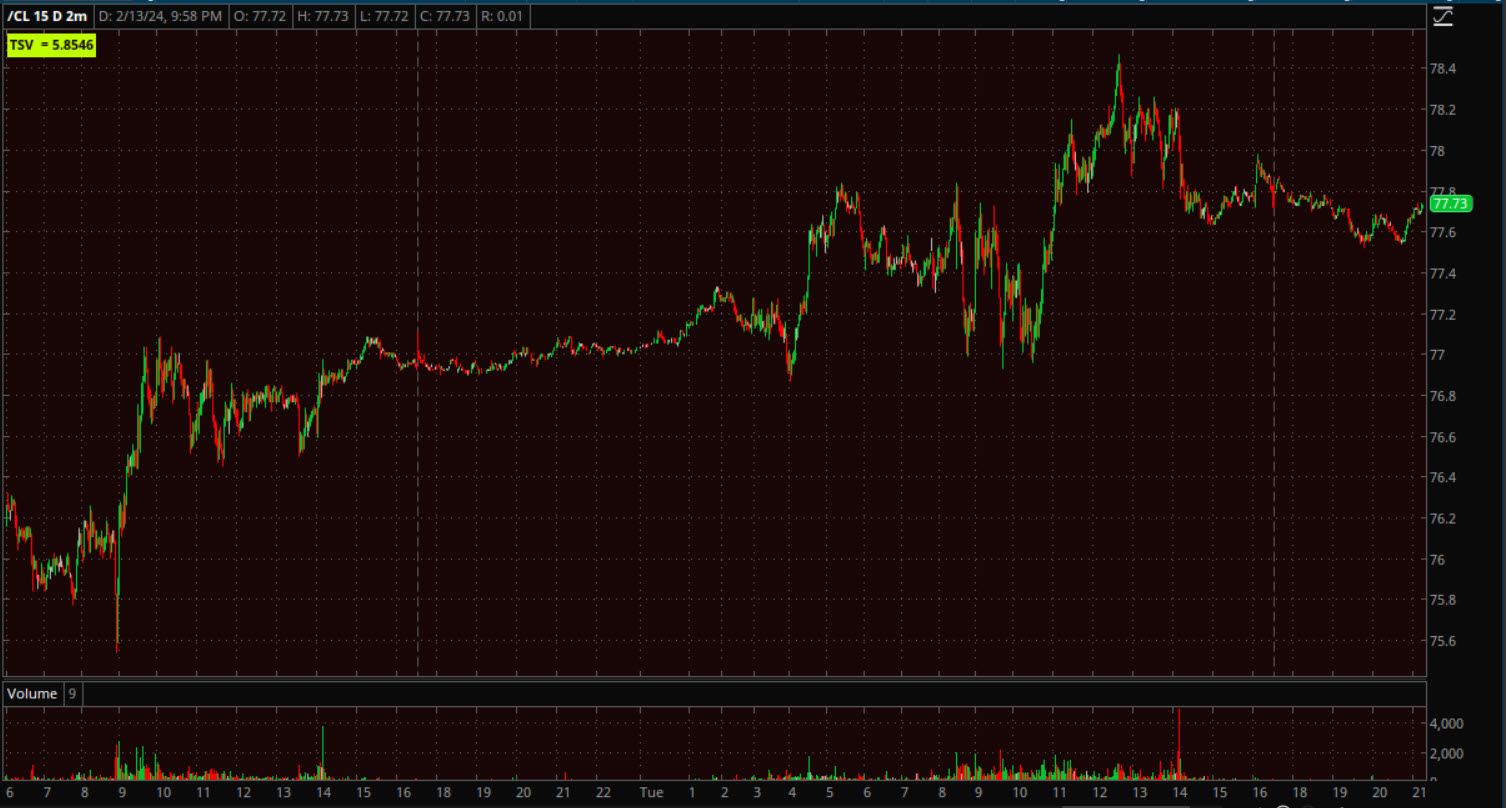 WTI Crude (2m)
Gold futures are down -0.1%.
Bitcoin futures are are up +0.4%, but pulled back after crossing above $50k. Price action in the next couple of days will likely tell us a lot about what comes next. Remember that big whole numbers like $50k are psychological magnets that pull price to them, just as we saw with the S&P $5,000, but that doesn’t necessarily mean price can build onto gains.
The 2-year yield is down -1.7 bp and the 10-year yield is flat. The Fed-sensitive 2-yr has already discounted higher for longer with nearly the equivalent of 1 rate cut priced out today so I don’t expect much movement there unless there’s new economic data. At this point it’s the 10-yr I’m watching closely.
Wednesday’s economic calendar features:
- 7:00 ET: Weekly MBA Mortgage Index (prior 3.7%)
- 10:30 ET: Weekly crude oil inventories (prior +5.52 mln)