There’s a highly unusual trend of relative strength in VIX. Normally the S&P at a new record high would see VIX at, or near, historical lows. The S&P trending higher would typically see VIX trending lower. However, recently the equity market has been making new record highs, but VIX has been trending higher, not lower.
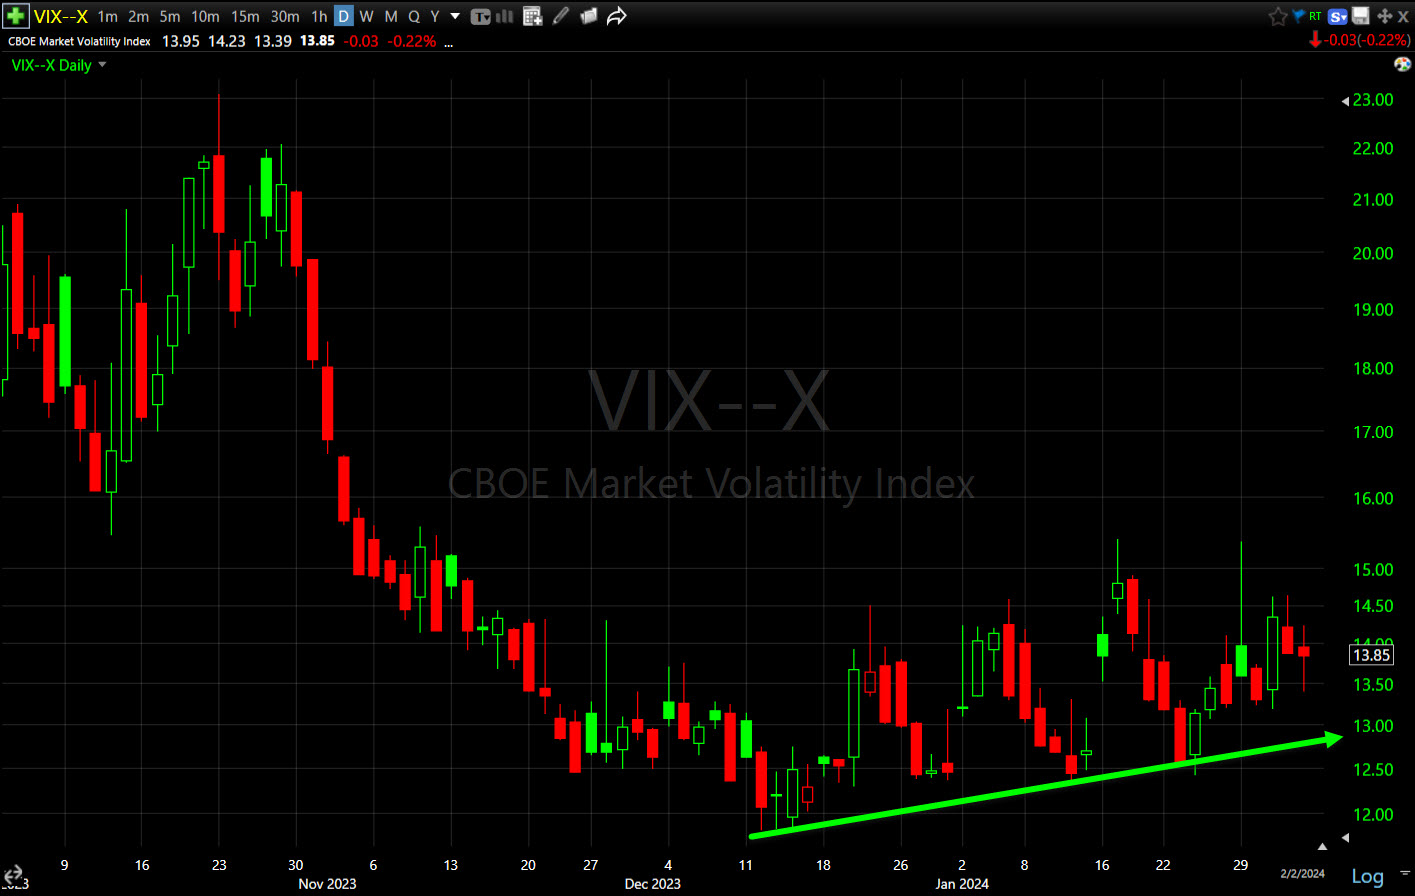 VIX (daily) – Because VIX is not making big daily moves, this kind of unusual price trend flies under the radar of most investors, but I first noticed this unusual type of trend back in 2007. At the time I had no idea what it meant, but after decades of doing this, I’ve spent a lot of time investigating the phenomena. It’s rare, maybe only happening once every several years and almost always as the market is in full bullish melt-up mode.
A few examples… 2023
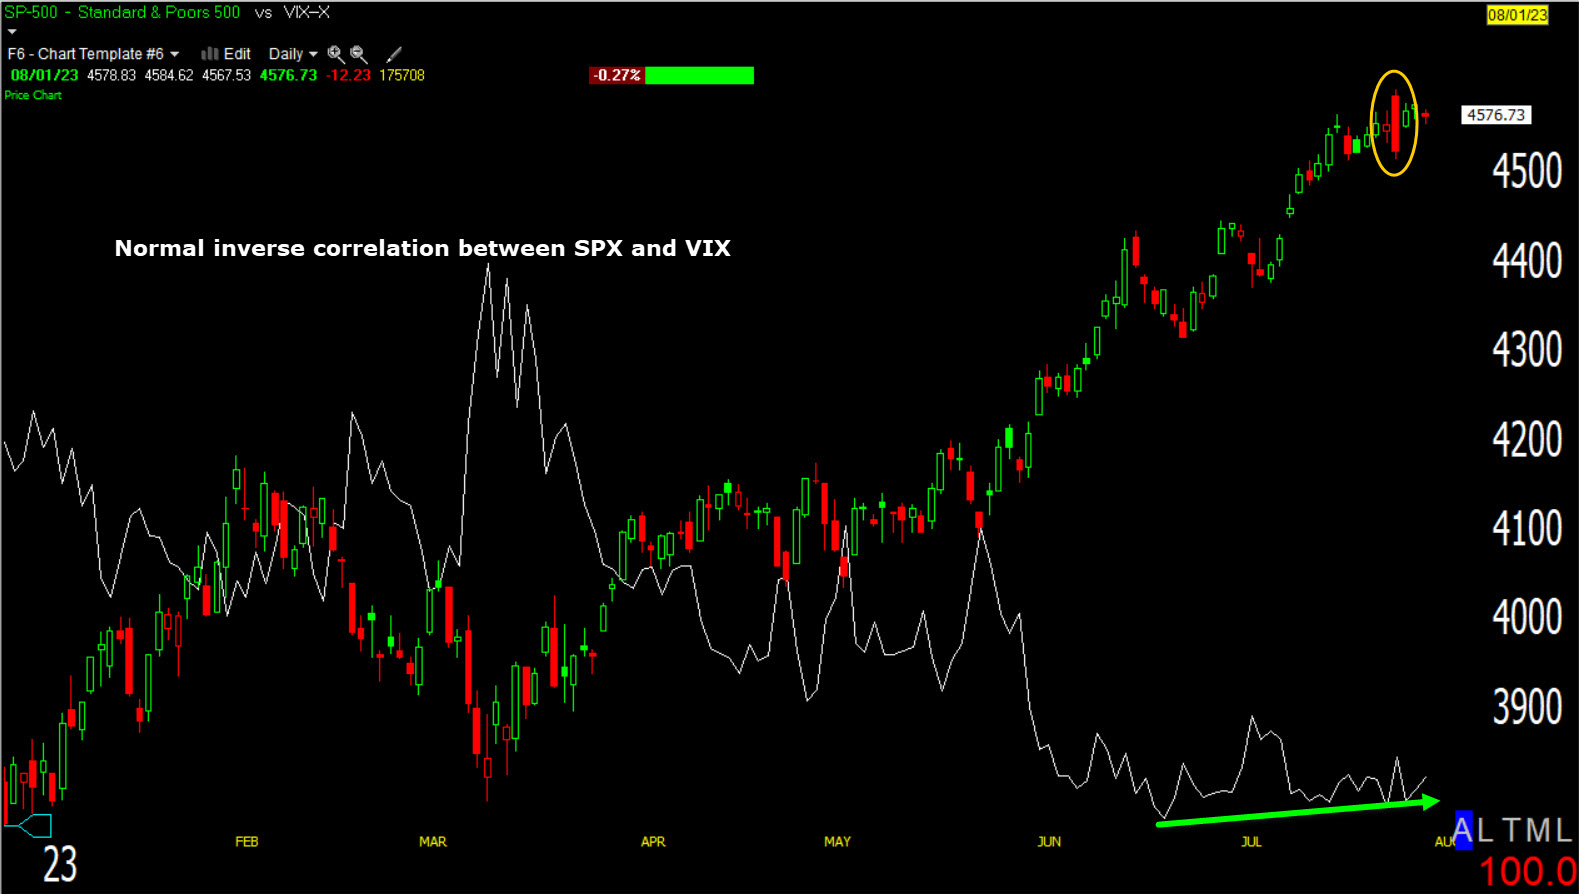 While it was not as pronounced as it is now, we saw the same thing happen into the top of the H&S “head” and SPX Key Reversal Day (yellow) in late July, which led to a 3 month downtrend into October of 2023. To the left you can see the more typical historical inverse correlation between the S&P and VIX, although VIX is not “as” trending as stocks, this is more the long-term historical norm.
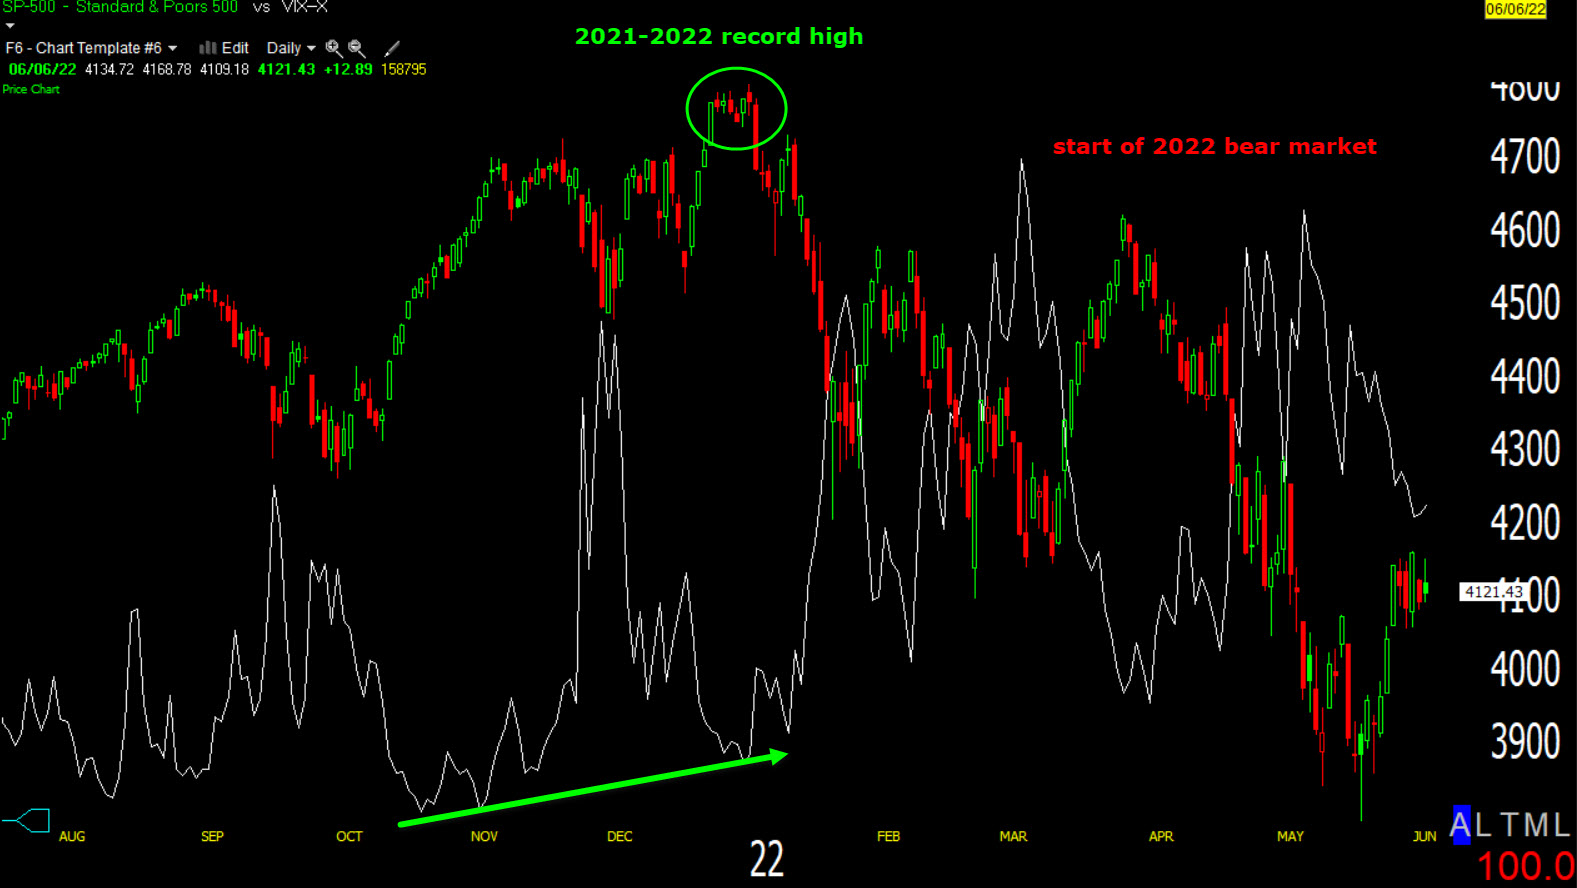
The same unusual VIX relative strength trend was seen into the 2021/very early 2022 S&P record high…
And the same thing was seen right into the February 19th, 2020 record high just before the -35% COVID Crash…
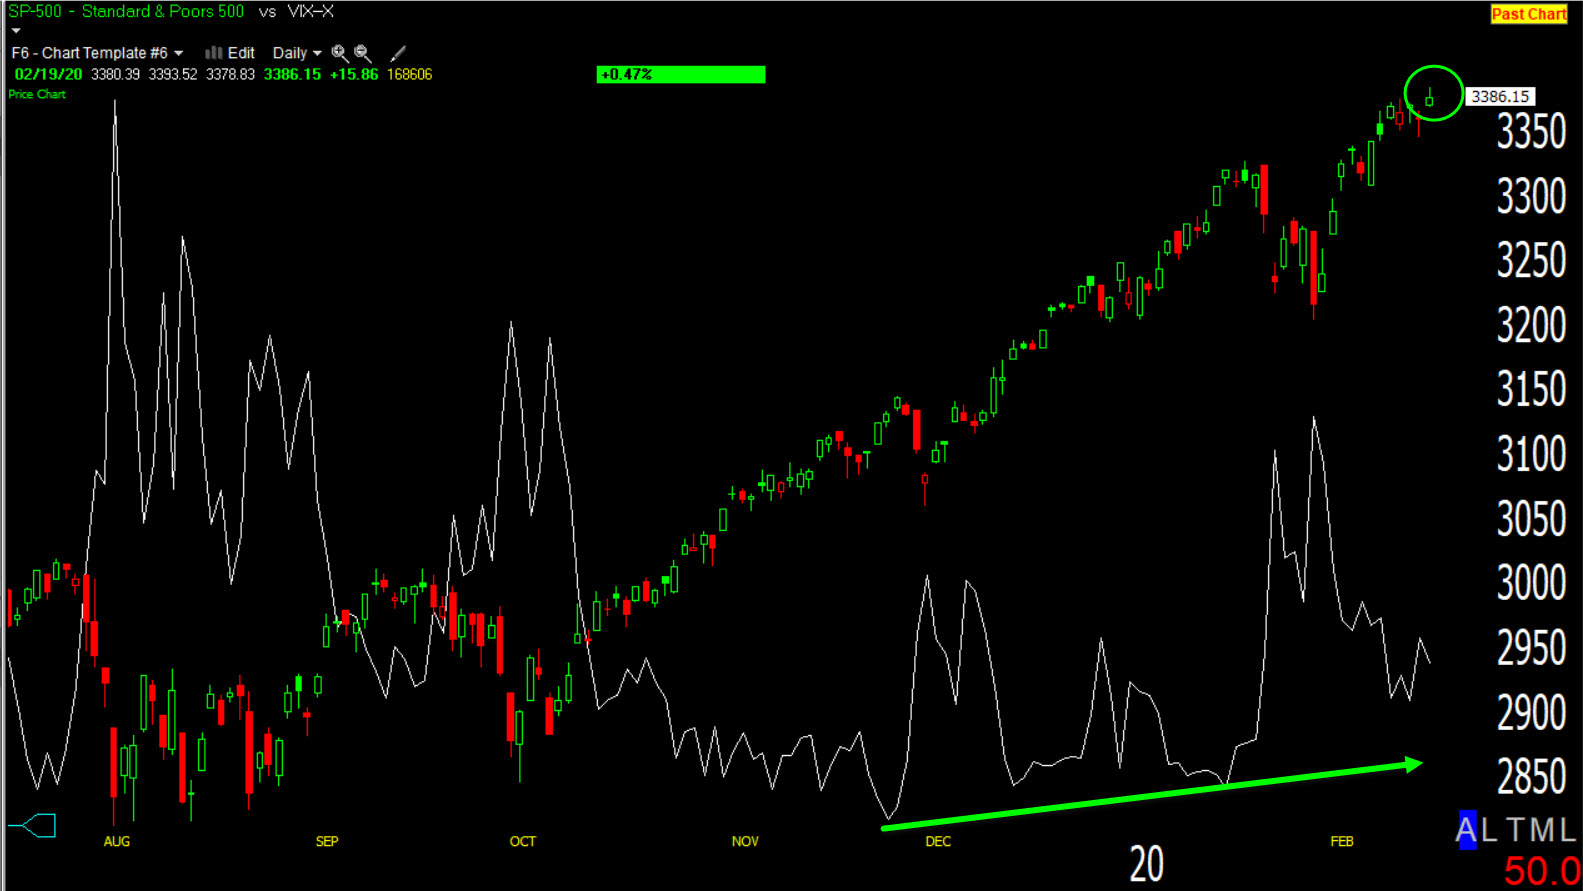
This was the final price high with the crash starting a week later.
And before that, right before the October 2018 record high that was followed by a -20% S&P crash…
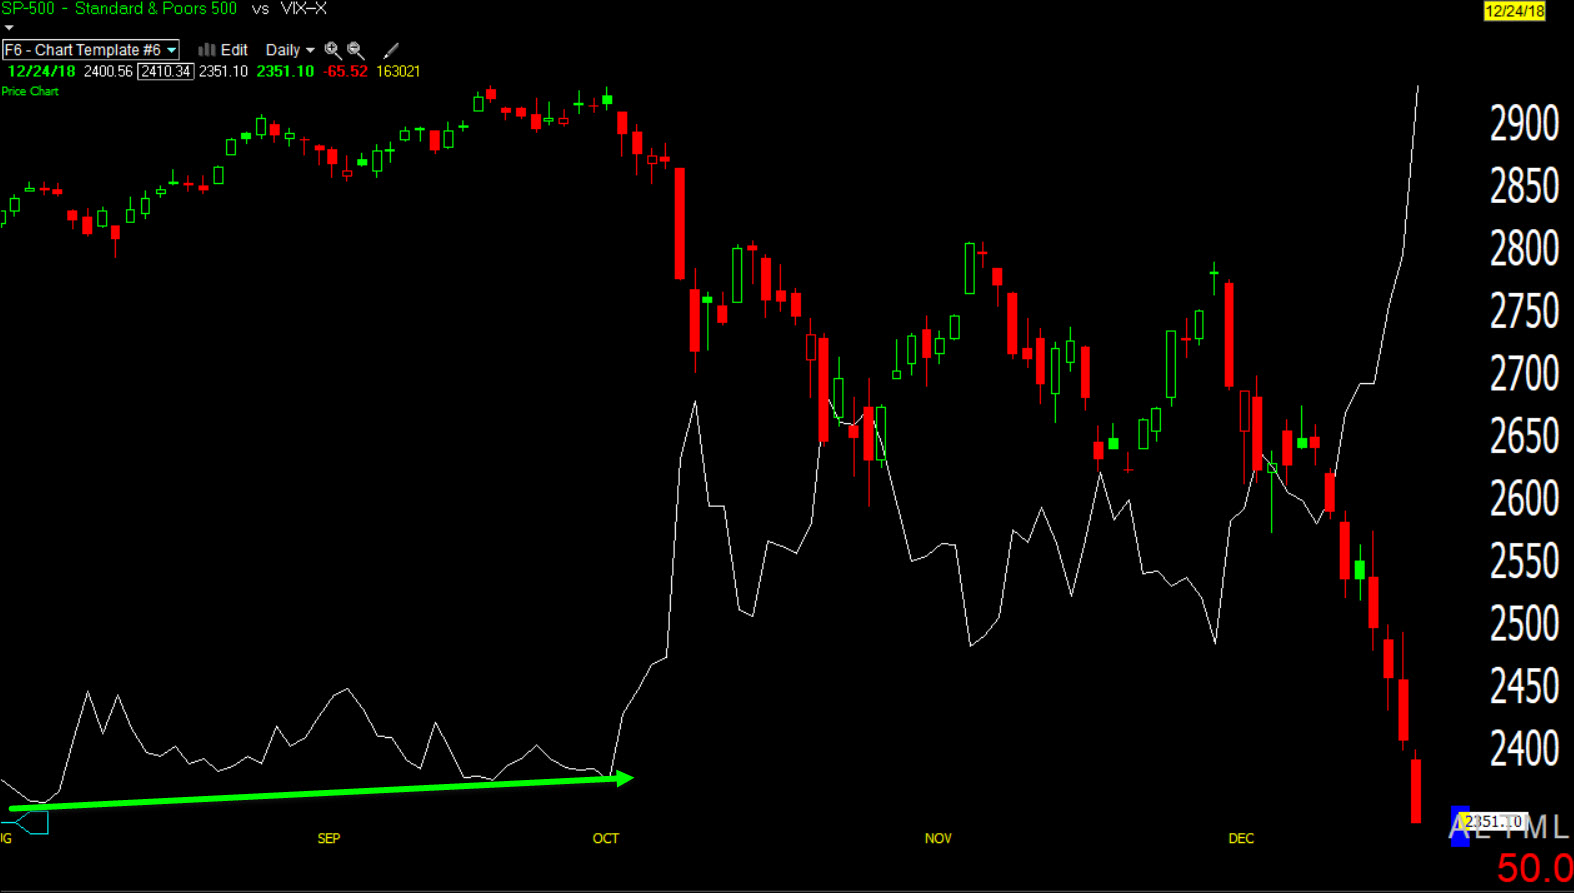
Also, a rapid and pronounced example as the market was in full melt-up mode in late 2017 into early 2018, which was very similar to today in that market breadth/participation fell off rapidly into the end of 2017 and it was just the mega-cap stocks lifting the market in a full melt-up.
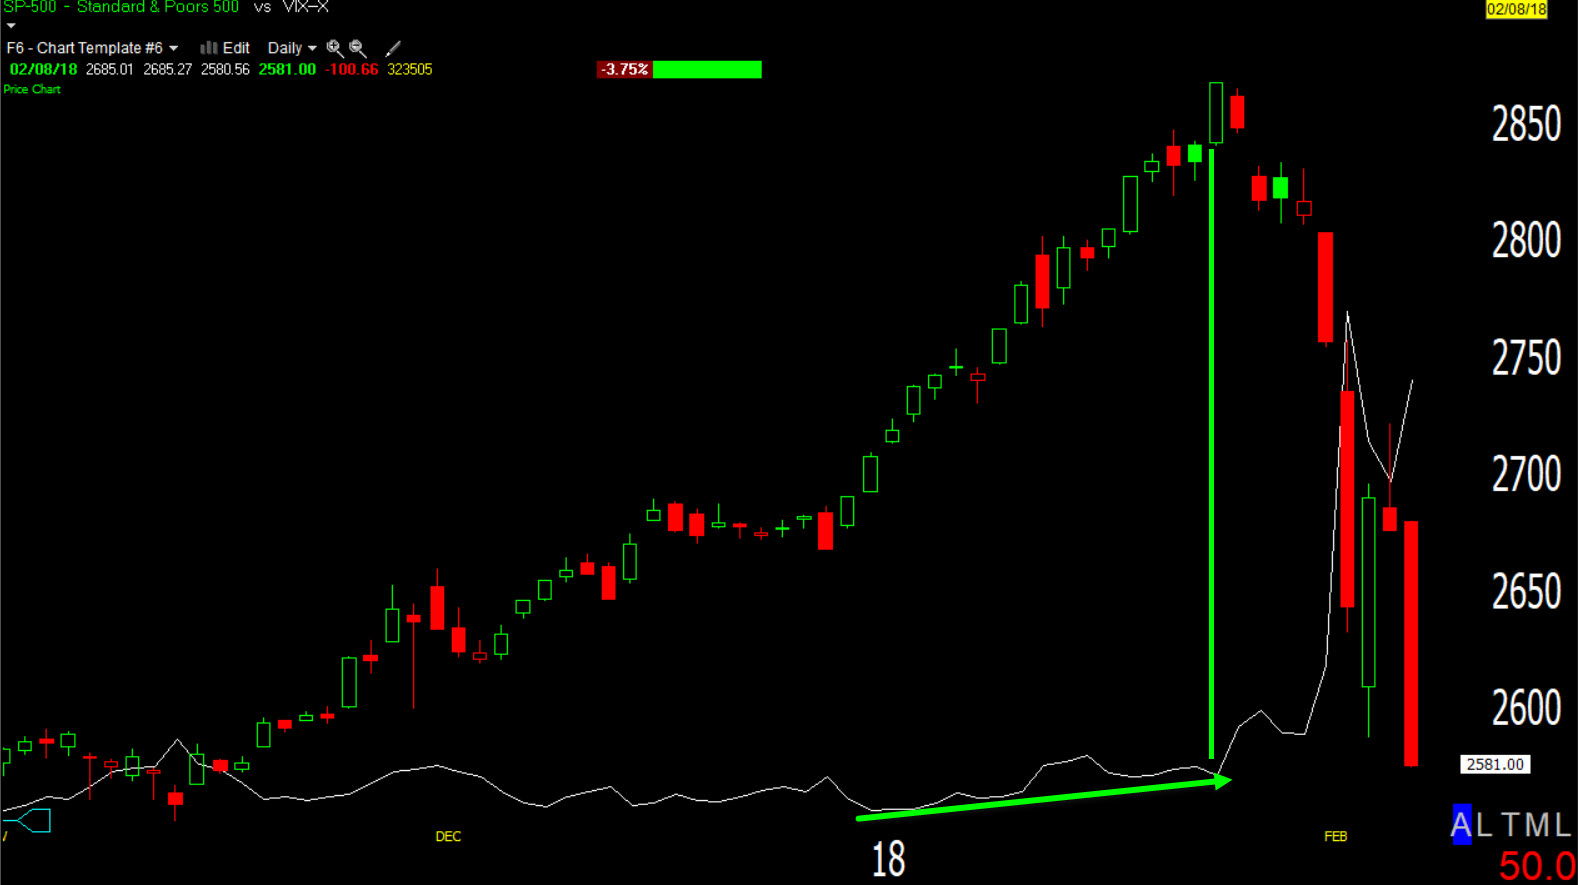 In this instance, the S&P fell -10% on a closing basis in less than 2 weeks, and about -15% on an intraday basis, but VIX exploded as much as +450% (at intraday highs) over a month and the XIV volatility ETF went out of business.
And the first time I noticed the dynamic, and one of the most extreme examples, 2007…
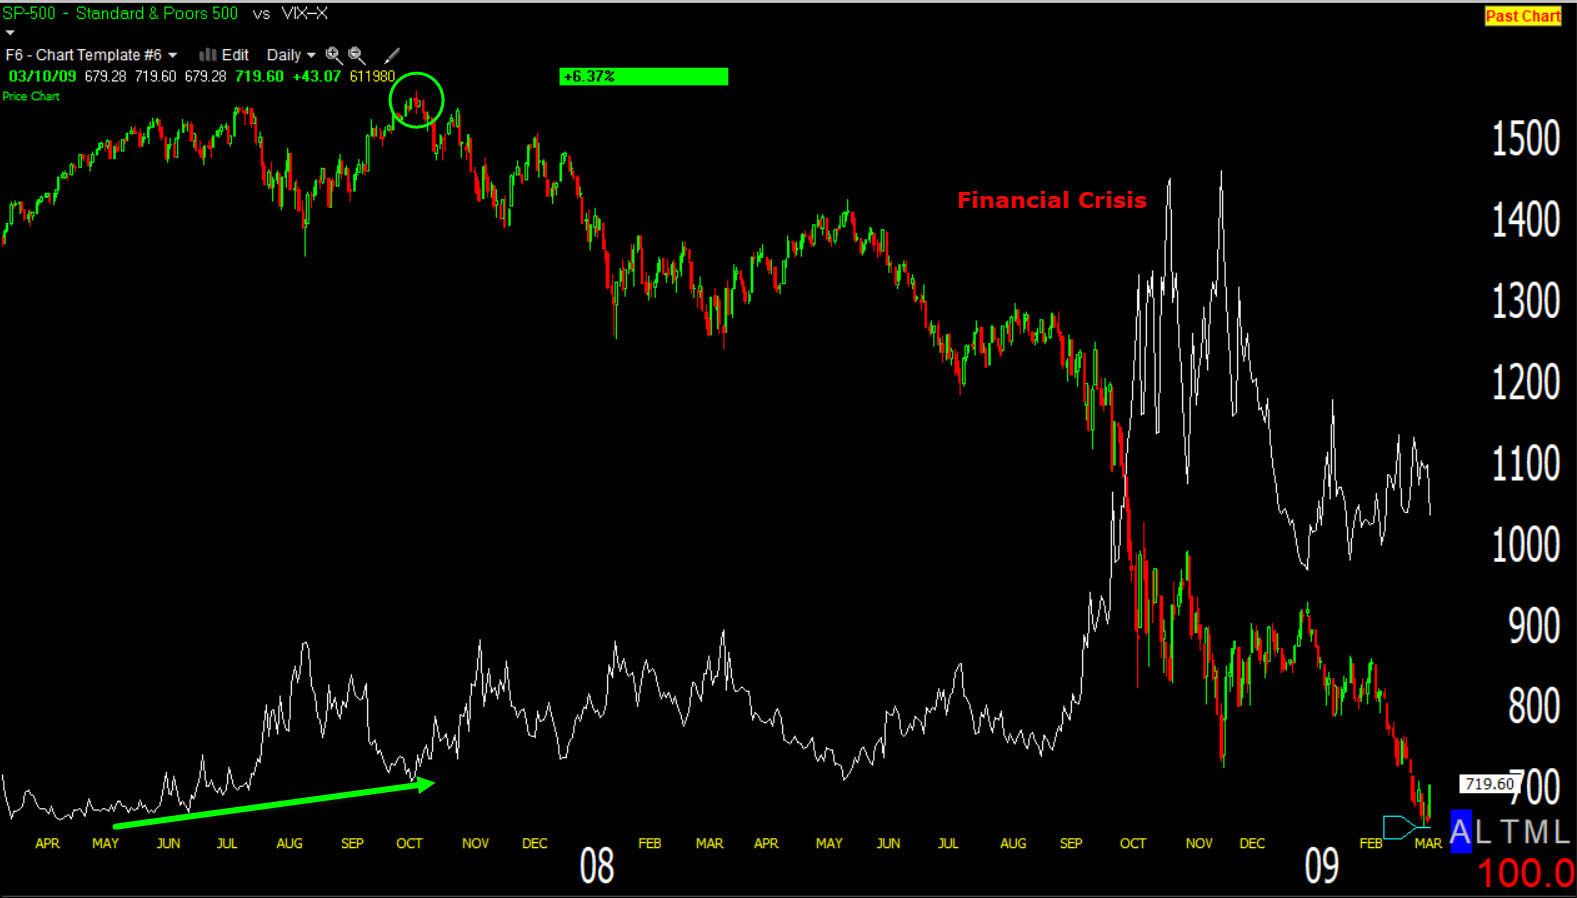 This example was right into the October 2007 record high, preceding the Financial Crisis and a -55% loss in the S&P that wiped out the entirety of the prior bull market, and another -15% lower after that.
And finally, into the Dot.Com Tech bubble’s highs back in 1999-2000…
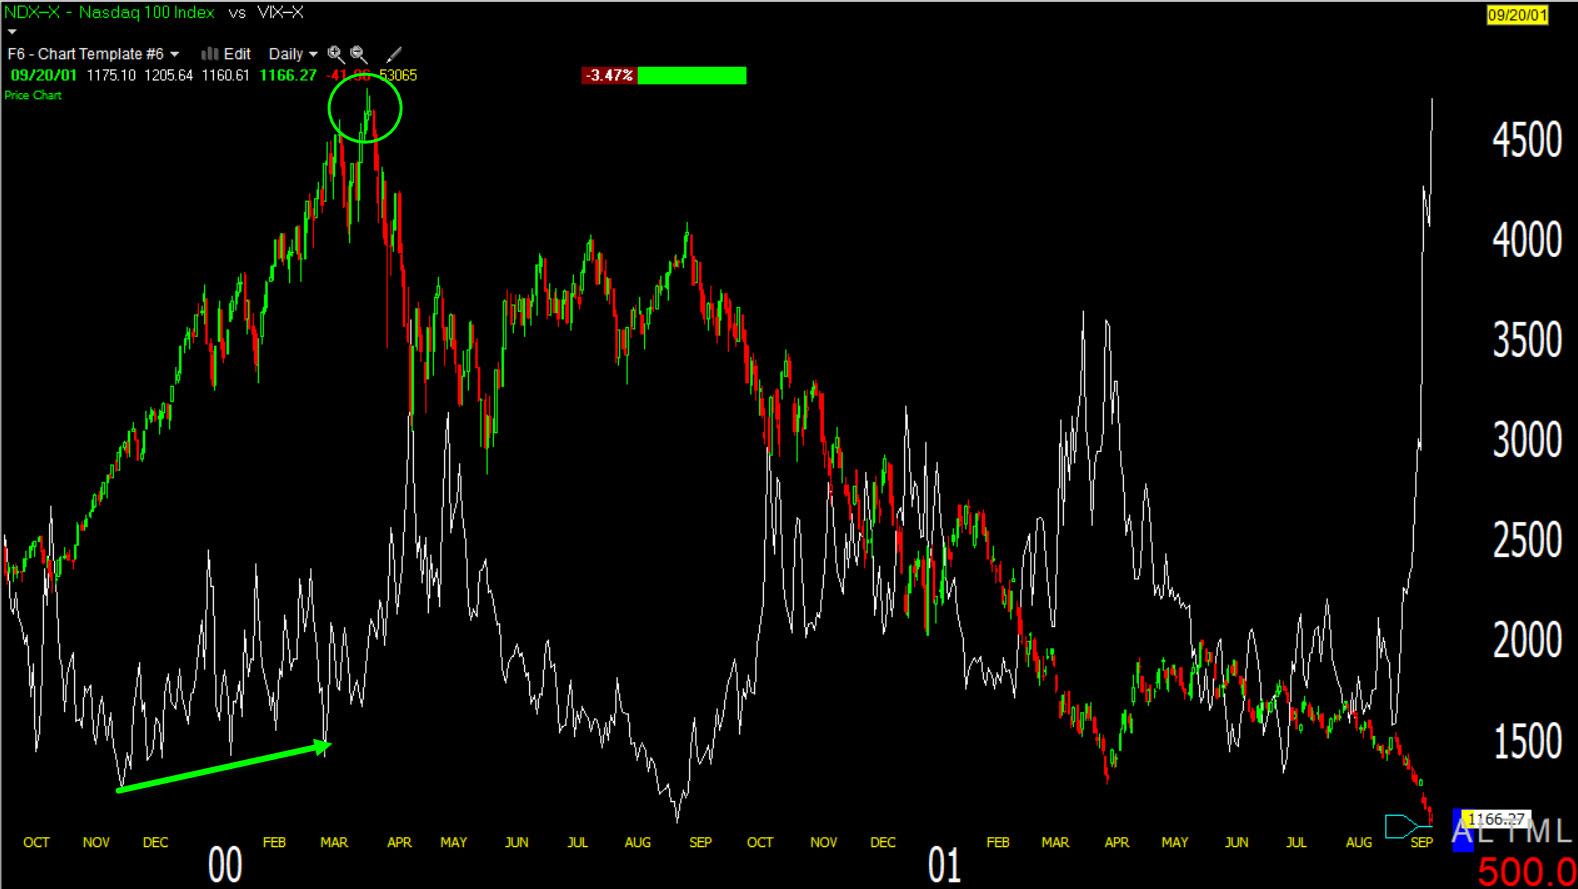 In this case I’m using the NASDAQ-100 to better show the melt-up in 1999 and into the start of 2000, and once again we see this relative strength trend in VIX.
And now we have the same thing happening…
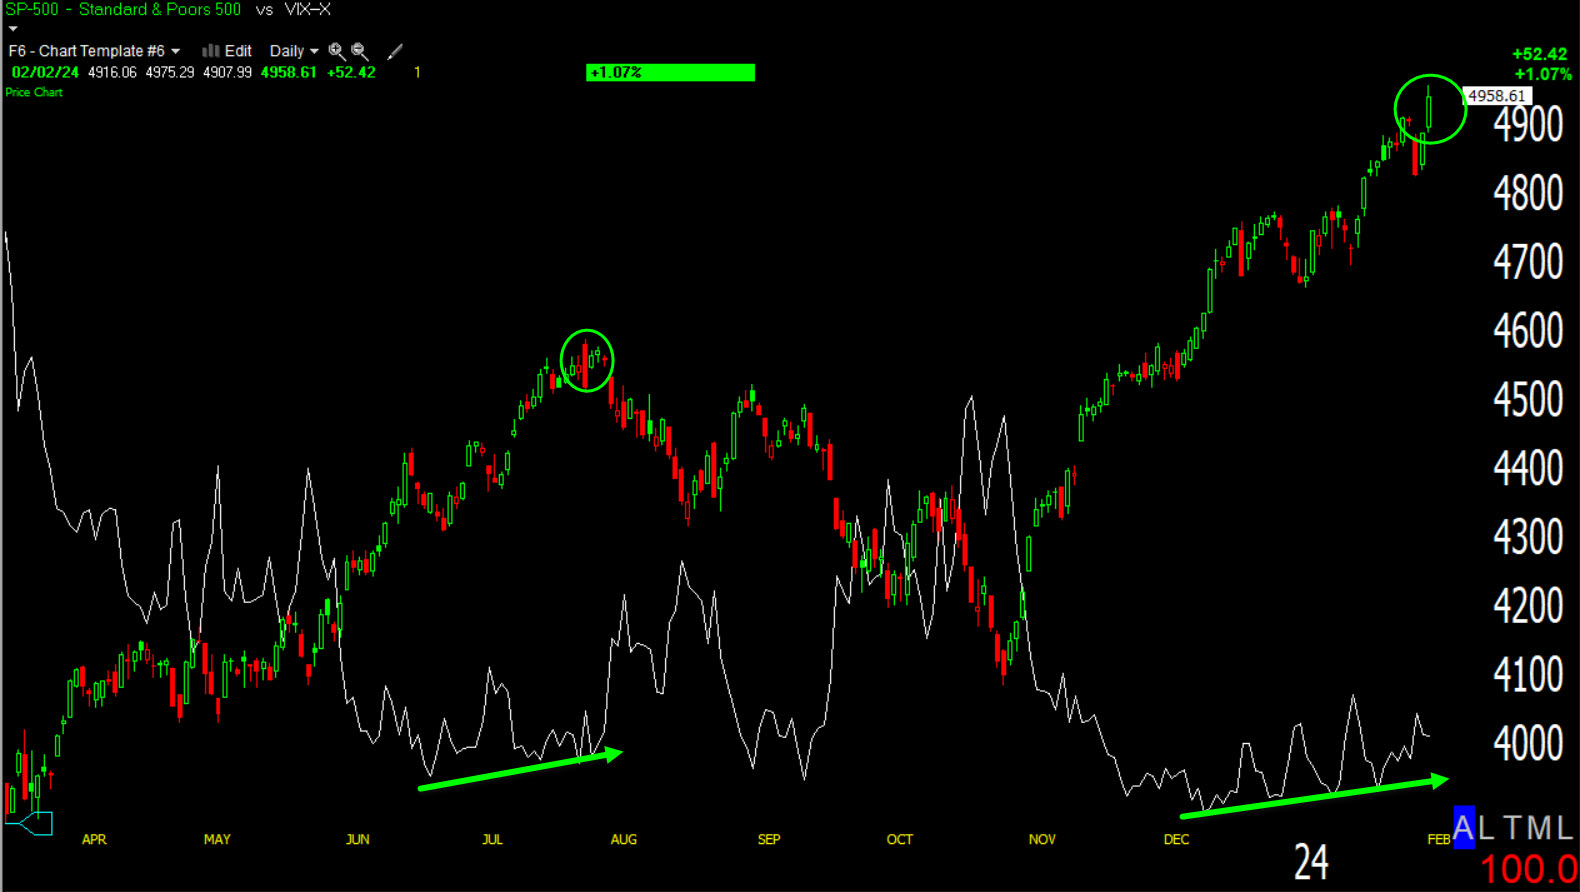 This shows the SPX $4600 example in July, and presently.
As I said above before all of the examples, because VIX isn’t making huge moves, these trends of relative strength slide under the radar of most traders and investors, but whenever I’ve seen this it has always led to bad things for stocks to come. There may be examples of this type of relative strength being a false signal, but I can’t think of one example off the top of my head. I don’t recall ever seeing it and not seeing the market respond with a decline shortly after.
Finally, the Absolute Breadth Index ended lower at 20 today, hitting a low of 18 intraday. A close below 14 is the extremely high probability long VIX signal with VIX typically gaining +50% over the next 1 day to 30 days, but I’ve seen moves in excess of 400%.
Also the CBOE SKEW Index (or Black Swan Index) hit extreme high readings of 160 both yesterday and today. This is evidence of institutional investors and hedge funds buying deep out of the money puts as a hedge to “Black Swan”, unforeseen market risk.
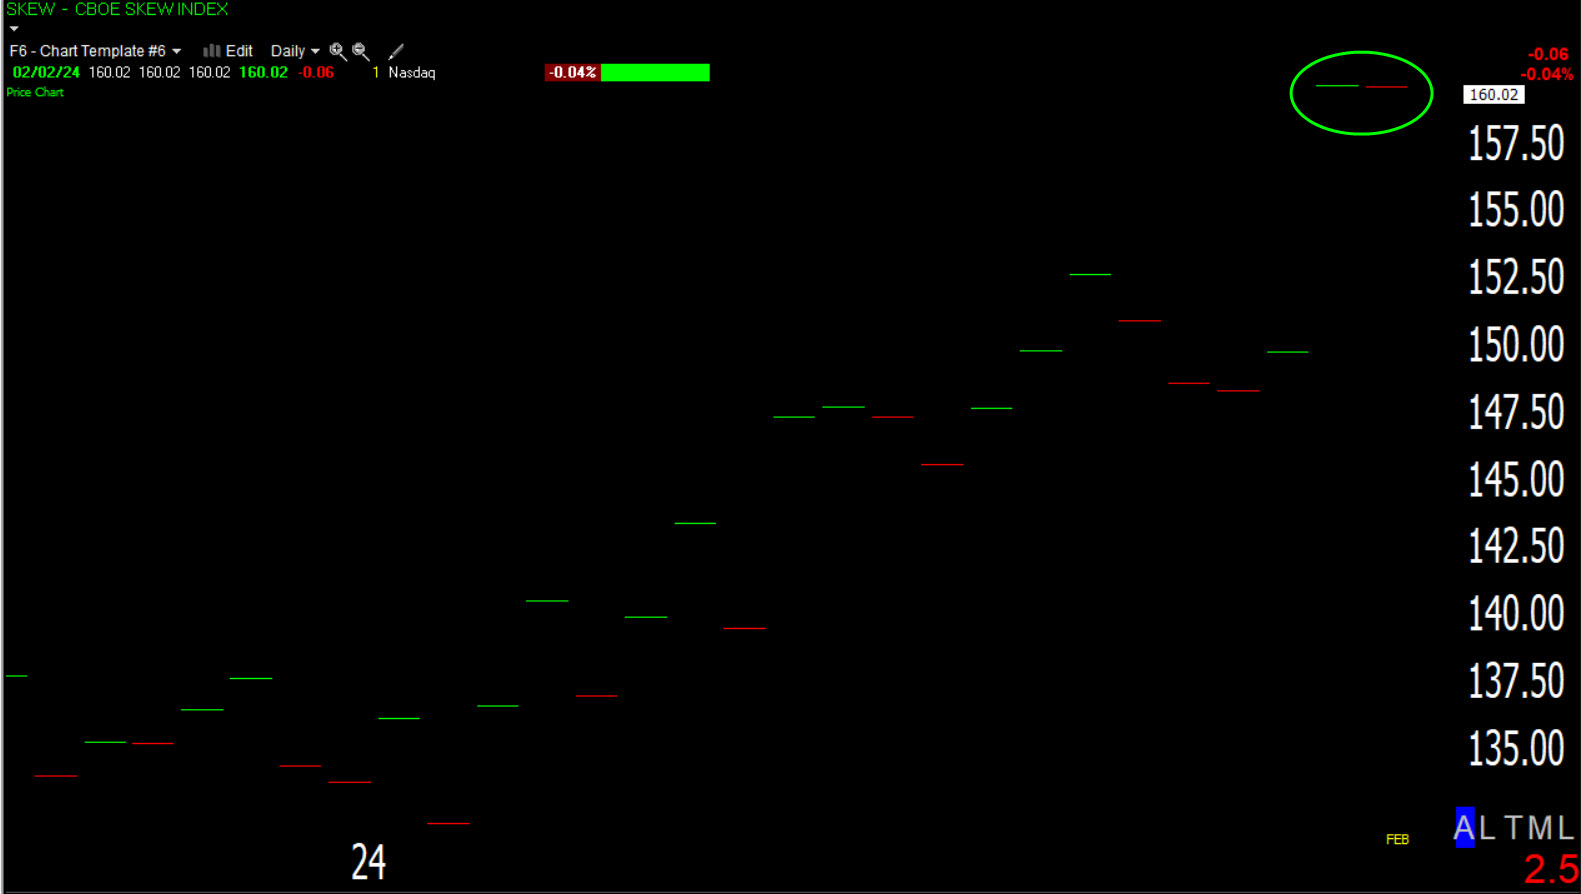 SKEW (daily) at 160.
Most of the market averages’ price trend remains bullish (a few exceptions like Small Caps and Transports), but there are numerous waning signs building up. I’d advise proceeding with extreme caution.