*This post is member’s content. To subscribe, visit Wolf on Wall Street-Trade.
11:54 a.m. ET
Yesterday it was the mega-caps getting hit, this morning its the Small Caps and Dow Transports. You might recall that in last night’s Daily Wrap I showed an intraday chart of Small Caps and wrote that looking at that alone, it was no big deal, but when you stepped back and looked at the big picture, Small Caps had closed just below the top of that large 19 month range – at the top of which, sentiment is almost always at a contrarian bullish extreme.
With yesterday’s pretty sharp rise in yields, and Small Caps/Bitcoin weak this morning I’m really wondering if the FOMC Minutes, out at 2 p.m. this afternoon, were leaked and perhaps are not as dovish as Powell portrayed in the press conference. It wouldn’t be the first time there was a leak at the Fed.
SP-500 -0.65%, Dow -0.6% (Dow Transports -1.25%), NASDAQ-100 -0.9%, Small Caps -1.55%
In economic data since the open,
- The ISM Manufacturing Index rose to 47.4% in December (consensus 47.1%) from 46.7% in November. A reading below 50 for this series denotes contraction.
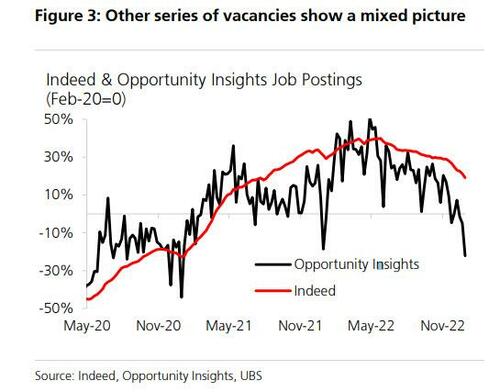
- The JOLTS – Jobs openings totaled 8.79 million in November following a revised total of 8.852 million in October (from 8.733 million). The takeaway is that Job Opening’s slid to the lowest in 3-years as the bottom dropped out in hiring to levels below pre-covid levels. Meanwhile, “Quits” — an indication closely associated with labor market strength as it shows workers are confident they can find a better wage elsewhere — tumbled. It seems the BLS’s data — which is widely understood to be goal-seeked — is starting to look more like private sector data…
The averages’ price action and relative performance of leading market signals, are not looking good as the new year starts, but much of this was setting up well before the start of the new year.
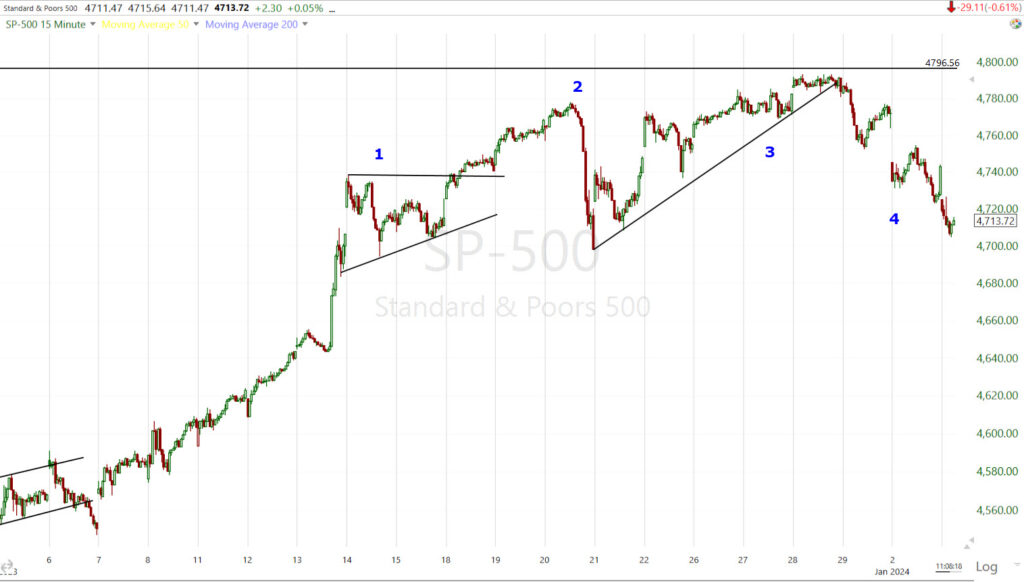
- Bullish ascending triangle consolidation which should have had a strong breakout and a measured move of at least +2% and up to +3.75%, which would have easily made a new record high. Instead the S&P only gained +0.85% before heavy selling.
- Heavy selling on December 20th, the last regular volume day before volume dwindled off into the holidays.
- A weak rebound in the shape of the “Falling three Methods” pattern I expected, falling short of a new record high by just 0.1%. That’s pretty amazing that in that low volume environment, the bulls couldn’t push the S&P another tenth of a percent.
- Getting ugly into the new year.
If we take the trend lines of and look with fresh eyes, I think there’s a reasonably high probability that we’re seeing a top that’s size-appropriate, to cap-off the 2 month rally.
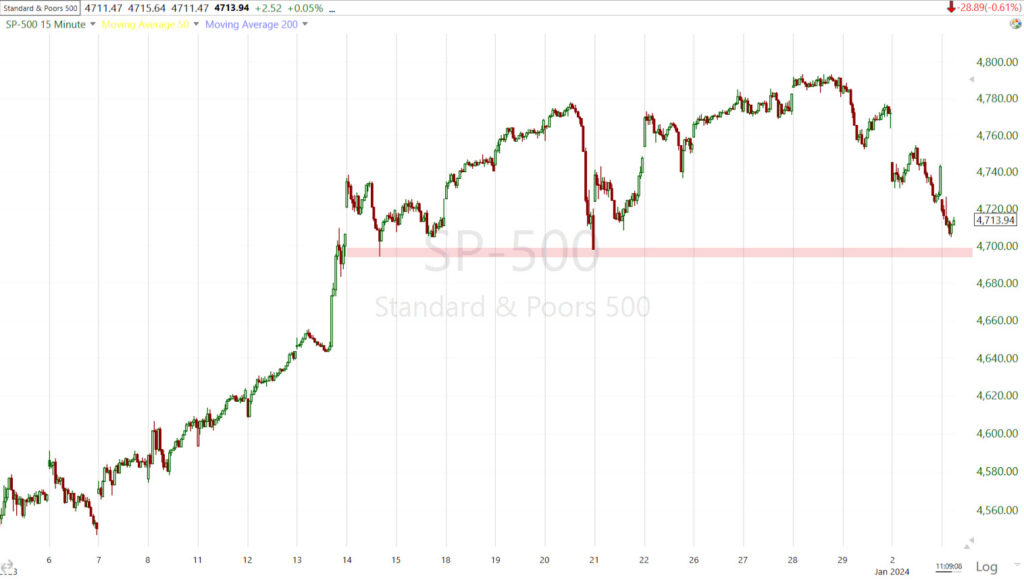 SPX (15m) This looks like it may be the left shoulder and head of a small Head and Shoulders Top with the neckline at $4700. If price finds support at $4700 and bounces to a lower high, then we likely have a H&S top that’s appropriately sized to top-off the 2 month rally. Another possibility is the S&P rebounds from $4700 to a higher high (new record high), but leaves a bearish right angle broadening top, which would also be appropriate. From here the only really bullish scenario is a clearly and definitively higher high well above the record high, but I don’t think that’s a high probability.
Just like the NASDAQ bear flag hypothetical I presented yesterday, this pattern would allow lots of time an excellent entry, and extremely high probabilities for short sales. Or if you have long exposure you want to lighten up on, the scenario would give you the chance at better prices. I prefer to sell longs into price strength, not weakness.
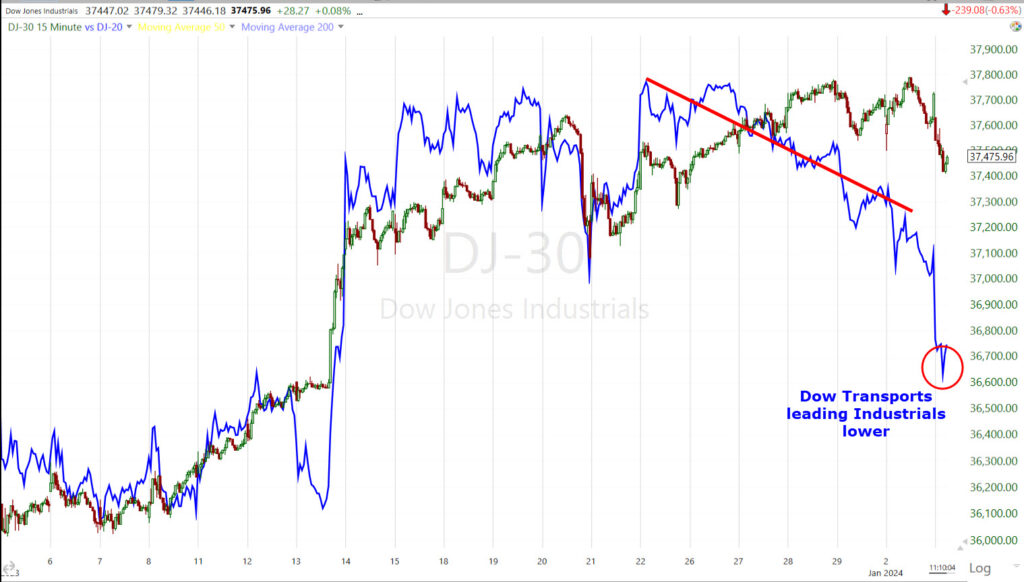 Yesterday I spent some time showing how Dow Transports (blue) are not only not leading the Dow Industrials (15m) as it makes a new high, but they’re not even confirming it. Here we can see Transports, which were also part of the massive short covering rally of Nov/Dec, showing clear and notable relative weakness heading into the new year and at the Dow’s record high. This is about as ugly of a market signal as you can ask for considering the Dow making a new high. Transports continue to lead even more sharply lower.
I also spent some time on this one yesterday…
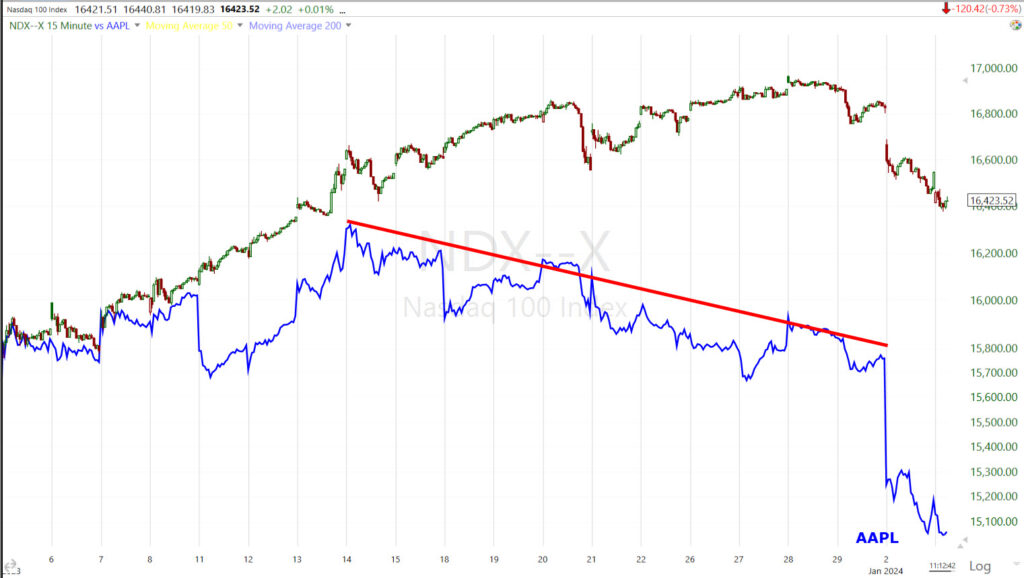 NASDAQ-100 (15m) made a new record high, but wasn’t confirmed by the single most important stock in the index – in the entire market in fact… Apple. This chart is normalized so the relative weakness of Apple you see is not just elative, but it is that too.
The point of this yesterday was, “Well what stocks did lead the NASDAQ to a new record high?”
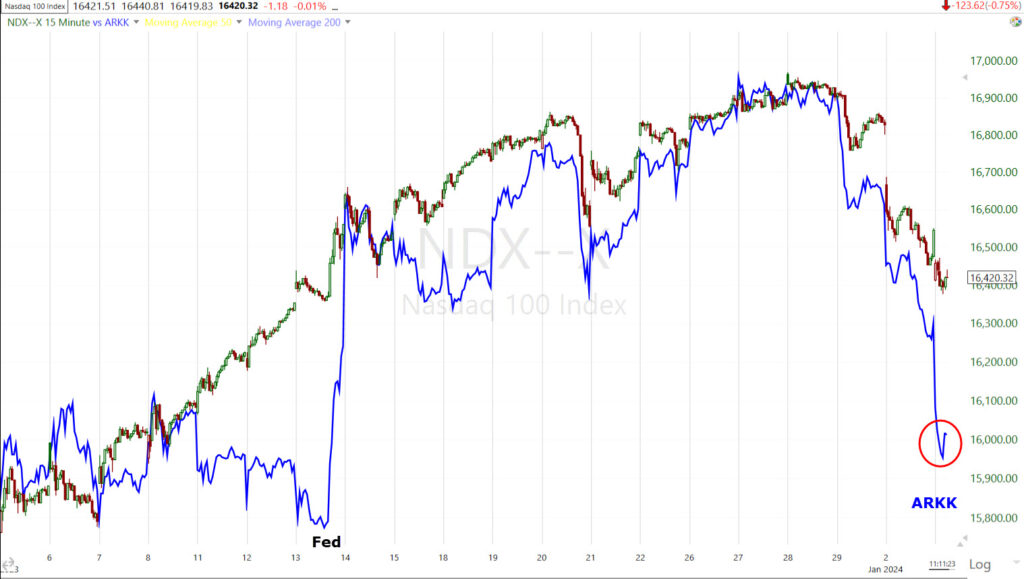 NASDAQ-100 (15m) and the ARKK ETF which is a proxy for non-profitable Tech stocks. You can see the bulls chasing these stocks, especially after the Fed’s dovish pivot, but as shown last night, they are closer to a bear market than a new record high, but it was their support via short covering and momentum chasing of some of the crappiest, low quality stocks out there (something that’s common in a highly speculative, frothy market like 1999) that gave the NDX its record high.
I couldn’t think of a worse group of stocks to lead a new closing high. They are the junkiest of the junk and I certainly wouldn’t want to be long the NASDAQ knowing which stocks drove it higher into year-end.
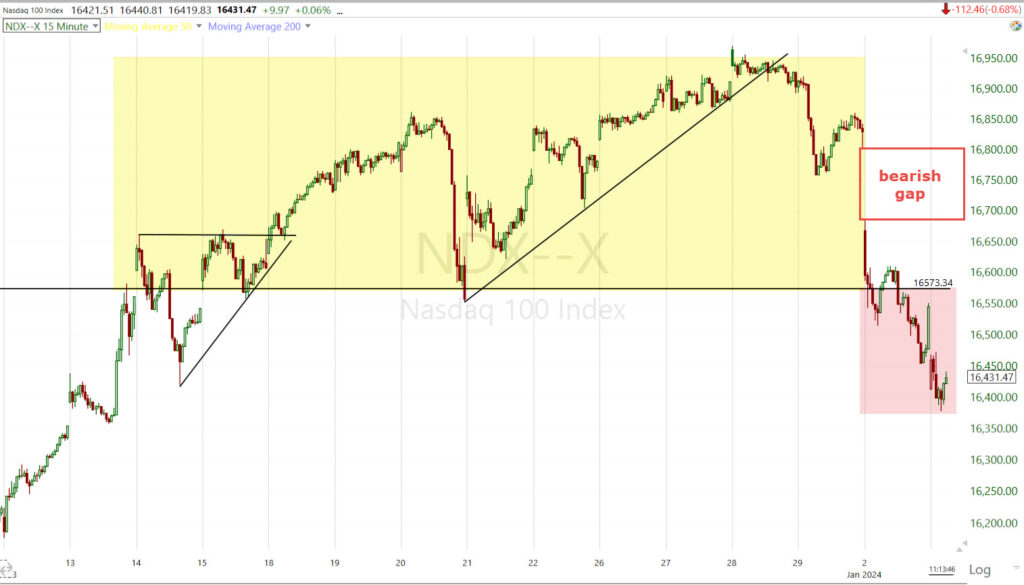 NASDAQ-100 (15m) the yellow area represents a likely failed new high that the market can’t add to or build on. Yesterday and today in red represent the loss of that new high which in a healthy market, should have held as support. We still have that gap above that I posted a hypothetical of what I’d “like” to see in coming days… a bear flag consolidation to fill the gap and that could happen and still form a H&S top as mentioned with the S&P above. The gap being let unfilled would be even more bearish, but gaps love to be filled so I’m guessing we’ll get some kind of bounce in the next several days/week or so, but it won’t be the kind you’ll want to buy, but rather the kind you’ll want to sell into or start building those short positions into price gains.
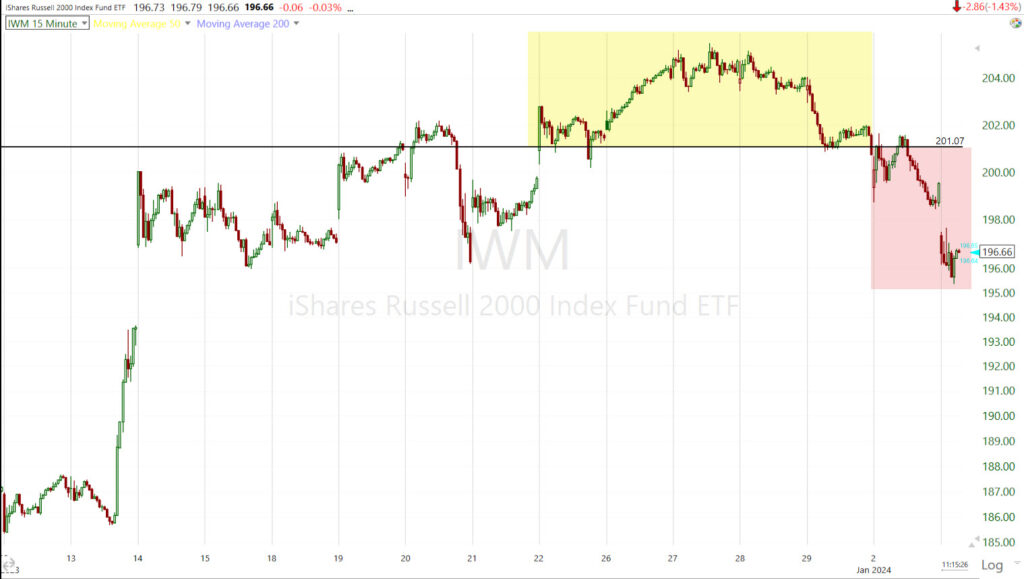 This is the chart of Small Cap IWM I posted last night that if you look at without the trend line, maybe doesn’t look so bad, although we can see the outlines of a small H&S top forming here too.
However, when you look at the trend line in the context of the big picture…
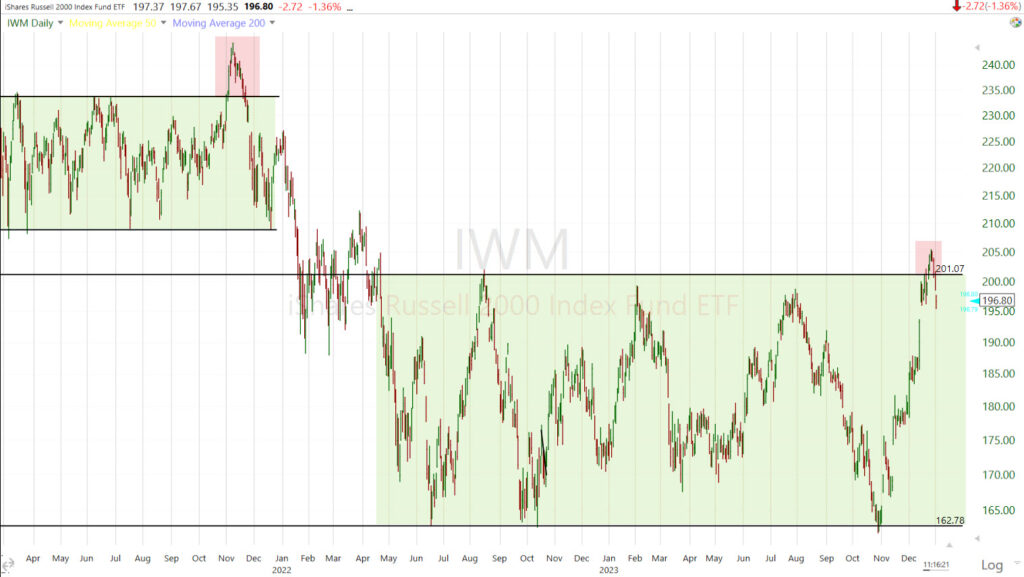 This is a key failure and very reminiscent of the bullish all time record new highs in December 2021, the first time Small Caps (daily) broke out of a nearly year long lateral range (like now, except now is a much bigger lateral range). However, that “breakout” only held for 2 weeks before failing and marked the “TOP” as the averages went from record highs in December 2021, to a bear market in 2022.
My Most Shorted Index is tracking closely to the major averages.
VIX (+4.9%) is acting fairly normal. Volatility might even be a tad calmer than expected.
Ten of 11 S&P sectors are down. Health Care and Utilities are vacillating around unchanged, but only Energy (+0.85%) holds a gain on a rebound in oil prices. I normally wouldn’t make much of the Health Care sector, but being its heavily weighted and trading in a multi-year key resistance zone, I think it’s worth watching as it provided some measure of support yesterday to the broader market.
Sector bias was all over the place at the open, unlike yesterday which had a very clear defensive tone, but as the morning has gone one tone has grown more defensive. The bottom three performing sectors all down 1% or more represent my 3 major food groups 🙂 We have a cyclical (Materials), a mega-cap heavy sector (Consumer Discretionary) and a defensive bond proxy (Real Estate) at the bottom of the leaderboard, which just reinforces the lack of a clear sector bias.
Mega-caps (MGK -0.65%) are in-line with the benchmark S&P-500, but performing better than the Equal Weight S&P-500 (-1.15%) by 50 basis points, which is a reflection of Small Caps and a vast majority of stocks trading lower. It has little to do with any notable strength in mega-caps, or leadership.
Semiconductors (-2%) are underperforming the Tech sector (-1%) for a second day, by 100 basis points. This further reinforces my view that the run in semis into the end of 2023 was a momentum chase, likely by hedge funds trying to salvage their year end (2023) after getting caught majorly offsides, being way too short stocks heading into November and getting brutalized for their overly bearish sentiment.
Some other areas of relative weakness are some of the groups or sub-groups that benefitted the most from the 2 month short covering, Dash for Trash rally. The Retail sector is down -2.6% and ran into a similar resistance zone as Small Caps…
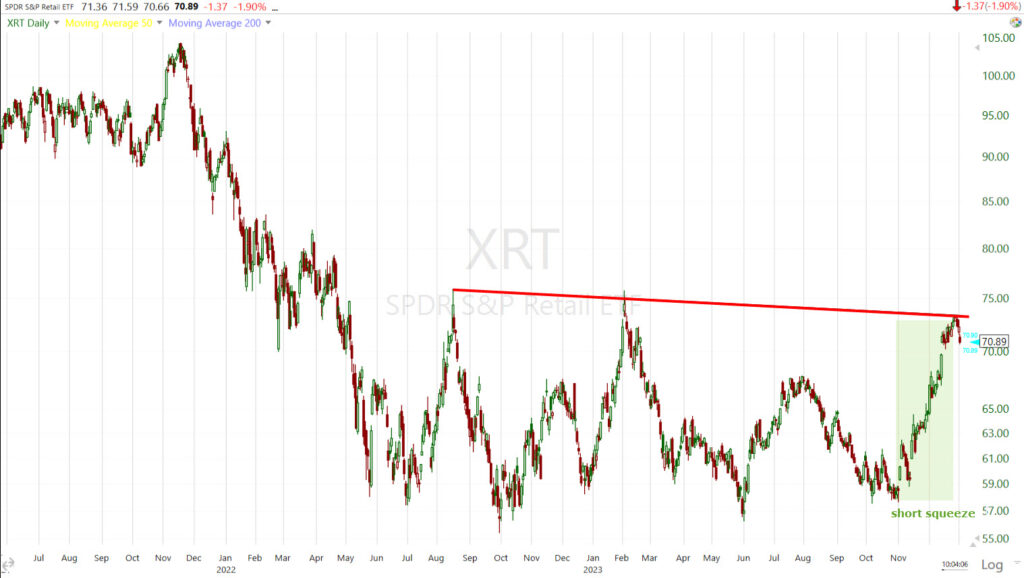 Retail sector (daily) which was not a strong performer in 2023, sold into the red for 2023 by late October, then massively short squeezed, but a short squeeze is like a sugar rush, it’s not quality buyers. Now the sector has run into resistance very similar to Small Cap IWM.
Regional Banks were another big short squeeze beneficiary and they’re down -2%.
Airlines were another group that soared higher due to short covering that are weak this morning, down -2.9%.
Homebuilders were another short squeeze beneficiary and they’re down -2.5% this morning.
And as I covered in some detail yesterday, non-profitable Tech stocks. I’m using ARKK (-3.4%) as a proxy since the premise of the ETF is pretty much non-profitable Tech companies and its down another -3.4%.
Selling is broad-based. The A-D line favors decliners by a 4-to-1 margin at the NYSE and a greater than 3-to-1 margin at the NASDAQ Composite.
The U.S. Dollar Index is up another +0.35% after yesterday’s large move. Today is not as big, but it’s keeping pressure on risk sentiment. The 2-day gain in the Dollar is another move that makes me wonder about the Fed/FOMC minutes being leaked and possibly not as dovish as Powell came off.
WTI Crude Oil Futures continue to rise, now up+2.95% after Libya’s Sharara oil field unexpectedly shutdown amid mass protests, removing some 265K bpd in daily output. The move this morning is retracing most of yesterday’s weakness.
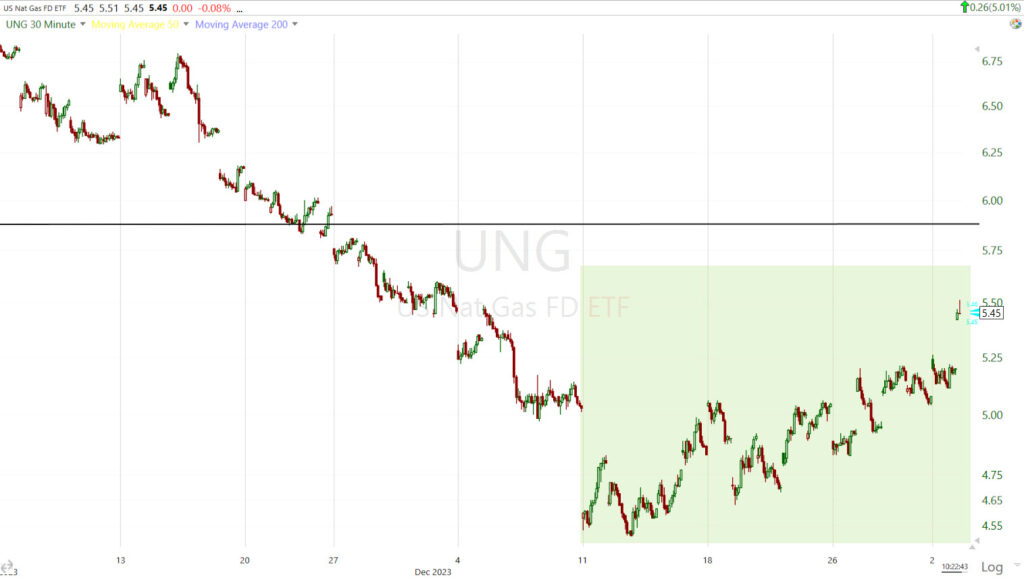
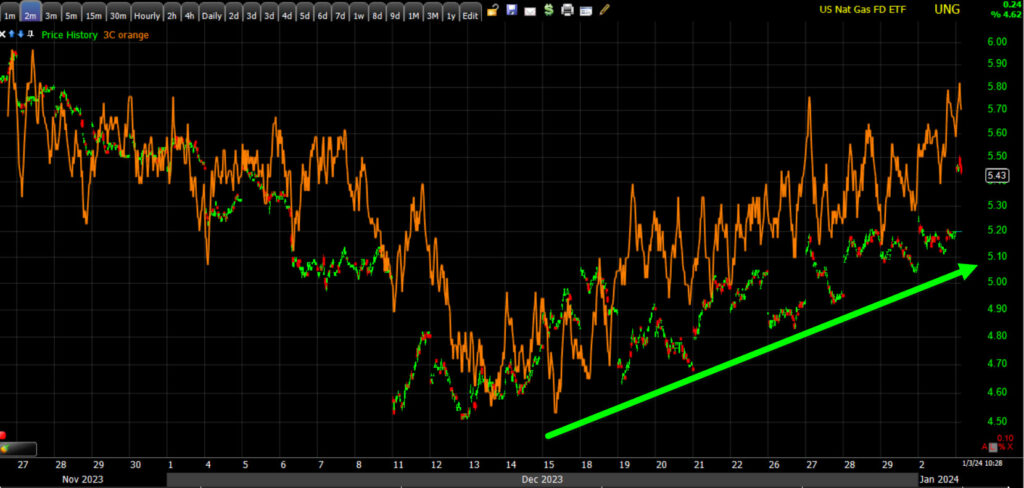
Nat Gas futures are up +3% sending UNG up +3.1% this morning and almost +8% since Friday’s close. I’ve doubted very much that UNG’s recent rebound off lows was another bear flag, but it hasn’t been the kind of price action I’d prefer to see at a low, still, the price action continues to tell me that tone has improved and it really does not look like a bear flag.
UNG (30m) the rebound is getting too steep for a typical bear flag. And while we didn’t get a major positive divgernece at UNG’s lows, 3C has been confirming the rebound pretty well.
I’ve got to do some research on URA (-0.6%) as December 28th’s drop was an ex-dividend day, but seems too large for just ex-dividend. I’ll get back to you on it. In any case, price is sitting at the bottom of the ascending triangle it had been holding as support s I think this is an important level to hold in the near-term.
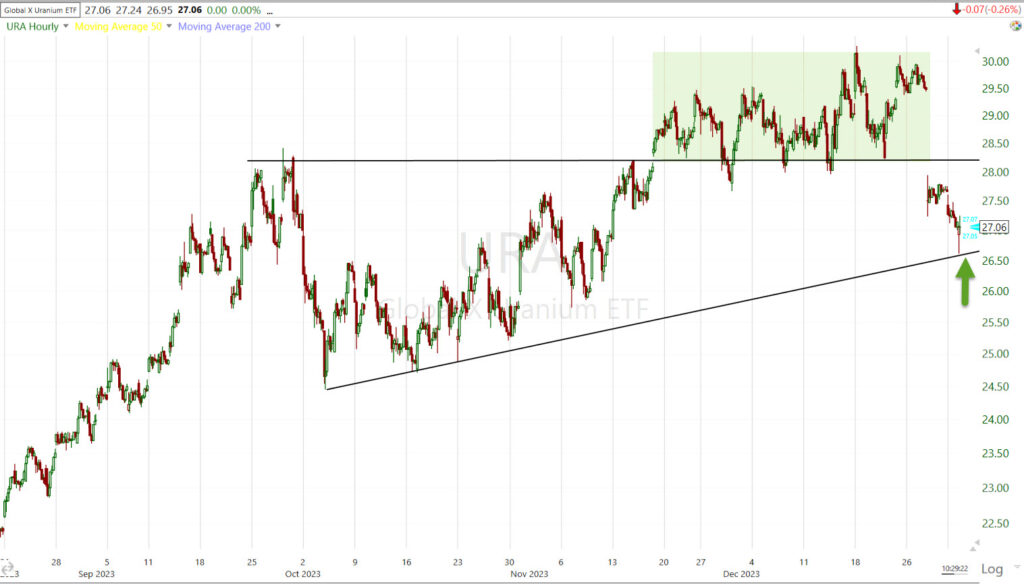 URA (60m) – A break below that trend line sets up a faster downside move in price so this is a key area to hold as support.
The 2-year yield is up nearly +2 bp and 10-year up +1 bp as they’ve come down off session highs. This is another move that makes me wonder about the FOMC minutes being leaked. The 10-yr yield challenged the psychologically important 4.00% level, and the area of the dovish Powell/Fed pivot that caused the 10-yr to crack below 4.00%.
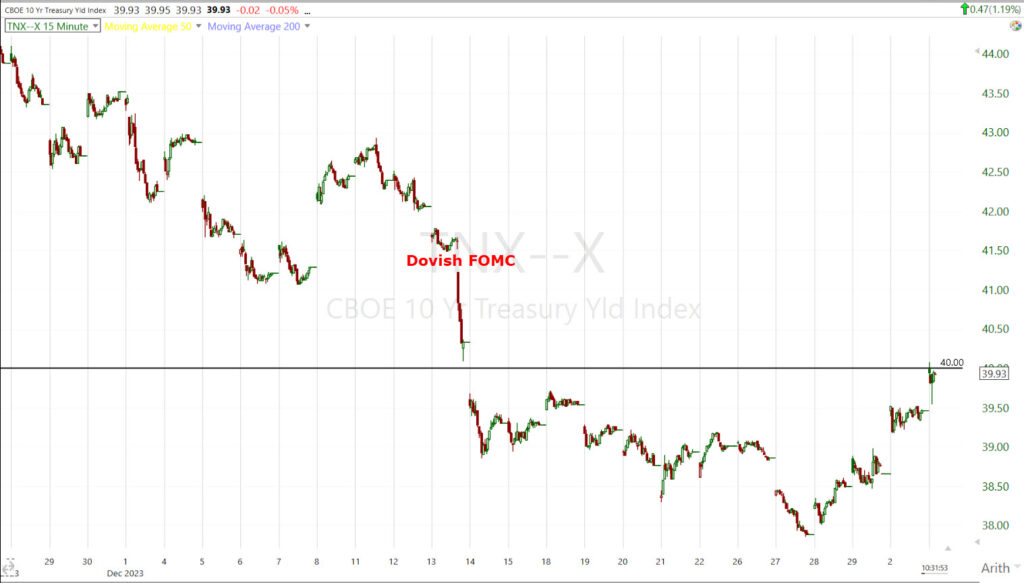 10-yr yield (15m) with 4.00% at the trend line.
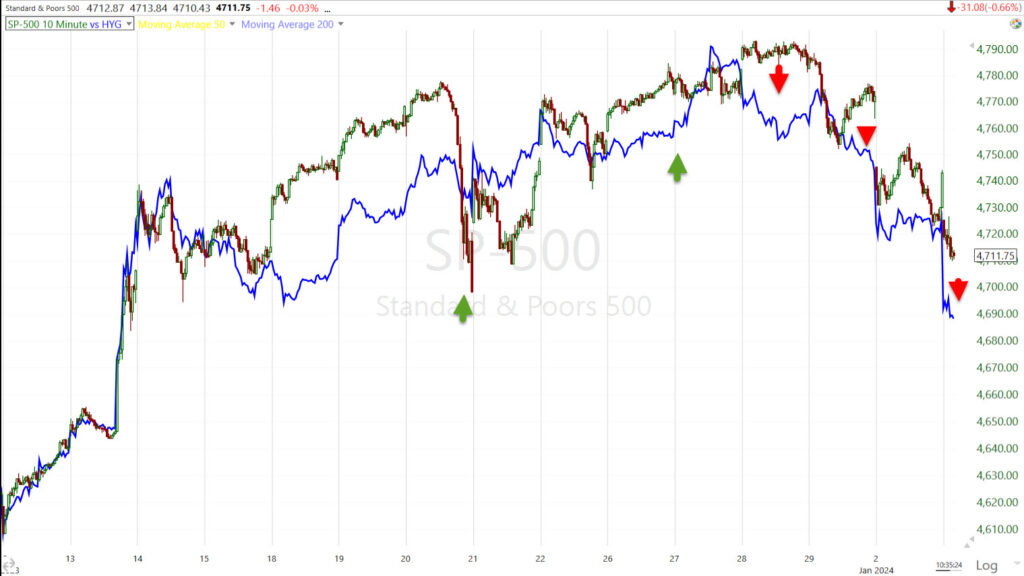
High Yield Credit (HYG (-0.5%) continues the last few days of relative weakness. Yesterday I noted it, but said it wasn’t a major red flag to shout from the rooftops, but it’s moving in that direction. Today adds to the relative weak leading market signal.
SPX & HYG (10m) with HYG’s leading signals at the green and red arrows.
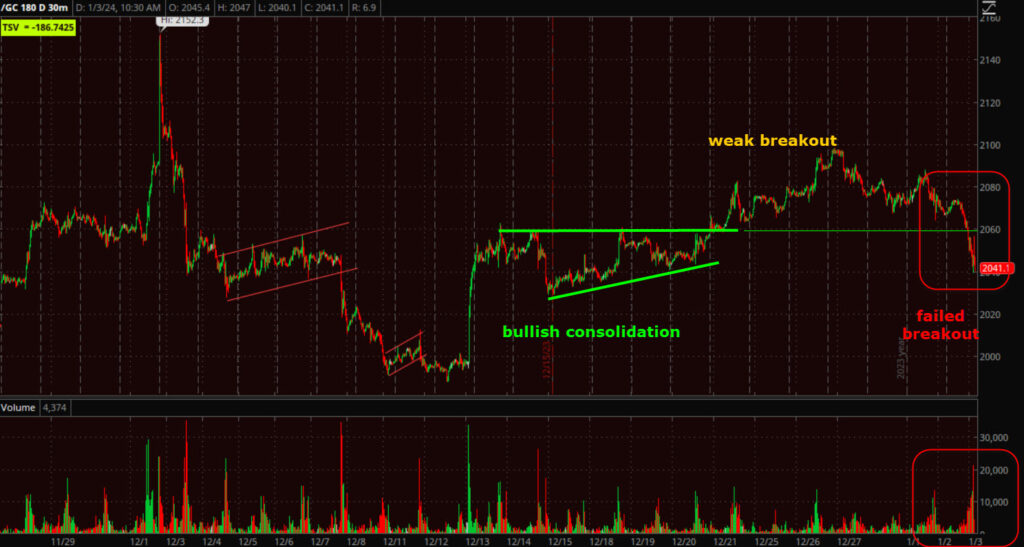
Gold futures are down -1.6%, so once again we’re seeing gold getting ahead of itself and making runs to new record highs, but not having done the consolidation work to build a strong base to sustain the runs higher. This morning’s decline puts Gold in the failed breakout category from the bullish ascending triangle that price very weakly broke out of and fell well short of the upside measured move target. Just like with the major market averages, a “record new high” headline means nothing if price is too exhausted to build onto, or even hold it.
Gold futures (30m) Just follow along with the chart annotations. Notice price breaking under the upper trend line of the triangle consolidation on a notable pick-up in sell-side volume as the breakout fails. This is a perfect example of why I often say that the initial breakout is one of the most dangerous times as the potential for a failure is the greatest, especially with assets that have not built the base necessary to sustain a strong move. From failed moves come fast price reversals.
This is yet another asset acting poorly making me wonder if the FOMC minutes are going to come out looking not as dovish as Powell portrayed.
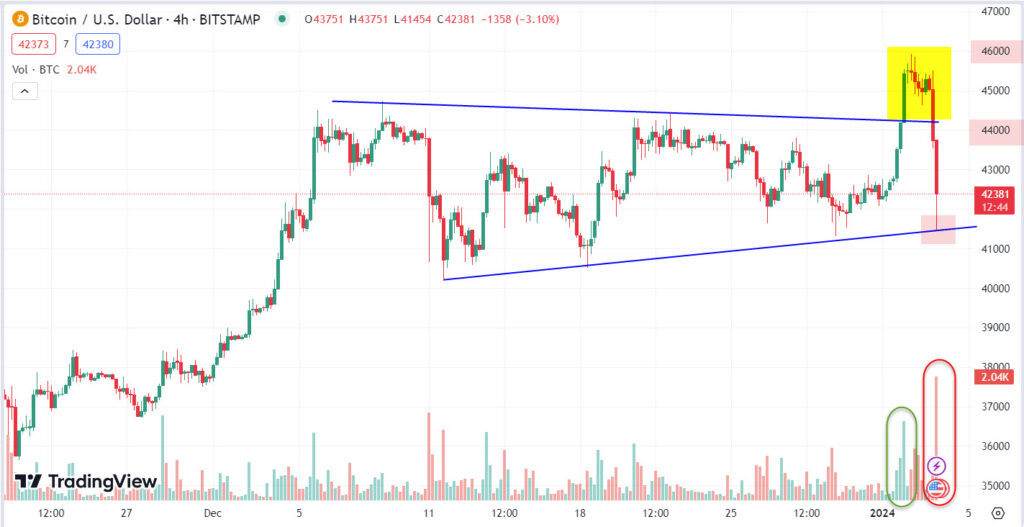
Speaking of failed breakout, we have another high profile one in Bitcoin after a fairly weak breakout attempt yesterday that lost steam at $46k.
BTC/USD (4H) a large bullish consolidation sees a breakout yesterday, but doesn’t get a very strong start before stalling at $46k. Remember I wrote that $44k and $42k would be very important… $44k is where the breakout failed and $42k is where price is finding at least temporary support for now. Should price break below $42k, I think you’re going to see Bitcoin lose a lot more pretty quickly. Also notice that while volume picked up on yesterday’s breakout (green), it’s pretty heavy on the failure (red). That’s not a good sign for BTC, but as a market signal, it’s not good either for risk sentiment and perhaps as a depiction of changes in liquidity.
As for 3C charts, the trend timeframes tracking the rally from late October/early November have been negatively divergent (The Jaws of Death), but it was the short-term tactical (timing) charts that just went negatively divergent into Wednesday December 20th, that signaled something more imminent was likely coming and that Wednesday was the ugliest day of the 2 month rally. Since then, 3C’s short-term signal has not improved one bit, but moved lower and lower.
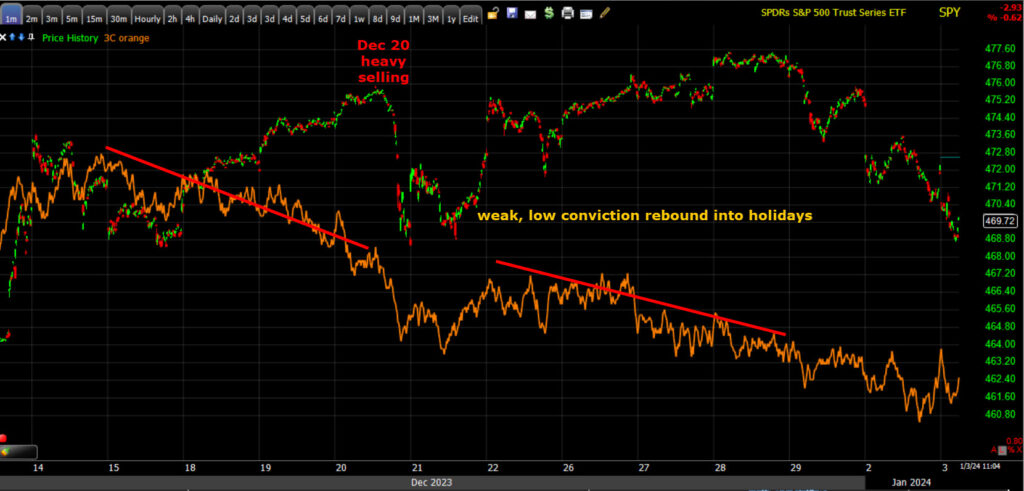 SPY (1m) this negative divergence into the 20th, was one of the first on this short-term tactical timeframe. Then we got the 5-day (Falling Three Methods-like) rebound into the holiday as I did not expect the market to sell-off right before the holiday, but as you can see, 3C negatively diverged with that bounce as well and has been trending pretty much non-stop lower.
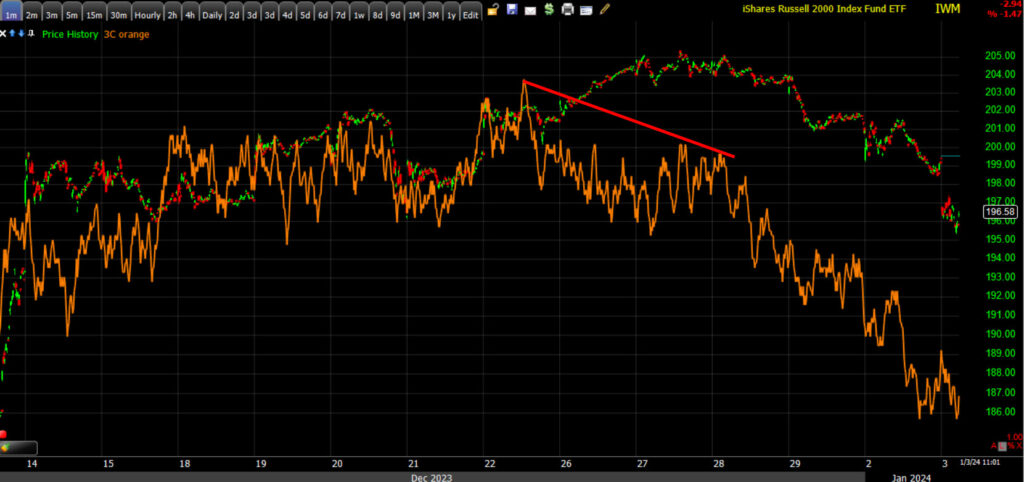
Small Cap IWM was a bit later, but negatively diverged right as prices broke out (just barely) above our large lateral trending range.
The New Year is not of to a good start. We’re only 2 days into the new year, but I see a high probability that the 2 month November/December rally is coming to an end and may do us the favor of building a small, but trend or size-appropriate top to cap it off, while allowing us time to further asses leading market signals and indicators like 3C. It would also allow those of you carrying long exposure to trim it back if you wish into a bounce, rather than selling into price weakness. For those interested in shorting the market, the tops should give you the opportunity to get more confirmation of the bearish change in tone, better price entries for shorts, while lowering risk on those positions. Yep… The year is getting interesting very quickly.
