*This is a subscriber’s post, “The Early Update”, made public. Enjoy.
12:04 p.m. ET
I am seeing some very interesting developments this morning, which started as another mirror reversal of yesterday, which was a mirror reversal of Monday.
Most of the averages (S&P, Dow, NASDAQ) are trading unchanged. Transports jumped as much as +1% at the open as the typically do when there’s a short squeeze and Small Caps outperform (since Nov.), but they’ve given it back. Small Caps are the leader and you’ll see why below, but this raises some big questions about sustainability of short squeezes and we may be starting to get an answer this morning.
SP-500 +0.05%, Dow +0.05% (Transports -.35%), NASDAQ-100 0%, Small Caps +0.85%
There was a very interesting slide on some decent volume in S&P-500 and NASDAQ-100 futures at the cash open…
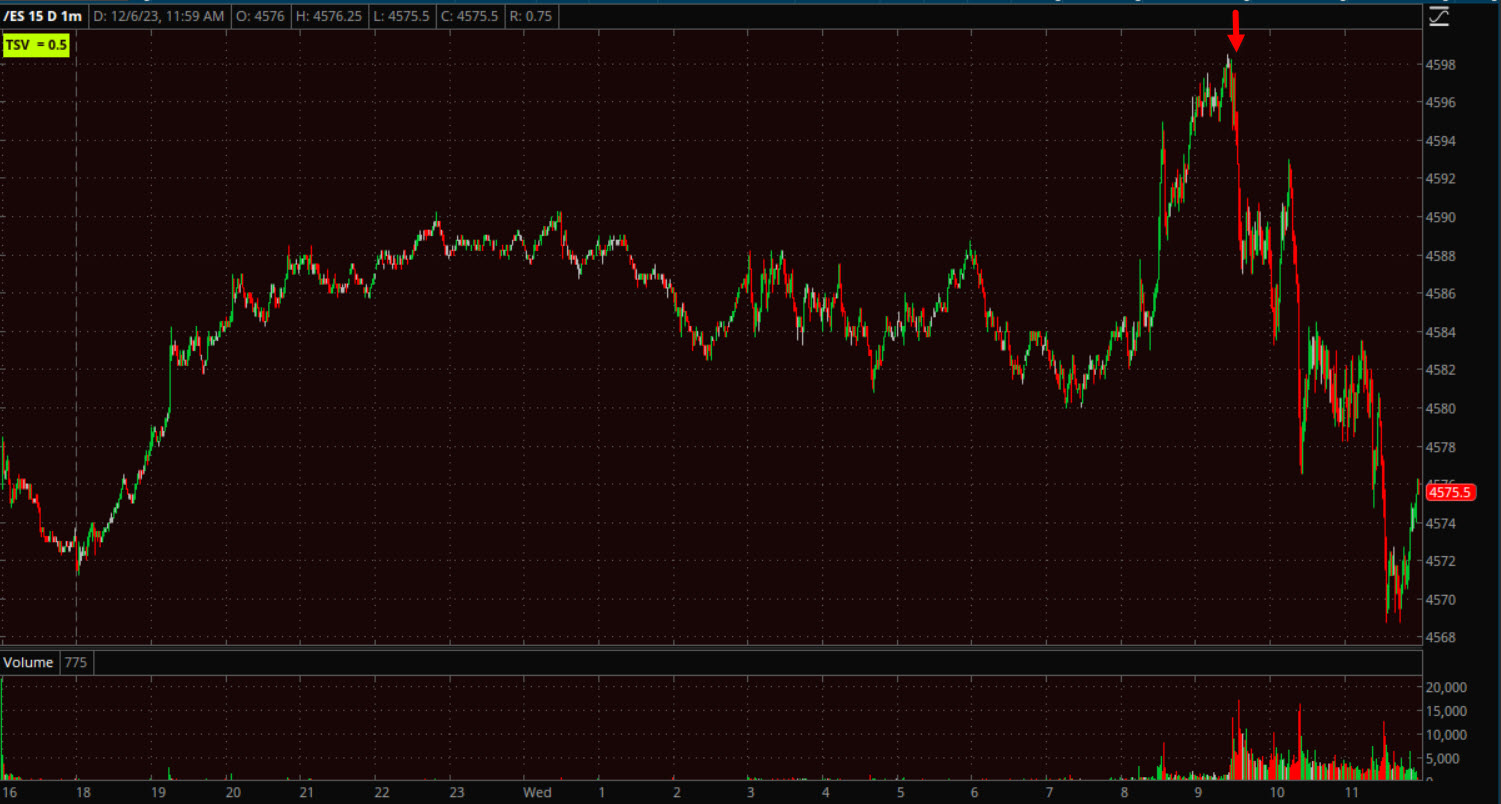 S&P-500 futures (1m)
Can you guess where that money went?
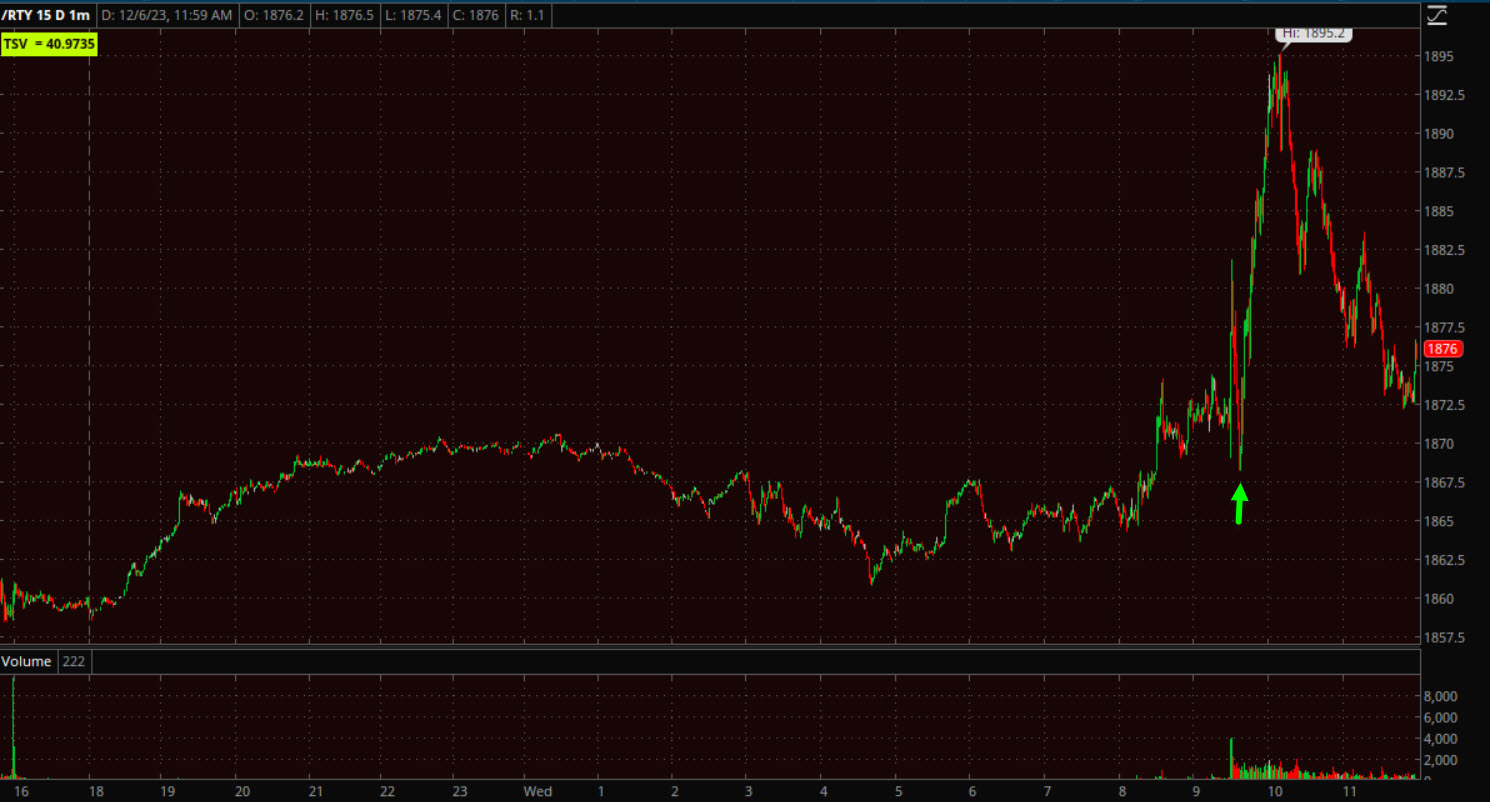
Russell 2000 futures (1m) surge at the cash open.
Two observations: 1) It was essentially a rotation out of S&P and NDX and back into Small Cap Russell 2000 (Monday Small Caps were in favor, Tuesday NDX was in favor and Small Caps out of favor, this morning Small Caps see money push to them at the open); and 2) It prevented S&P and NDX from invalidating the current 2-day bear flag’s.
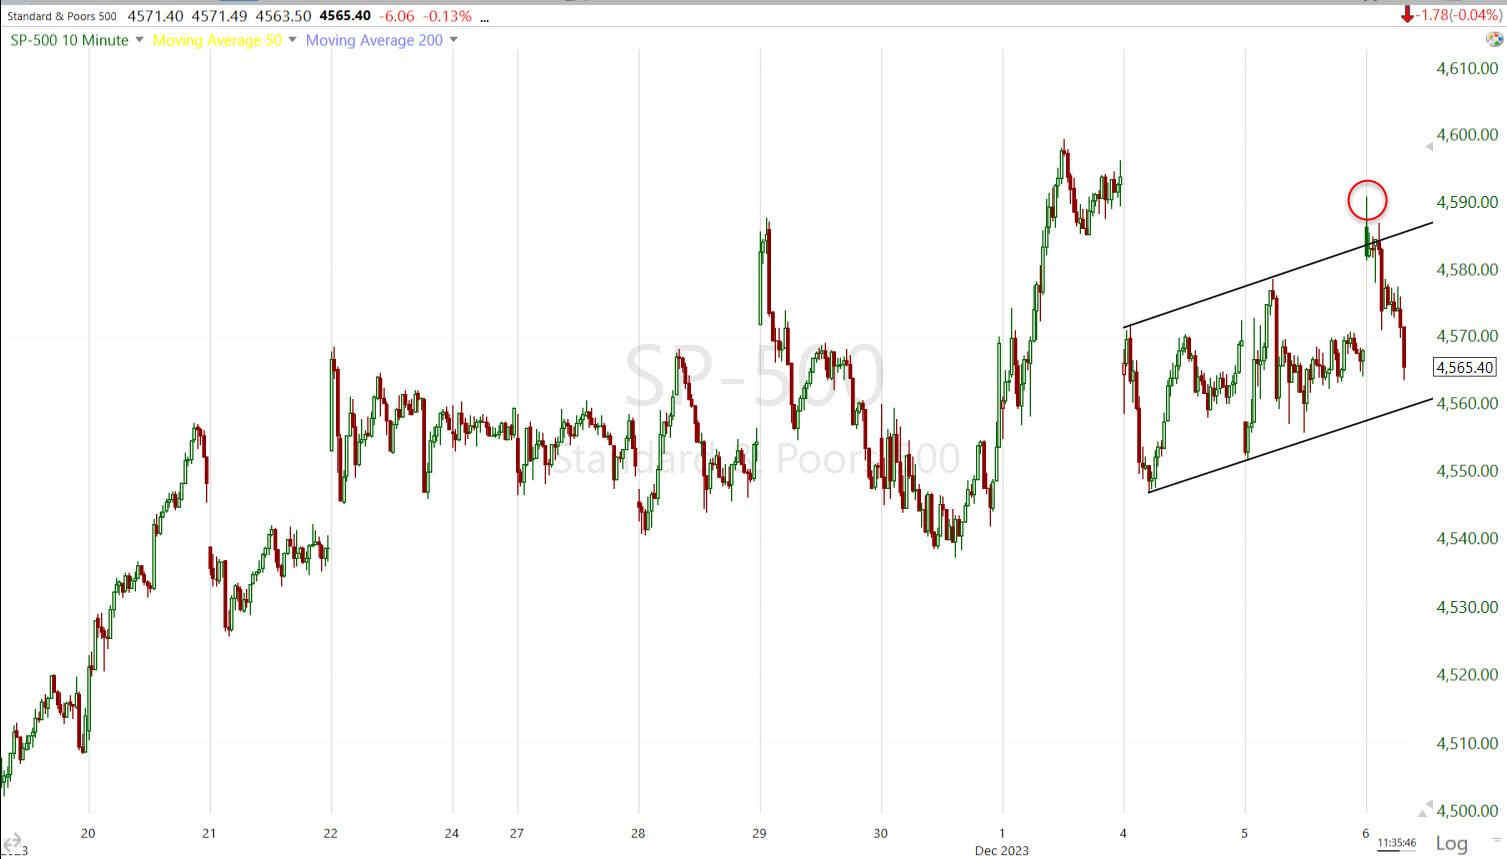 SP-500 (10m) this morning’s open in red.
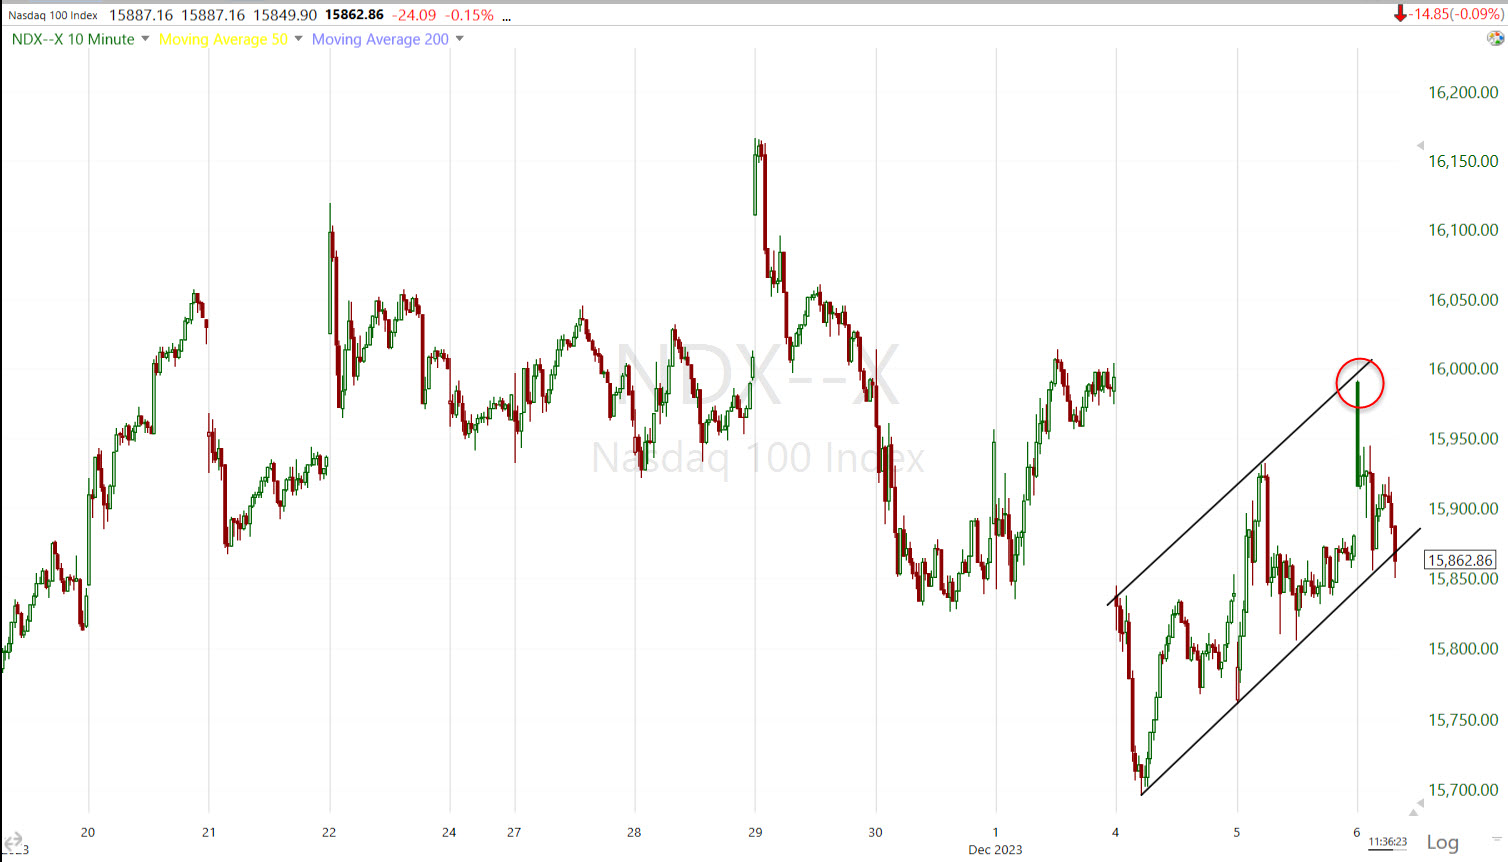 NASDAQ-100 (10m)
I didn’t draw trend lines in on what appeared to be a consolidation in the Dow coming into this week because it was not clean or evident what type of consolidation. This morning, the same applies.
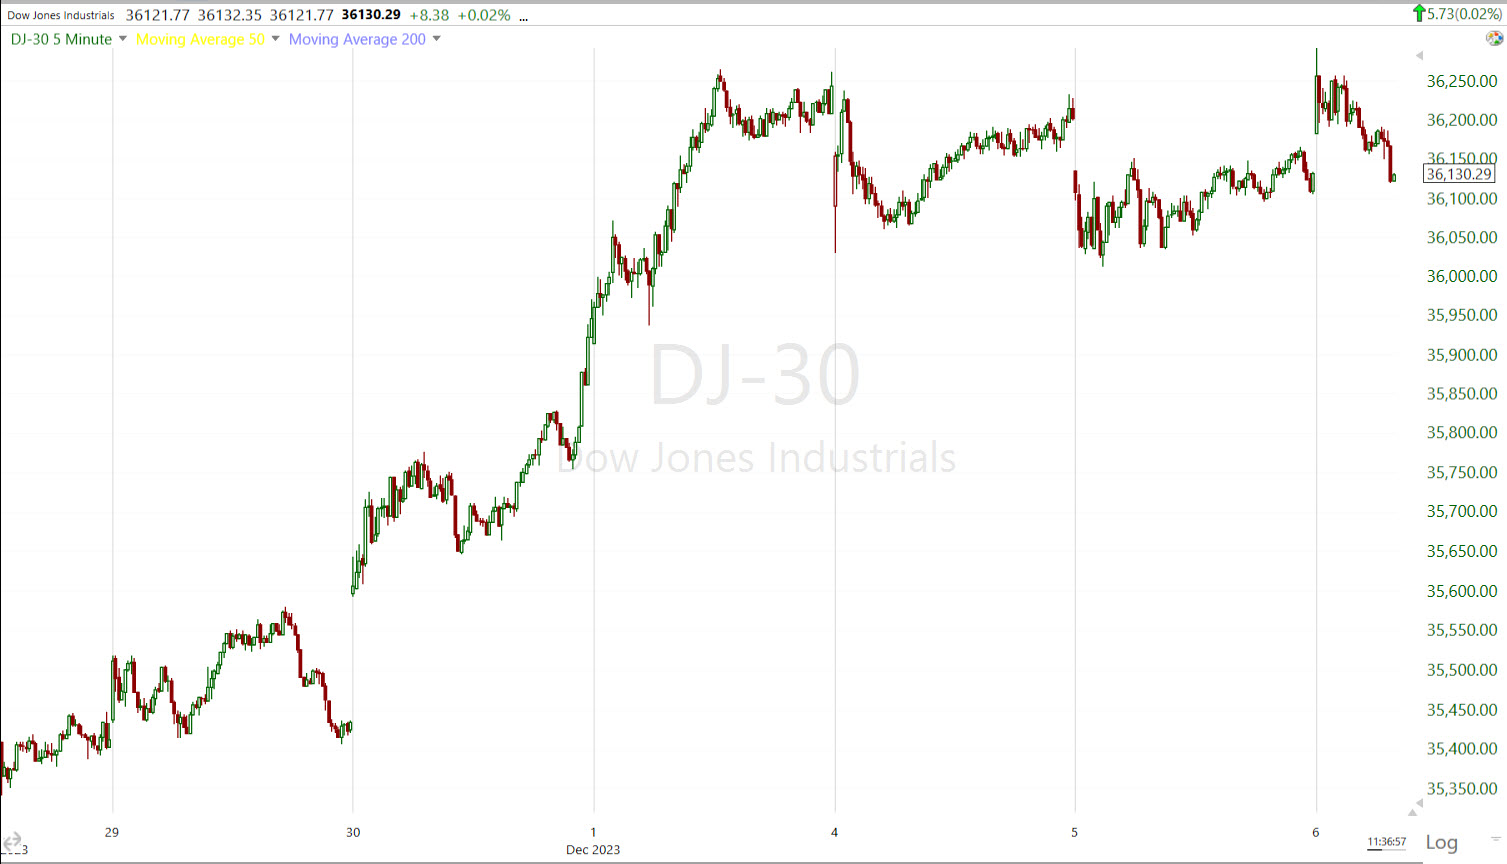 Dow (5m) This isn’t a bull flag. There’s a case that it could be a bullish ascending triangle. If that case were strong, I’d have drawn in the trend lines. There’s some additional information on the 3C chart at the bottom of the post that may help inform our view. What it tells me right now is 1) give the bull case the right of way based on the trend alone, but 2) I’d rather observe and wait for price to reveal itself than get involved in any meaningful way here.
My view has been and continues to be that Small Caps price action has been the most constructive of the averages with advances (due to short squeezes), followed by bullish consolidations (not all were strong bullish consolidations, but there was at least an attempt). The price action continues to look good so Small Caps still have the right of way. The question is, “How much more short covering is left, and how far can small caps get on their own without short covering?” Yesterday suggested the answer to the second question was, “Not far”.
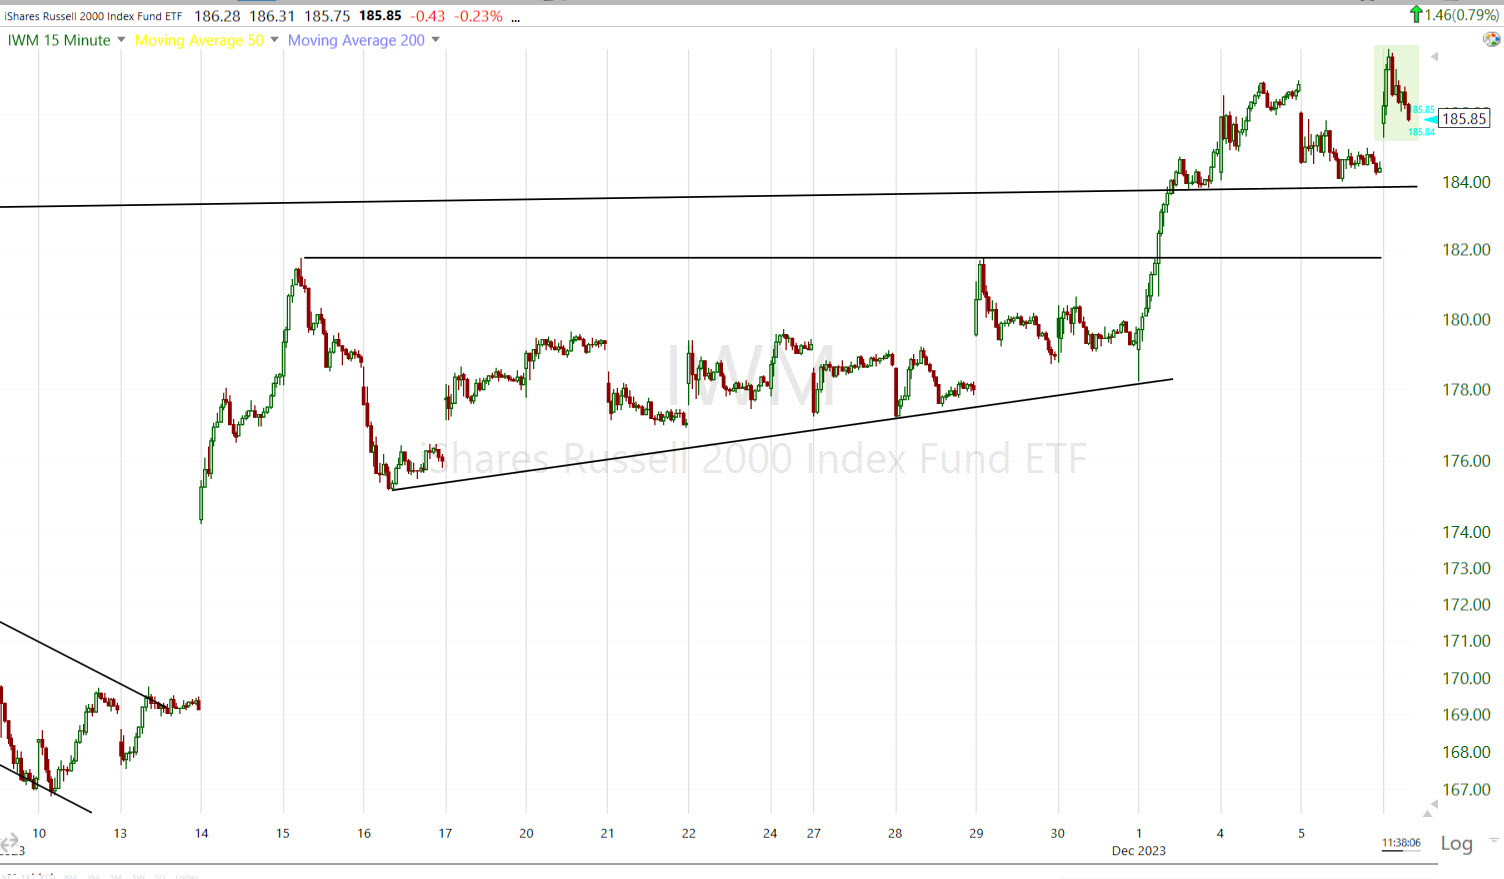 Small Cap IWM (10m) – This morning’s gains may be faltering as short squeeze momentum falters.
There’s some short covering since the open, but thus far it’s trying to retrace yesterday’s moderate slide in my Most Shorted Index. This may give us some insight as to whether the hedge funds have finally had enough of their self-fulfilling pain trade (shorting stocks, then getting squeezed, then shorting the jump in prices and getting squeezed again, rinse & repeat).
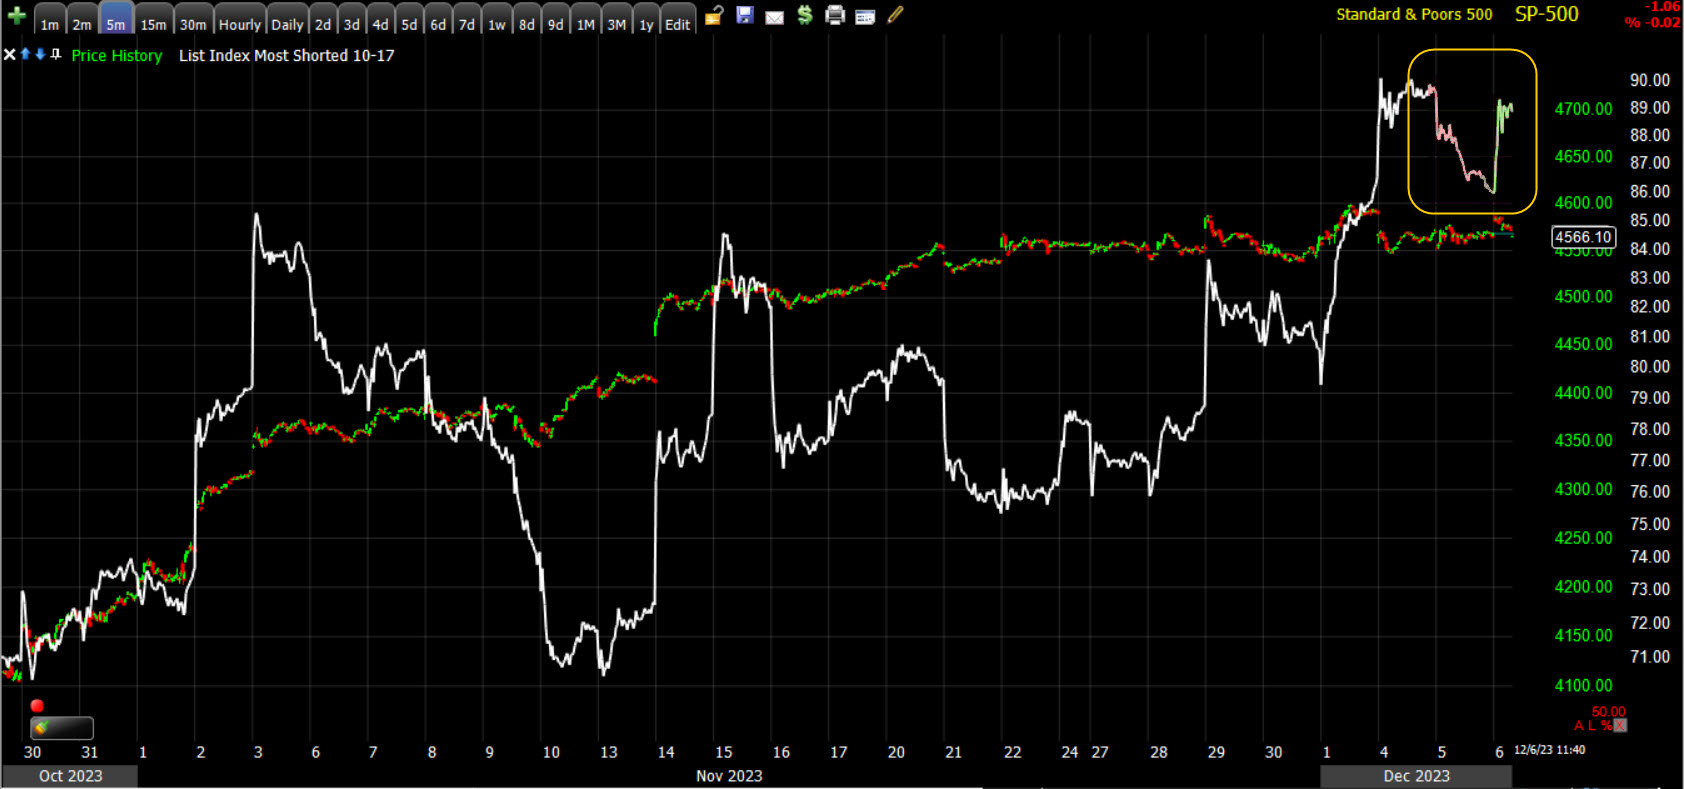 SP-500 (5m) and the MSI. Yesterday’s dip in the MSI is highlighted red, today’s “squeeze” is highlighted green. It’s not such a big squeeze.
VIX (-0.5%) and VVIX (-.7%) aren’t doing anything too unreasonable this morning. There’s slight relative weakness. VIX’s first day of relative strength on Monday hasn’t progressed any further in to a trend.
The Absolute Breadth Index is 1 point higher at 35.
In another mirror reversal flip, 8 f 11 S&P sectors are higher. Sector bias isn’t clear cut,. The cyclical and defensive sectors populate the top and middle of the leaderboard. The laggards are mixed between mega-cap heavy, cyclical and defensive sectors with the 3 red sectors being: Technology, Energy and Consumer Staples. Losses range from -0.3% to -1.4%.
In a mirror reversal flip from yesterday, the mega-caps (MGK -0.15%) lag the S&P Equal Weight Index (+0.45%) by 60 basis points.
The Tech sector’s (-0.4%) open and subsequent selling also capped price and kept it in the week’s small bear flag.
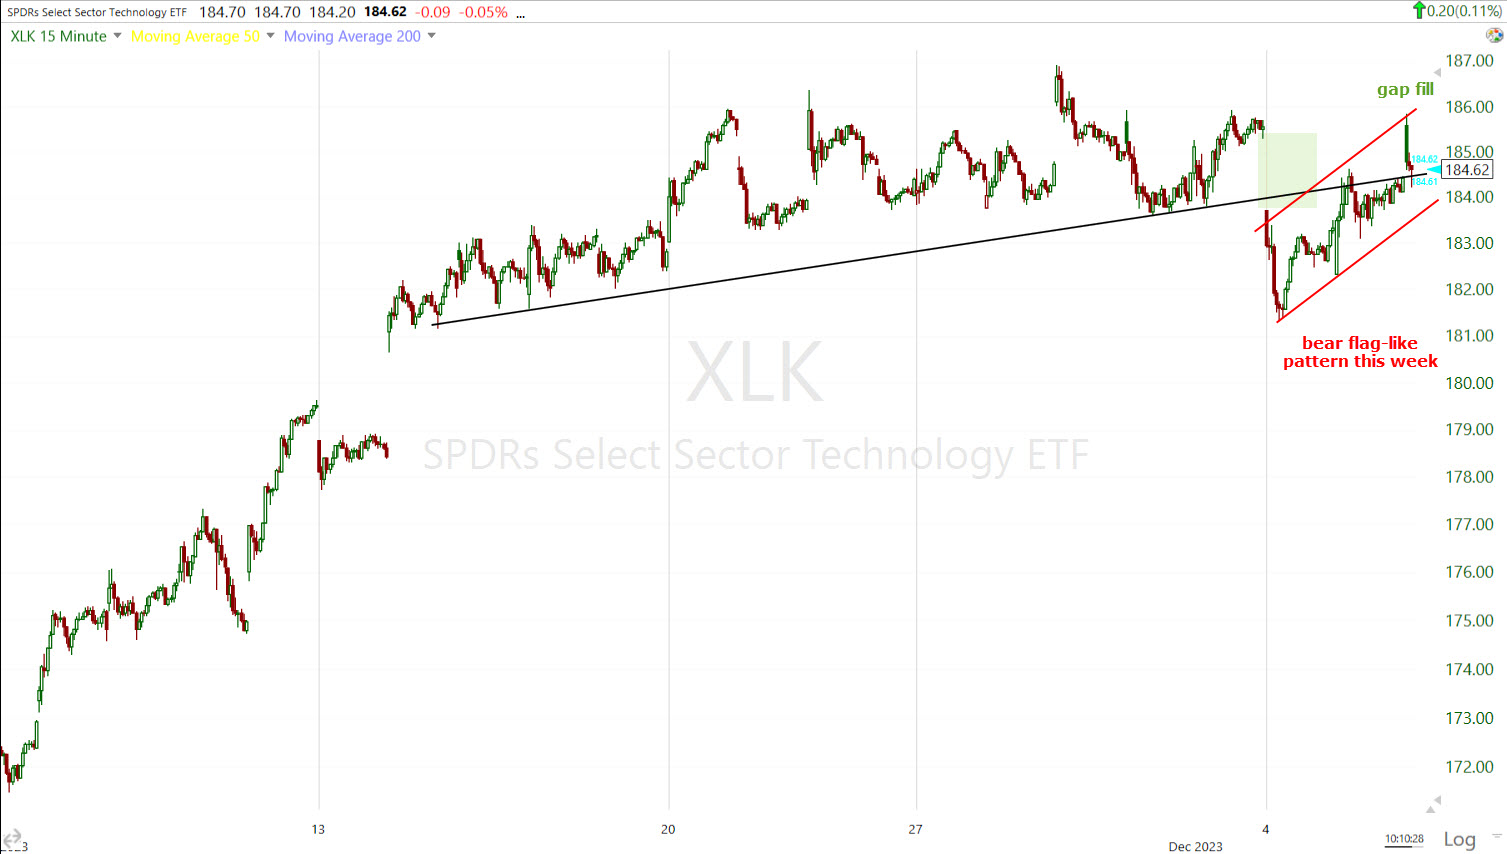 Technology sector (15m) was able to open high enough to fill Monday’s gap down (Gaps Love To Be Filled), but the outflows in to the cash open sent prices lower from there. You might notice a small bear flag-like pattern that’s formed this week after the modestly upward sloping trend was broken Monday morning. It’s a small pattern and has a small second leg down measured move of -2.25% upon a break of the flag-like pattern’s lower trend line.
Monday morning the Semiconductor Index (SOX) dipped below its large bull flag after a failed breakout the prior week. I wrote Monday that price found support at session lows and that the semis were not ready to give up the ghost yet and had more consolidating to do. This morning Semis (SOX +0.4%) are outperforming Tech (-0.4%) by 80 basis points in another mirror reversal flip, but remain well within the big bull flag that’s in question after a failed breakout attempt.
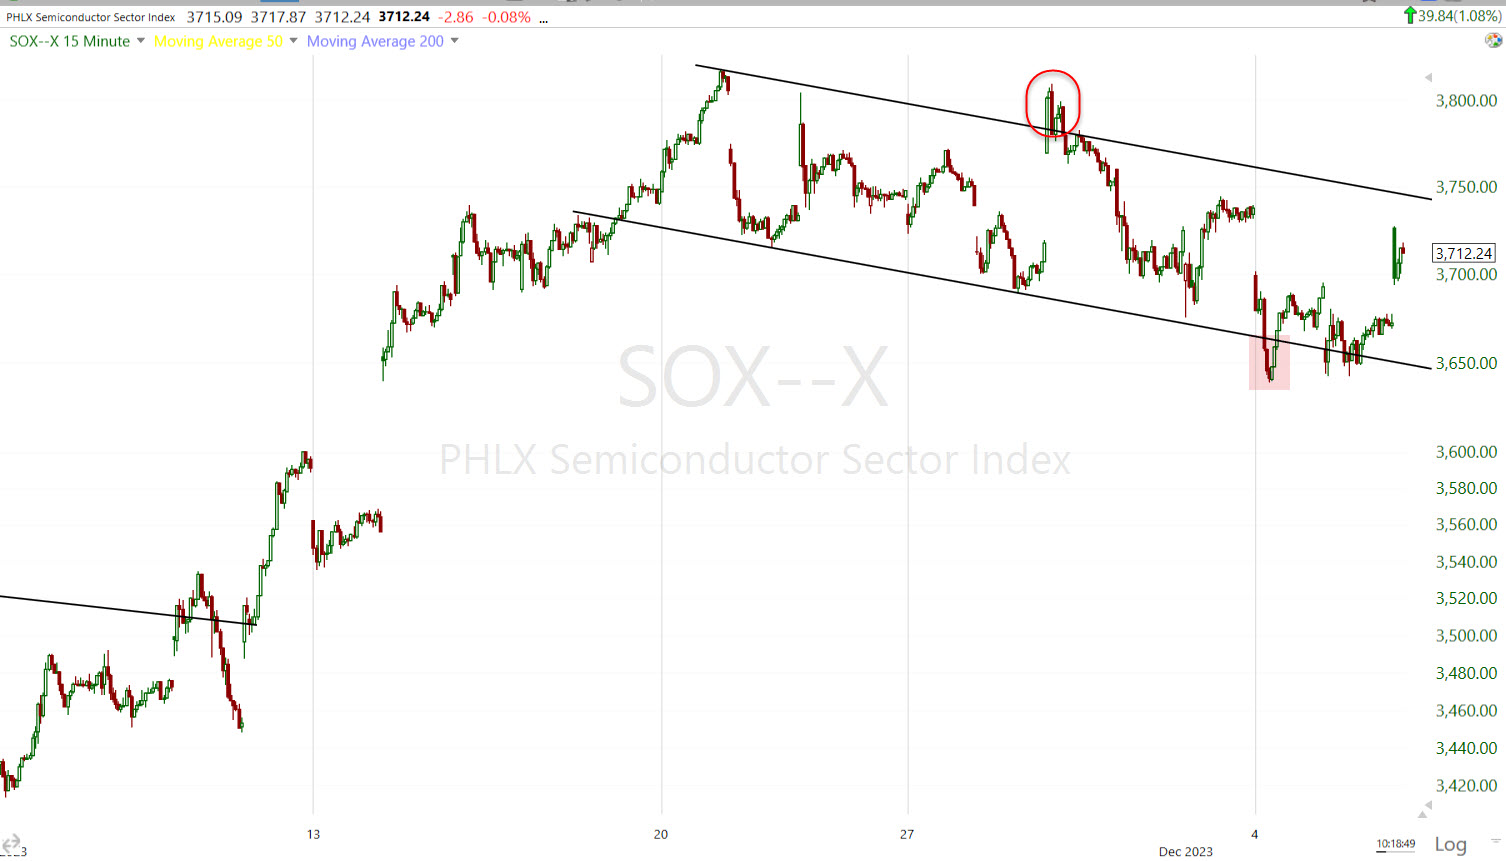 SOX (15m) the failed breakout is at the red circle and Monday’s brief foray below the flag, finding support at session lows is highlighted red.
I also mentioned on Monday that this would give key semiconductors such as Nvidia (NVDA -0.6%), which is underperforming this morning, time to trade out a larger, more mature consolidation after having just fallen and having just started a consolidation Monday.
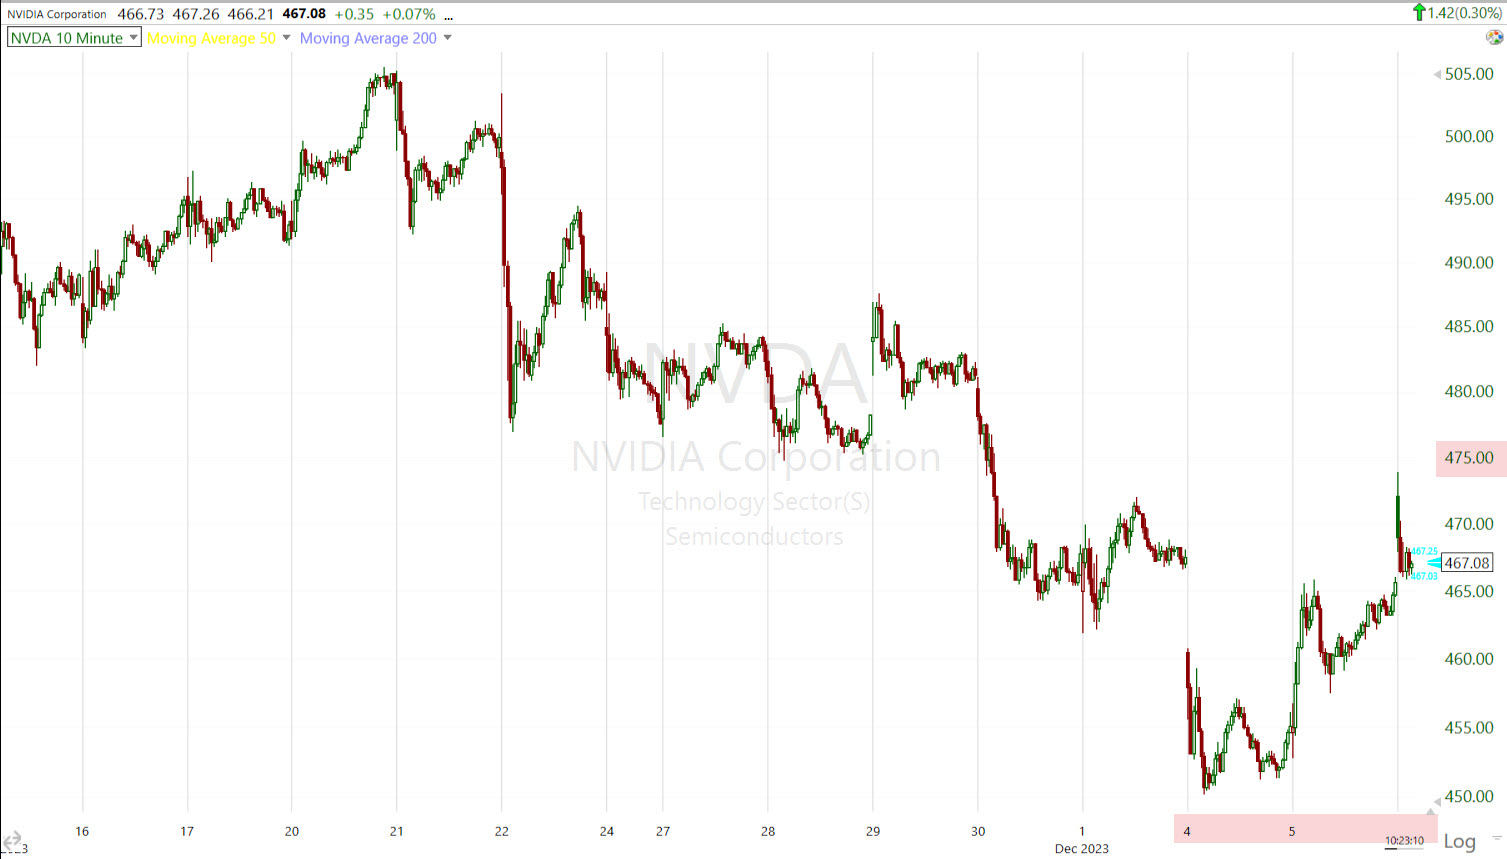 NVDA (10m) – Just eyeballing this week’s (red) pattern, it looks like a steep bear flag, but the pattern is not clean enough to draw in clean trend lines. Price did fill Monday’s gap, but also notice where it lost momentum this morning… just under that $475 area I’ve been talking about as “troublesome” for months. *Price has backed down more (another -0.4%) from $475 since this chart was captured.
In another mirror reversal flip from yesterday are the groups outperforming this morning. With small Caps leading, you can probably guess that it’s the same “usual suspects”: Regional Banks (+1.7%), Homebuilders (+1.75%), Airlines (JETS +2.75%), Biotechs (+2%).
Yields are mixed, but yields at the long end continue to be relatively weak like yesterday after another not so hot employment report. The ADP report has a reputation for being unreliable or way off when it comes to forecasting the key Payrolls report that follows Friday morning. In fact, ADP’s reputation was so bad that earlier this year they completely revised their modelling. It remains unclear if ADP is any more reliable as we’ve only had a half dozen or so reports since that remodel. In any case, one of the more notable aspects of the ADP report this morning was not the miss in Jobs added, but the type of Jobs lost for the first time in 3 years – jobs in hospitality/services, which was one of the first areas to rebound after the COVID lockdown, and has been among the most resilient since.
The 2-yr yield is up +2 bp, while the 10-yr yield is down -5 bp in curve flattening trade. the 30-year yield is down -7 bp so financial conditions continue to dramatically ease post FOMC/Powell.
HYG (+0.15%) is unremarkable considering risk sentiment and yields.
The U.S. Dollar Index (-0.1%) has been more resilient than expected the past few days, considering the moves in Treasuries. I suspect this has to do with money flows as 1) the Dollar recaptured its 200-day sma Monday, and 2) is putting in a cleaner and cleaner inverse H&S bottom around its 200-day.
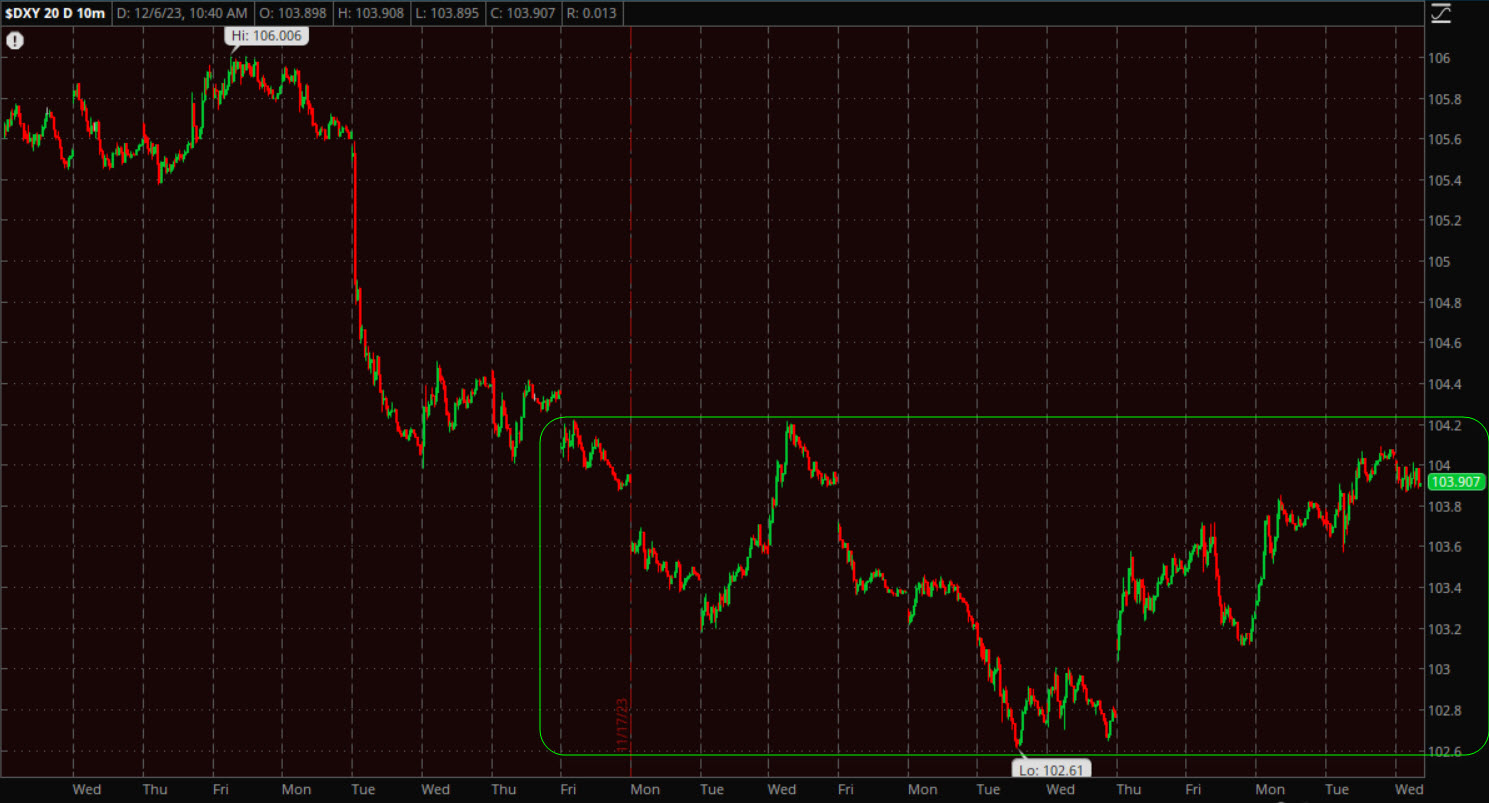 U.S. Dollar Index (10m) – On Monday I could see the base, but it was still a little oddly shaped. Now it’s picture perfect for an inverse head and shoulders base (the same base Small Cap IWM put in from late October to early November as the other averages were still trending lower, and the base that launched the entire short squeeze rally in November.
The Dollar breaking out of this base should be a significant headwind for stocks (and gold), just the Dollar basing is already starting to provide a divergence or leading market signal.
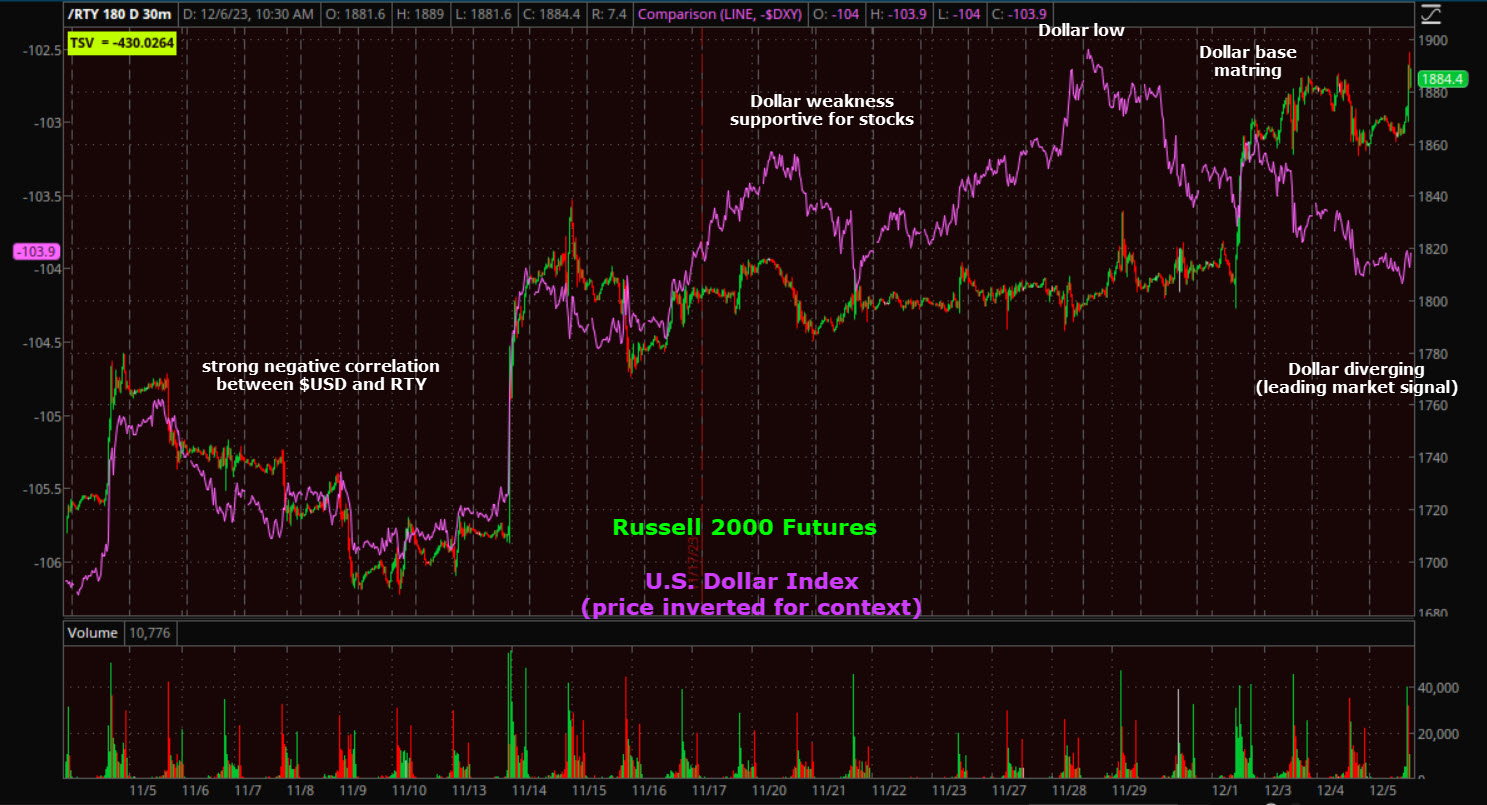 Russell 2000 futures (30m) and U.S. Dollar Index w/ price inverted for context. Just read the noted on the chart from left to right. The divergence that’s forming now is not quite at the “definitive” or high probability stage, but the Dollar breaking out of the base should probably do it. Remember that leading market signals from rates/Dollar have had a tendency to lead for about a week before we see a price reversal (up or down) from equities.
The question in my mind is whether yields move higher along with the dollar, OR, have yields finally reached that inflection point in which their negative correlation of nearly 2 years, finally flips back to the historical norm and lower trending yields represent the macroeconomic growth environment? That will be a major sea-change in market leading signals, and probably what groups of stocks outperform and underperform.
WTI Crude Oil futures continue to be very ugly, down -4% and already having fulfilled last week’s small bear flag downside measured move, and now surpassed it by another -2%. It looks to me like that larger OPEC “area of uncertainty” bear flag is seeing a second leg down. The problem with an accurate measured move is the interruption in price action from OPEC, so we don’t have that nice clean drop in price or the “Flag pole” of the bear flag pattern, which is where the measured move comes from.
I can only “best guess” it and there’s subjectivity and there’s enough validly to make reasonable arguments for several different measured moves because of that subjectivity. They are all lower.
The reasonable arguments range from -10 to -11%, of which about -7.75% has already been fulfilled, all the way out to -17 to -18%. I think the 10% to 11% is the most reasonable, and if the 17% to 18% is probable, then we’ll almost certainly see smaller bear flags as pit stops along the way that should give updated target levels and tell us that price remains bearish. If you’re not trading Crude short (I see no argument for trading crude long), this information is still very important as Crude Oil is following the trajectory of disappointing economic data as seen in last night’s Daily Wrap. This is a very important leading macroeconomic signal that crude weakness is sending and is right on time for the H1 2024 recessionary conditions.
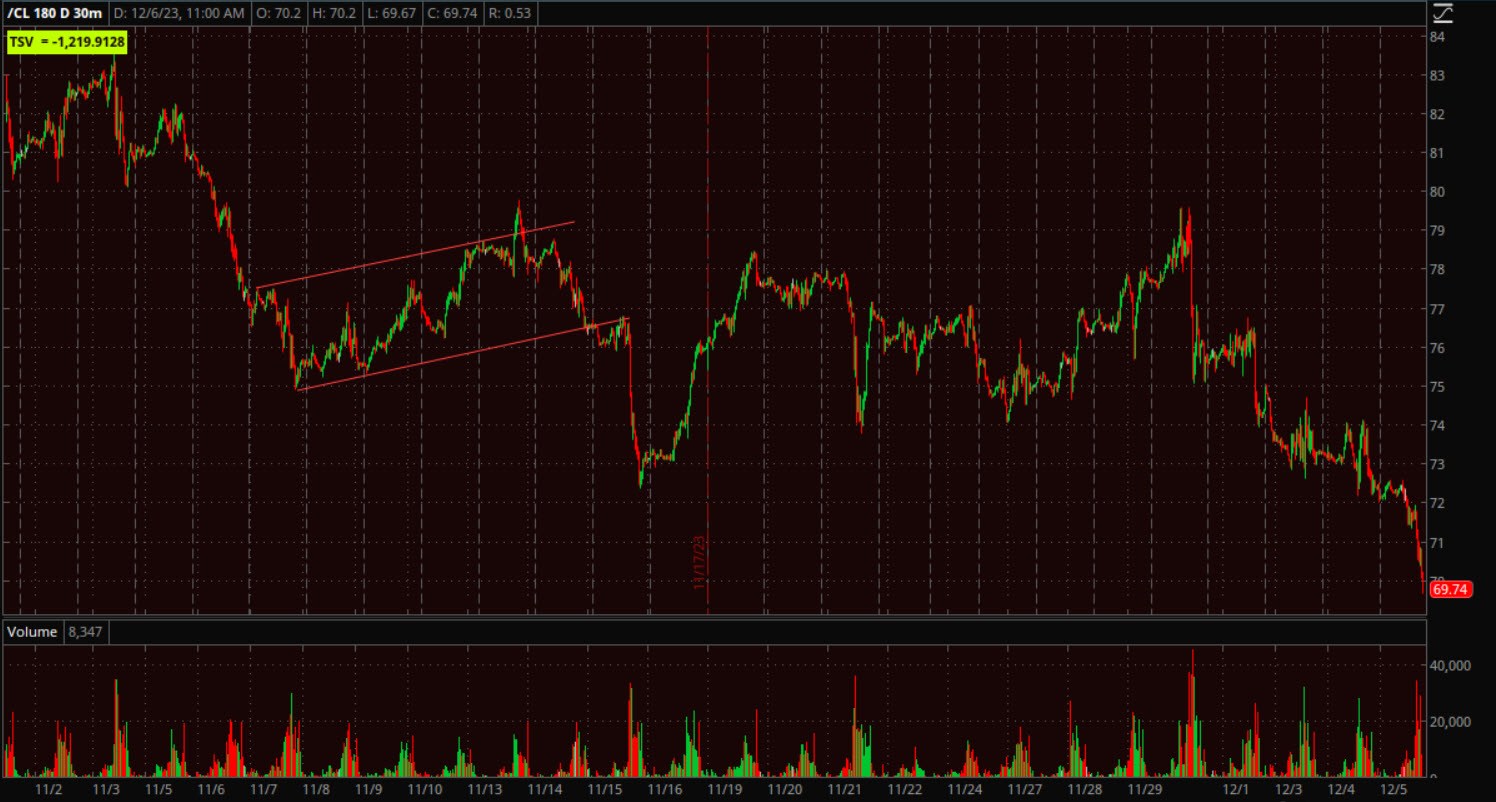 WTI Crude Oil Futures (30m) well below the mid November OPEC intervention low and notice how heavy the Volume is today. *Oil is down another -1% since capturing this chart.
On a side note, most of the crashes I’ve called well in advance have featured a strong lead market signal from Crude Oil (as well as other assets including plunging long term bond yields). I’m not saying Crude is forecasting a market crash, but if the -18% target becomes reality, and with stocks, and more importantly cyclical stocks rallying like this, it’s the typical environment seen before a crash – one in which sophistaced markets like fixed income, commodities and FX are sending massive deflationary signals, while stocks rally and are the last to get the memo, putting them in a position where they are sharply overvalued as compared to the macroeconomic backdrop. We certainly have some element of that in place right now.
Gold futures are up +0.55%, but since that bearish engulfing candle to start the week, at record highs, the price action in Gold still has a bearish slant. It’s not real clean in terms of forecasting measured moves, but the bearish bias tells us enough for now.
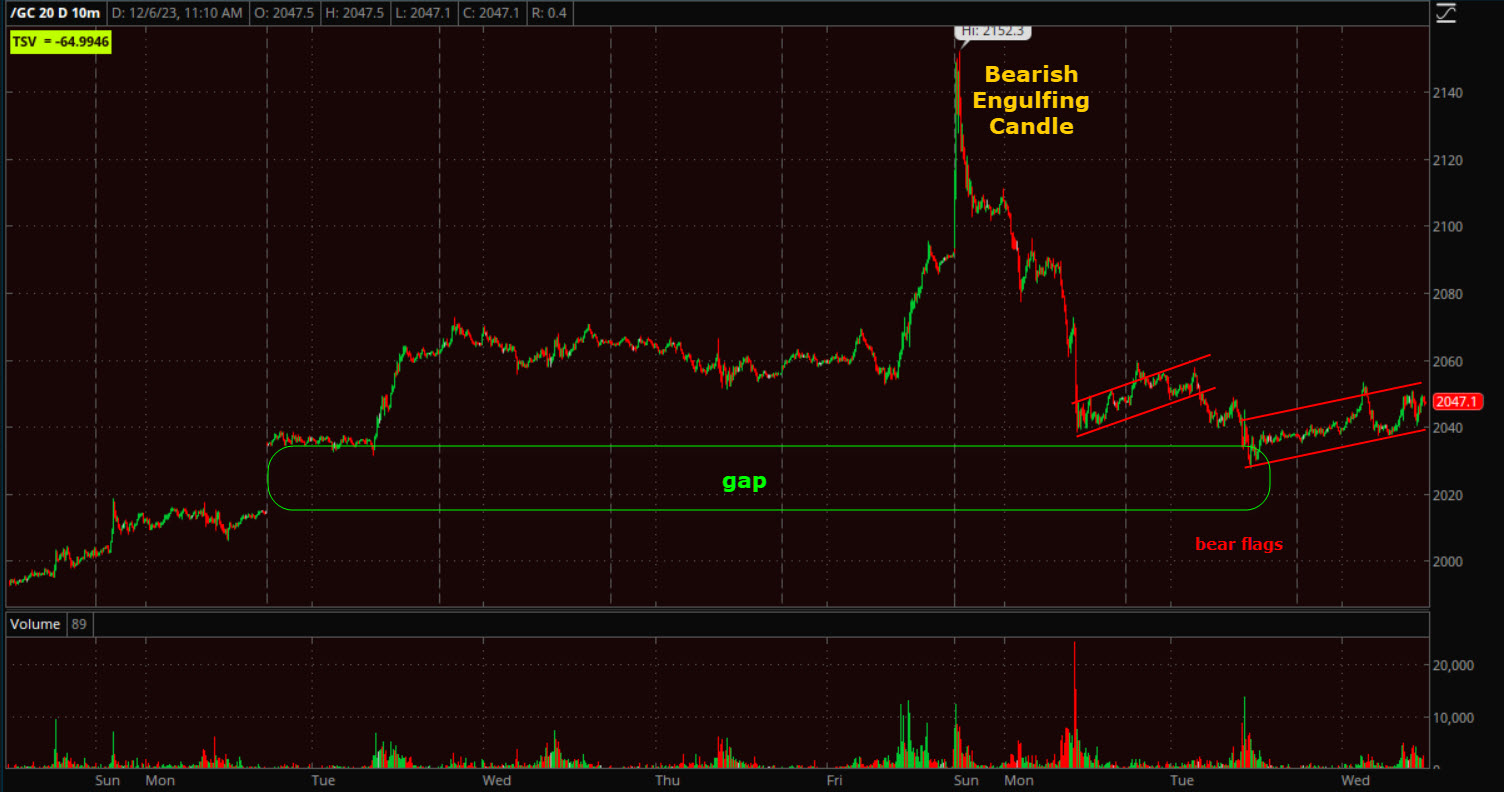 Gold Futures (10m) – the first bear flag had a larger downside measured move, but the gap acted as a speed bump (local support) so that measured move is yet to be hit (I think it was something like -2.5% of which less than 1% was fulfilled. However, price is in another bearish flag at the gap support or speed bump.
URA (-0.8%) is pulling back from resistance as discussed.
UNG (-5%) is down similar to Nat-Gas futures (-5.2%). The question is whether the modest first signs of buyers yesterday abandon their efforts, or step them up into sharply lower prices. UNG’s 3C chart is unchanged from yesterday, but Nat Gas futures just started dropping sharply at 11:15 a.m. (inventories?).
As for the averages’ 3C charts, I’m seeing some really interesting movement now.
SPY’s 1 min. (fastest, most sensitive timeframe I use) is confirming with the small bearish flag price action of this week. The 3 min. November trend timeframe is seeing additional negative divergence with a new leading negative low this morning.
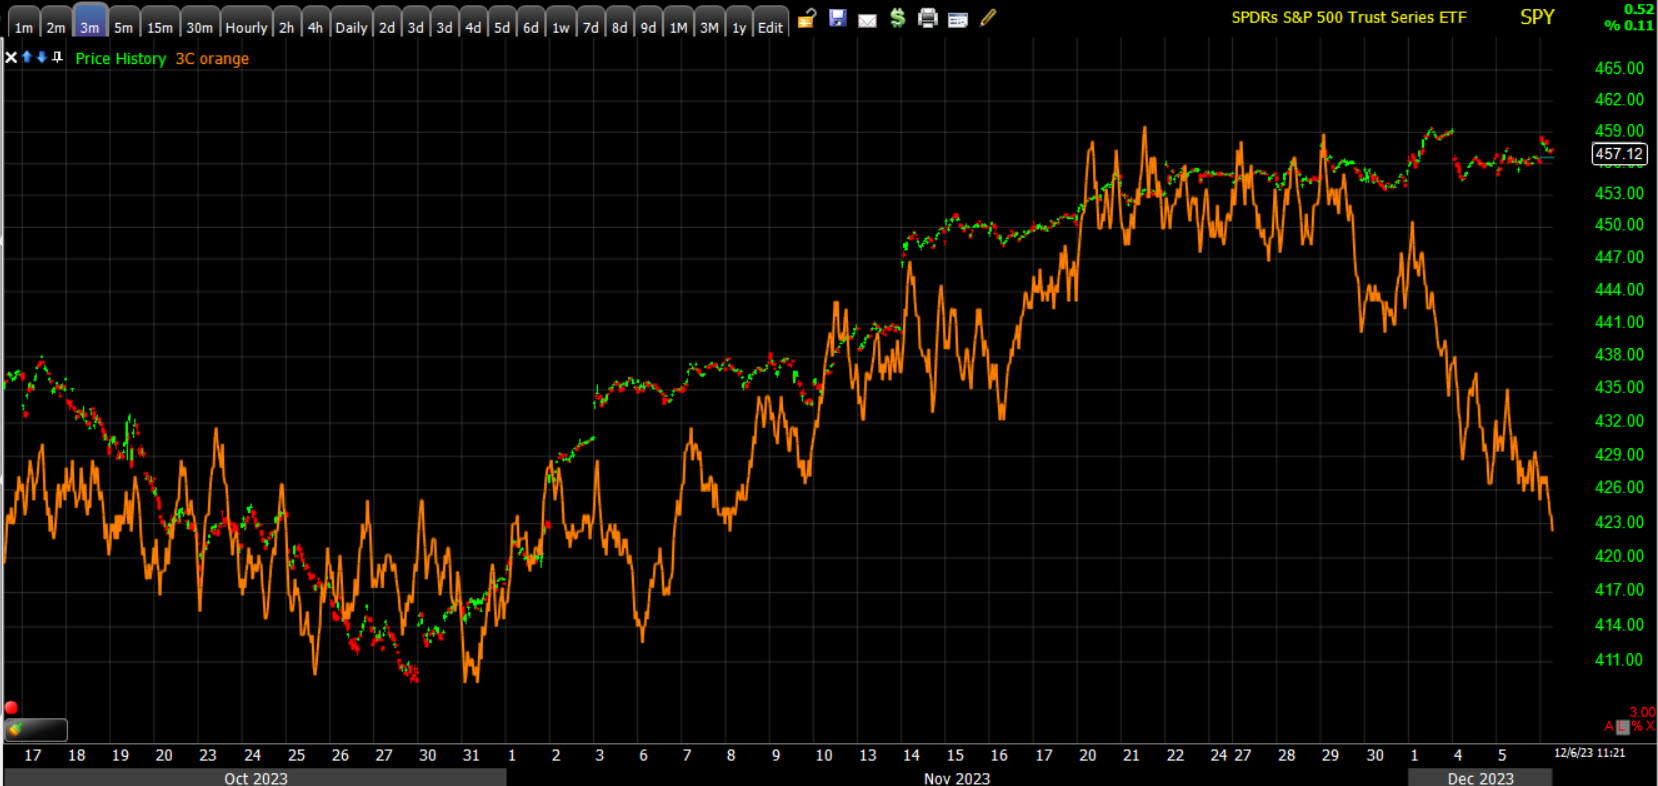 SPY (3m) notice how 3C does an excellent job of confirming the November price gains, but something’s changed heading into December. We know a big part of that is mega-caps. 3C is making a new leading negative low so this is getting closer and closer to what I’d consider to be an actionable divergent signal.
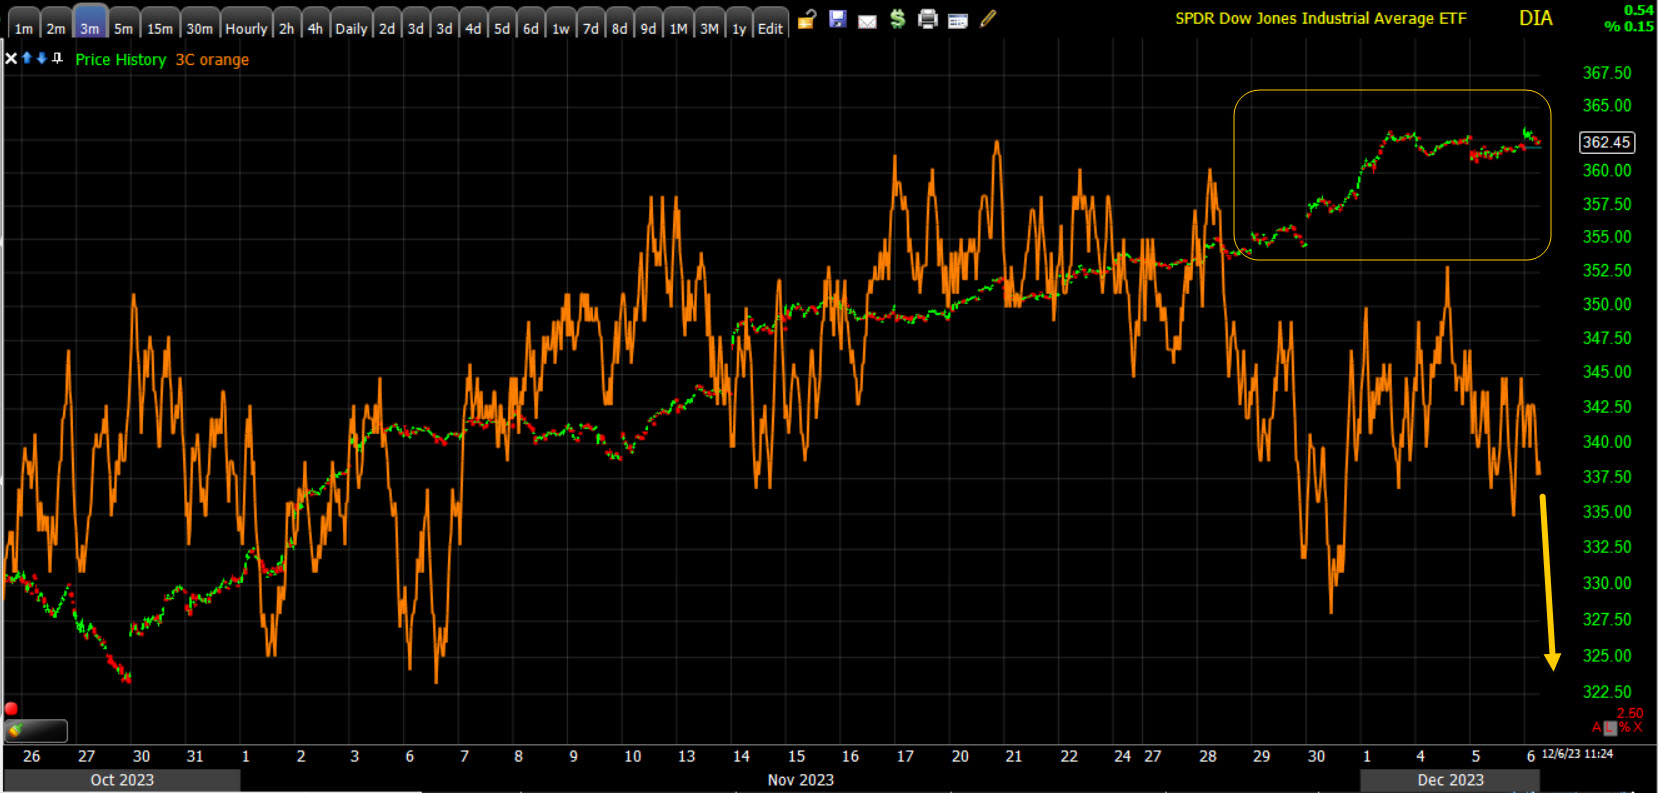 DIA (3m) Just as the Dow’s price started going parabolic (that’s price representing euphoric conditions starting to present and usually that’s dumb money chasing), it appears “smart money” started offloading into that ramp. If, or when we get a leading negative signal as drawn in at the yellow arrow (and presumably SPY’s 3C chart is way worse by then), I’d make the call that the Dow too is at very high risk of a downside price reversal. The size and amplitude of the divergence will factor in to the expected reversal’s potential downside.
This is another chart telling us that something changed as we entered December.
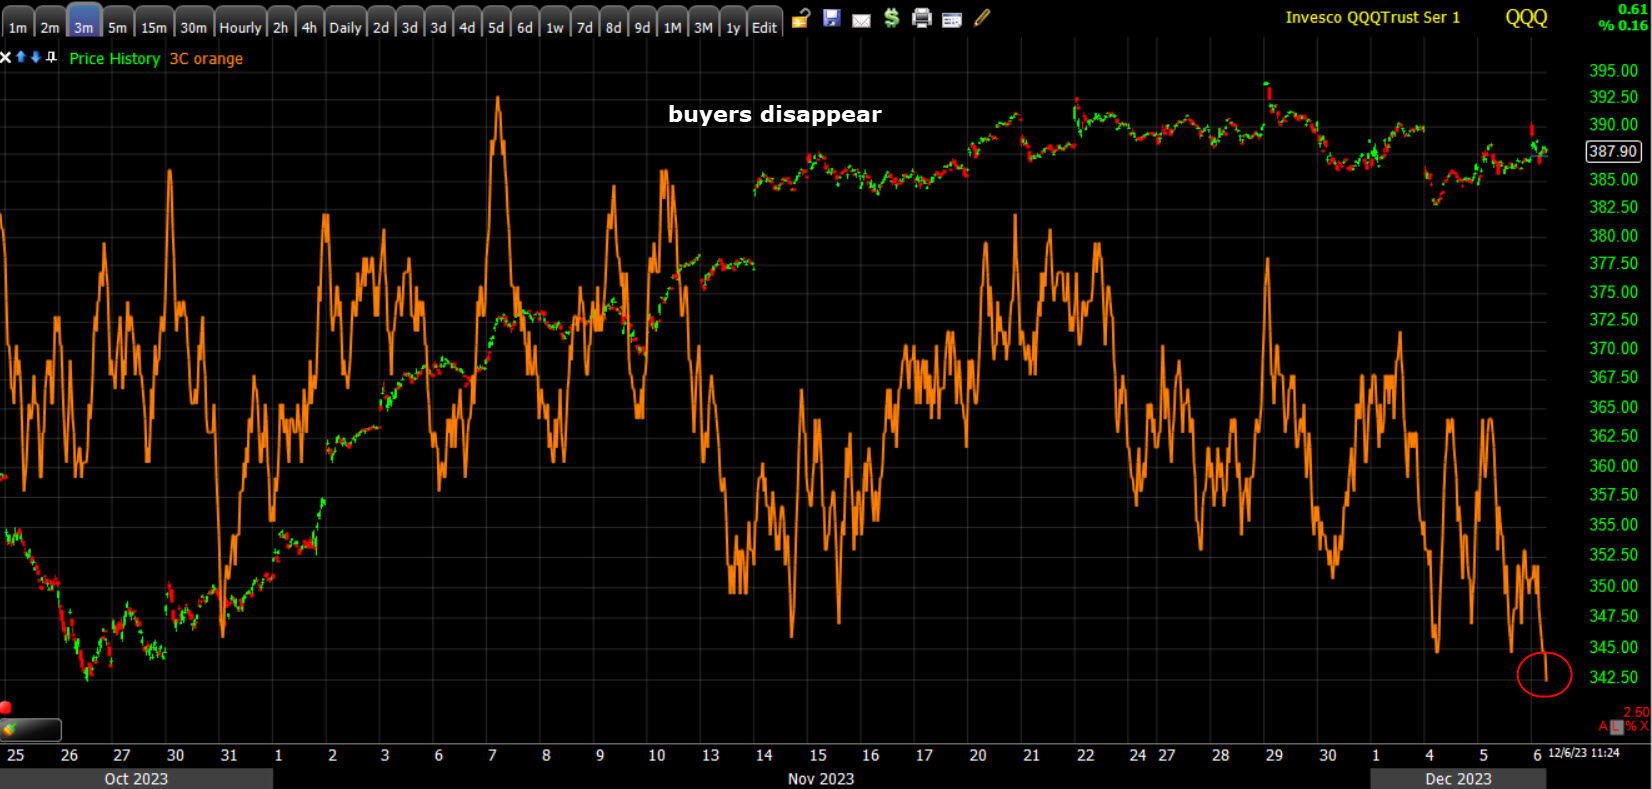 QQQ (3m) I won’t belabor the point of the “buyer’s strike” from mid-November and the increasing relative weakness of mega-caps since. I will point out that QQQ’s 3C trend timeframe is starting to make a new negative leading low.
*This is just opinion, not backed up by anything on the charts, but I wouldn’t be surprised to see a brief spurt of buying of mega-caps/NASDAQ some time toward the end of the month as some funds “Window Dress” into quarter’s end so they can make it appears that they owned the best performing stocks of 2023 by quarter’s end on the prospectus’ for new clients, whether they actually owned them or not is not relevant, and that’s why it’s called, “Window Dressing.”
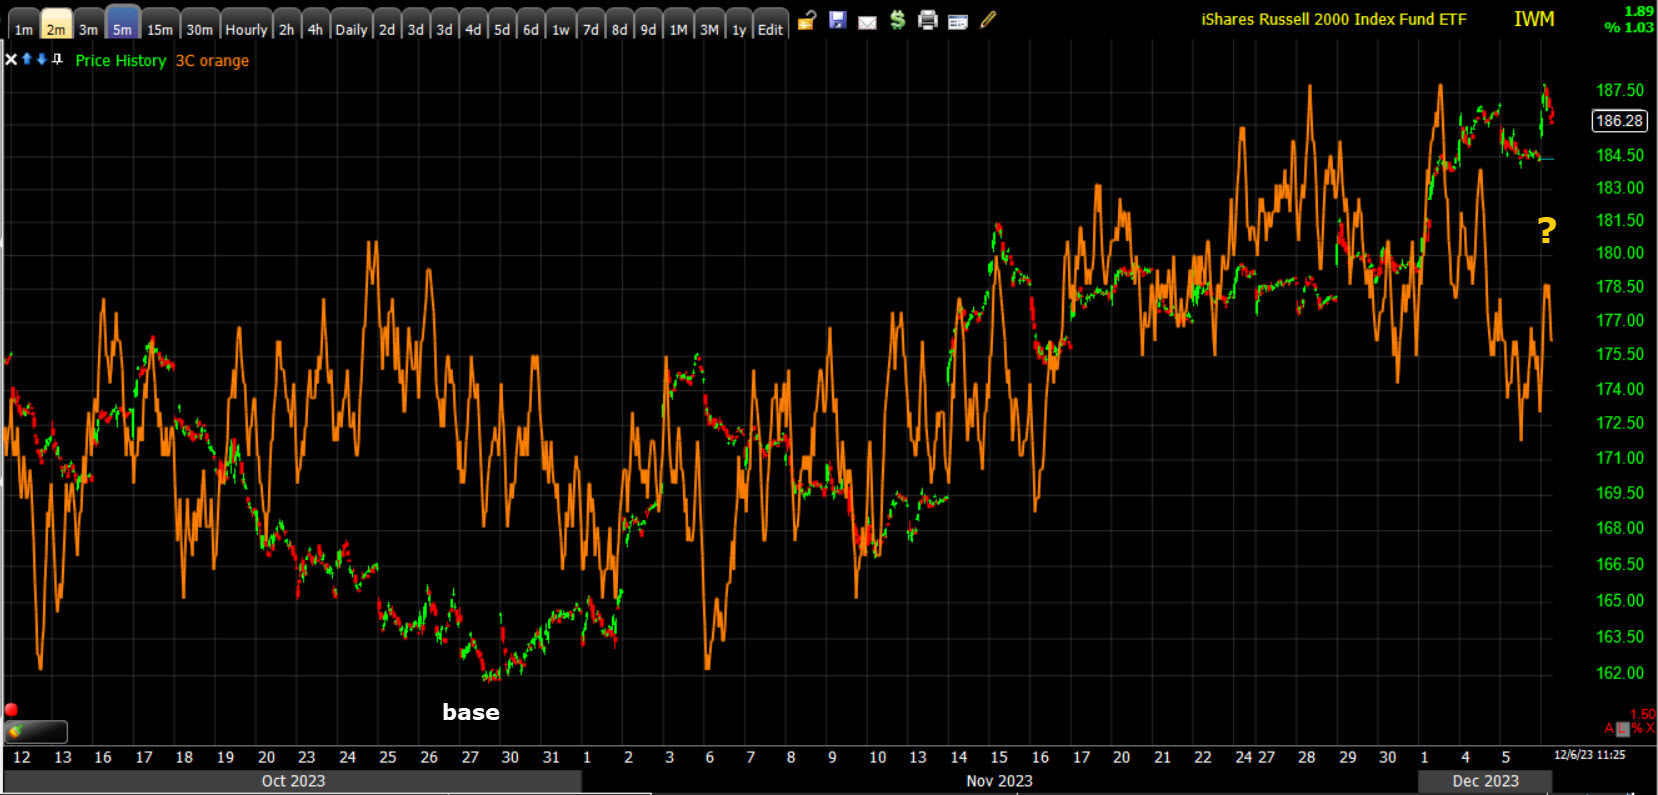 Small Cap IWM (5m) – Price action looks the best in this index, as does the 3C chart, but like the others, it does look like there’s a change in character coming into December. This is not a chart/signal I’d make a downside call on right now, which is why I have a “?” on the chart. I’m going to keep watching and see where it goes from here. My guess would be that 3C weakens from here.
These are very interesting signals now, especially considering the leading market signal developing in the U.S. Dollar Index.