The major indices all closed with sizable gains, ending near their highs of the day on heavier than average volume, and solid internals. Equities reacted to a sharp drop in rates on the heels of the better-than-expected October Consumer Price Index (CPI), which corroborated the market’s thinking that the Fed is done raising rates following Powell’s FOMC press conference in which he noted (paraphrased), the Fed probably doesn’t have to do much since the market is tightening financial conditions for the Fed. Ironically the rally about a week and a half ago took back about half of that tightening (50 bp of 100 bp of estimated tightening) and today’s took back more. I wouldn’t be surprised if it took back nearly all of the tightening Powell applauded. It’s got to be awkward for Powell in the halls of the Marriner S. Eccles building the last 2 weeks.
” if yields really get some upside traction in their bounce off the trend line, which makes tomorrow’s CPI report a key piece of economic data. That would be very bad news for stocks. Conversely, a cool CPI report should be helpful for stocks, but I don’t think inflation is what’s been behind the several month, sharp rise in long term yields. I think it has to do with the U.S.’s unsustainable fiscal posture and a few other somewhat related developing situations.”
The CPI report was absolutely key and market moving, coming in cooler than expected across the board from headline to core CPI, on a sequential and year-over-year basis. Core inflation dropped to its lowest level in two years to levels seen before the Fed began its rate hike cycle.
That tends to confirm my view that the recent blowout in long term yields is not driven by inflation. Recall that June of 2022 our Copper : Gold ratio indicator said inflation was peaking.
The jury is out at the moment with regard to the ultimate path of long term yields and the reason, although I clearly have my suspicions which I think were supported with today’s CPI data (long end not rising b/c of inflation).
As has been the case, index futures traded in lock-step with treasuries in reaction to the CPI (inversely to yields and the Dollar).
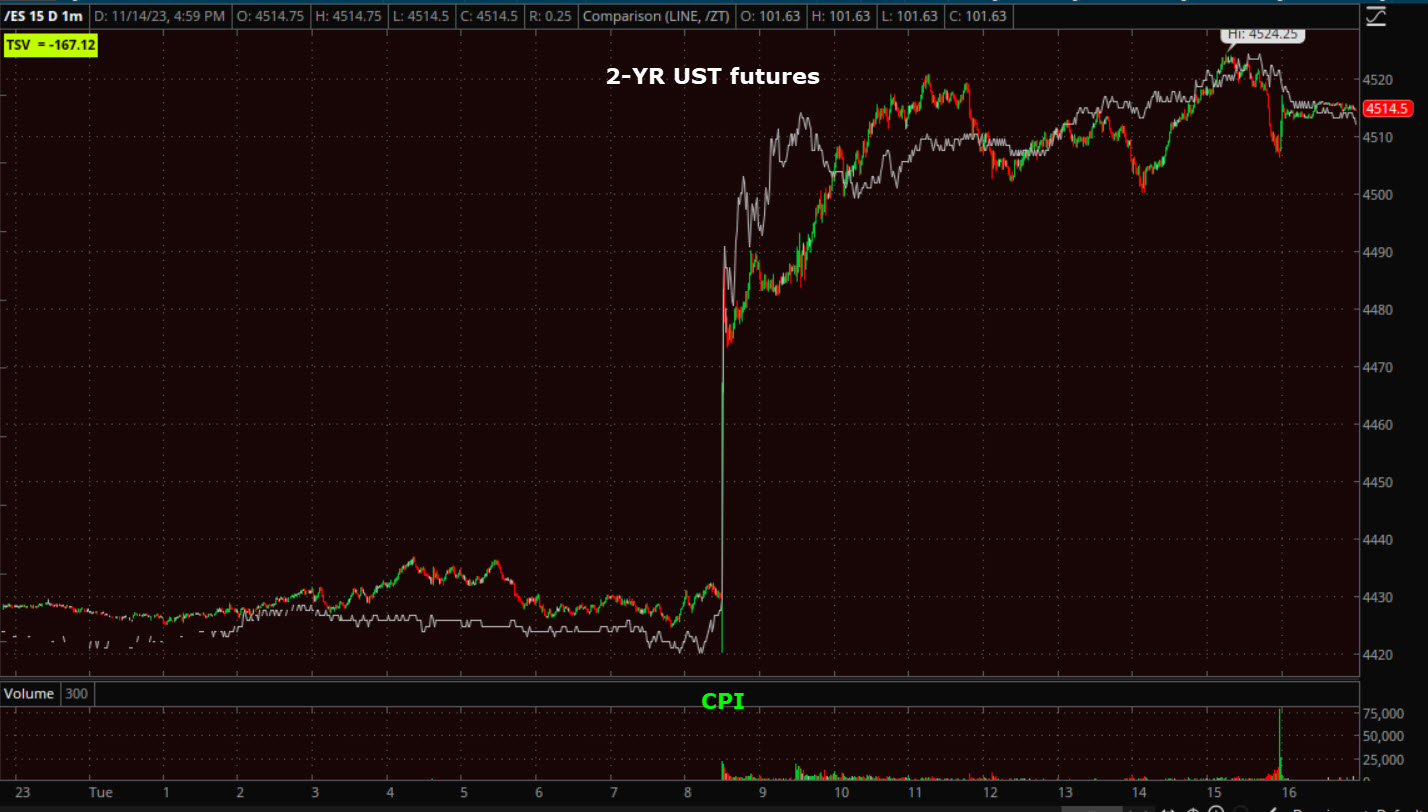 S&P futures (1m) and 2-yr UST futures
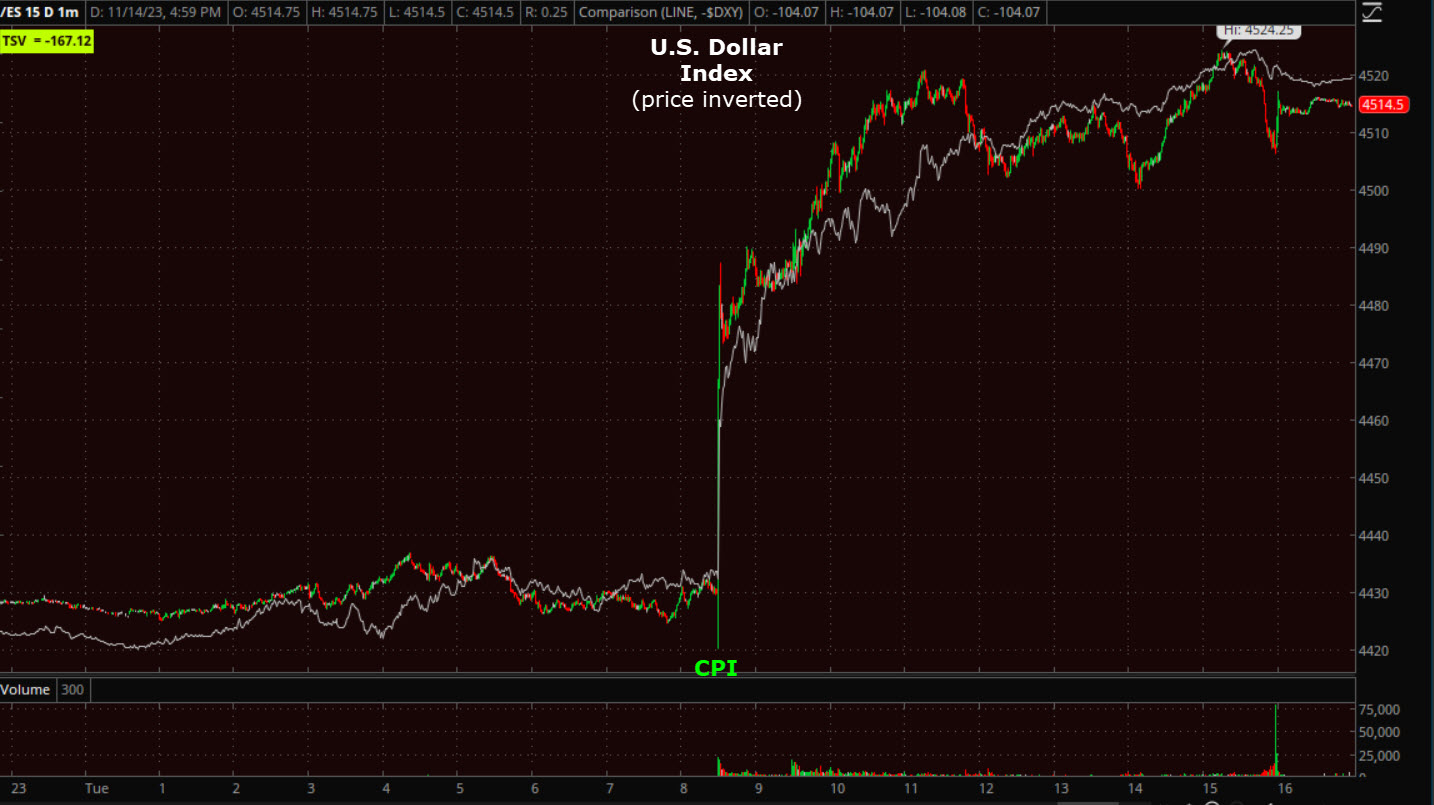
S&P futures (1m) and U.S. Dollar Index (inverted)
Averages
The rally was broad-based with 95% of S&P components closing higher; 94% of the NASDAQ-100 component stocks closed higher; and 25 of the Dow 30 component stocks closed higher.
Dow Transports (+3.3%), which may have been the only average with a clear, legitimate bullish consolidation from last week (bull flag), outperformed Dow Industrials by more than 100%. Between Small Caps and Transports outperforming again, I get the same feeling as the early November rally – that mega-caps are out of favor and this rally is what I characterized as a “Dash for trash” driven by short covering, meaning the most beaten up, deeply discounted underperforming stocks of the year, both short squeezed and bought for a reversion to the mean trade.
The averages’ early intraday gains transitioned to a lateral range around 1 p.m. ET
S&P-500 ⇧ 1.90 %
NASDAQ ⇧ 2.13 %
DOW JONES ⇧ 1.43 %
RUSSELL 2000 ⇧ 5.44 %
The S&P 500, which flirted with the 4,100 level on October 27, was trading above 4,500 at its high today before settling the session just below that level.
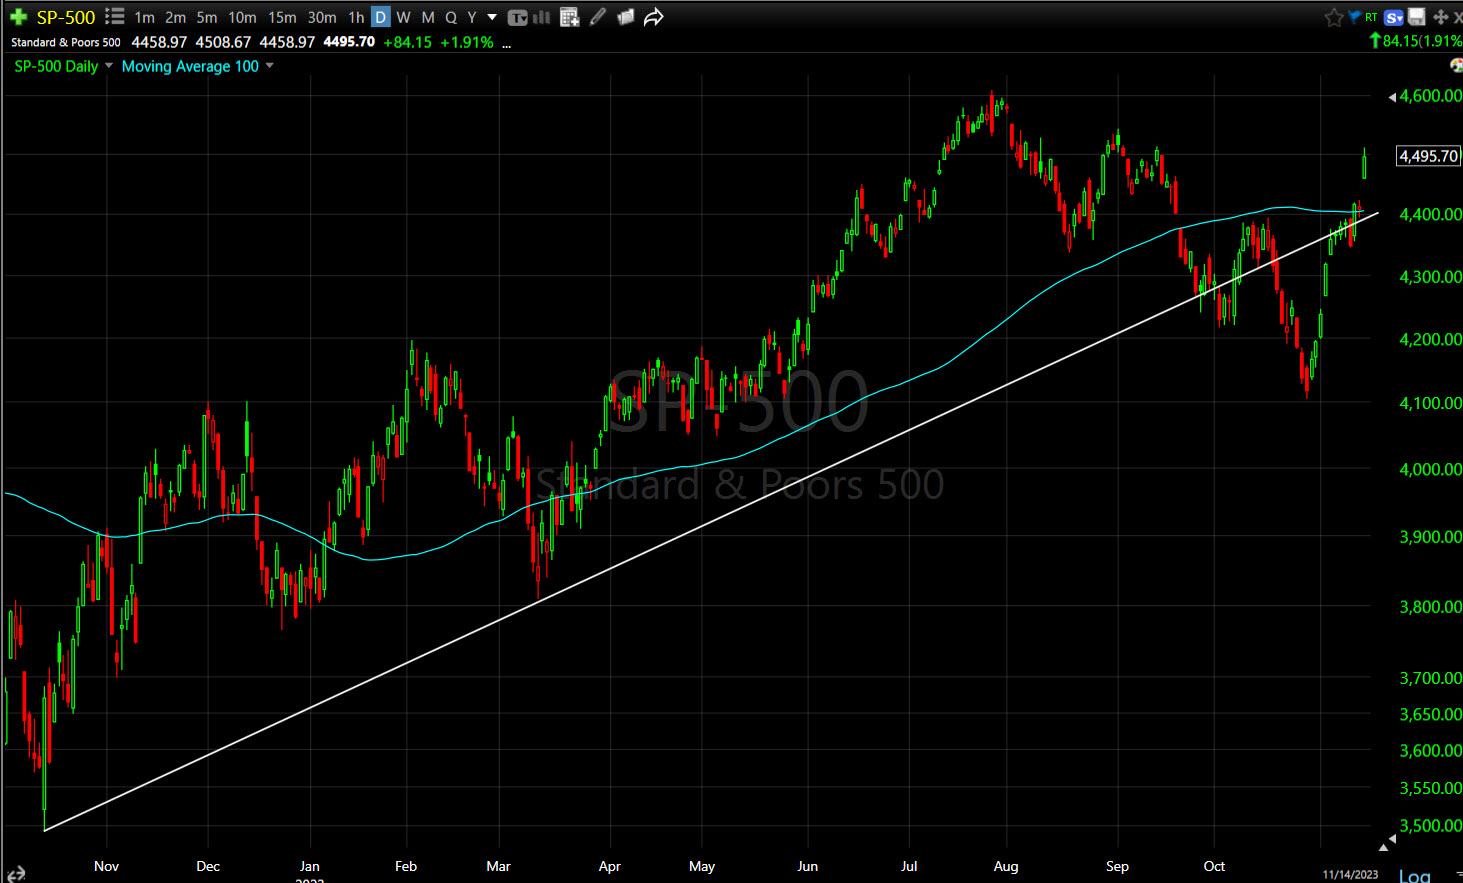 SP-500 (daily) this is the intermediate up trend from October 2022, and the 100-day sma (blue hovering around $4400.
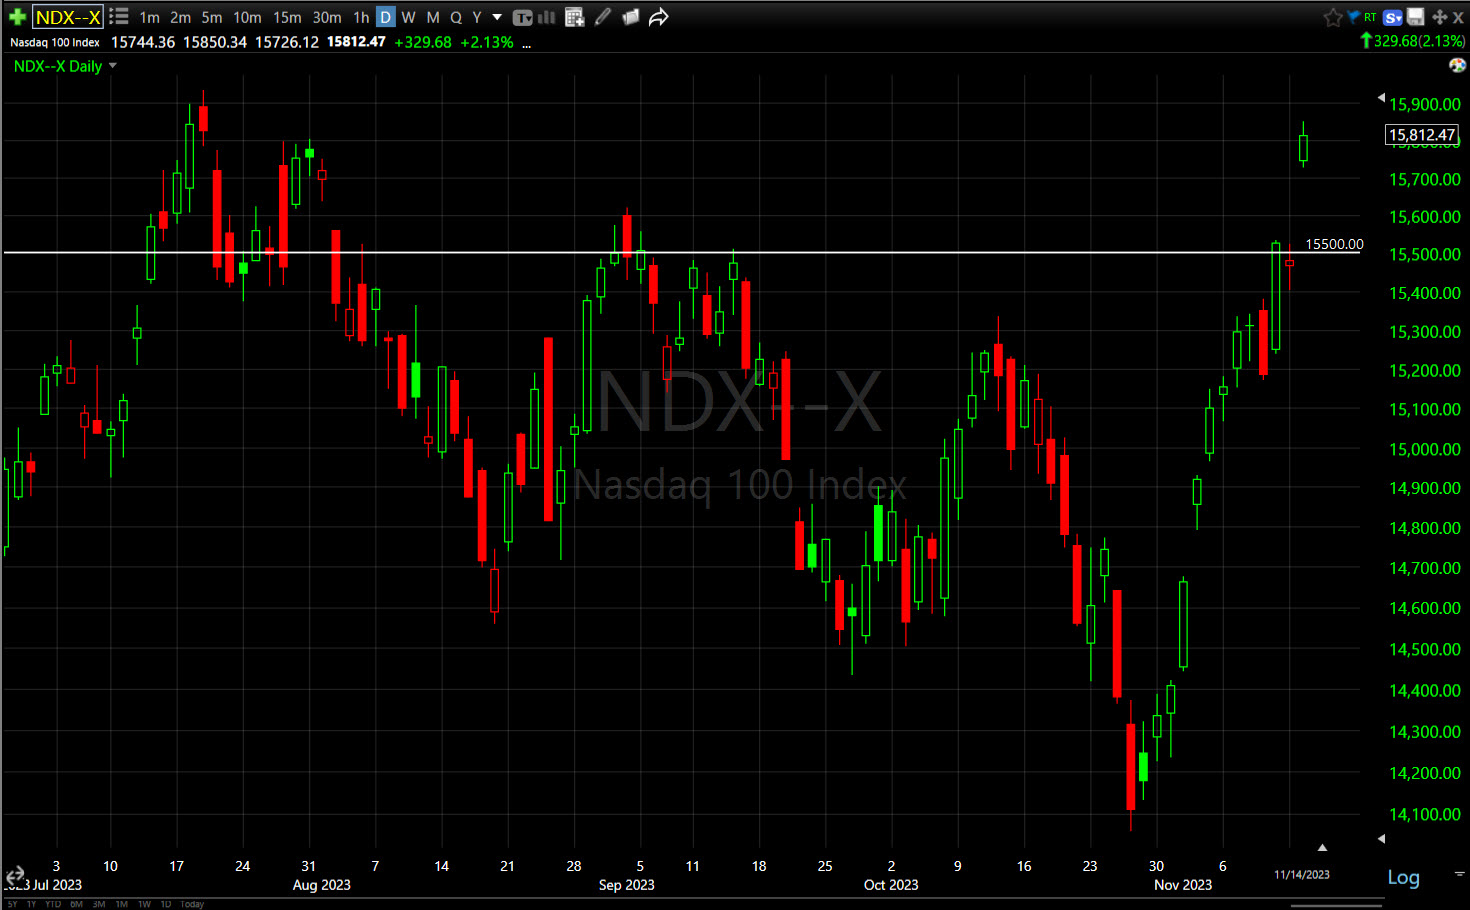 NASDAQ-100 (daily) trading above $15,500.
![]() Dow Transports (30m) with the best formed bullish consolidation, a bull flag, and it still has upside with a measured move target at $15,475.
Dow Transports (30m) with the best formed bullish consolidation, a bull flag, and it still has upside with a measured move target at $15,475.
The Russell 2000 surged 5.4%, which only leaves the index positive for the year by +2.1%.
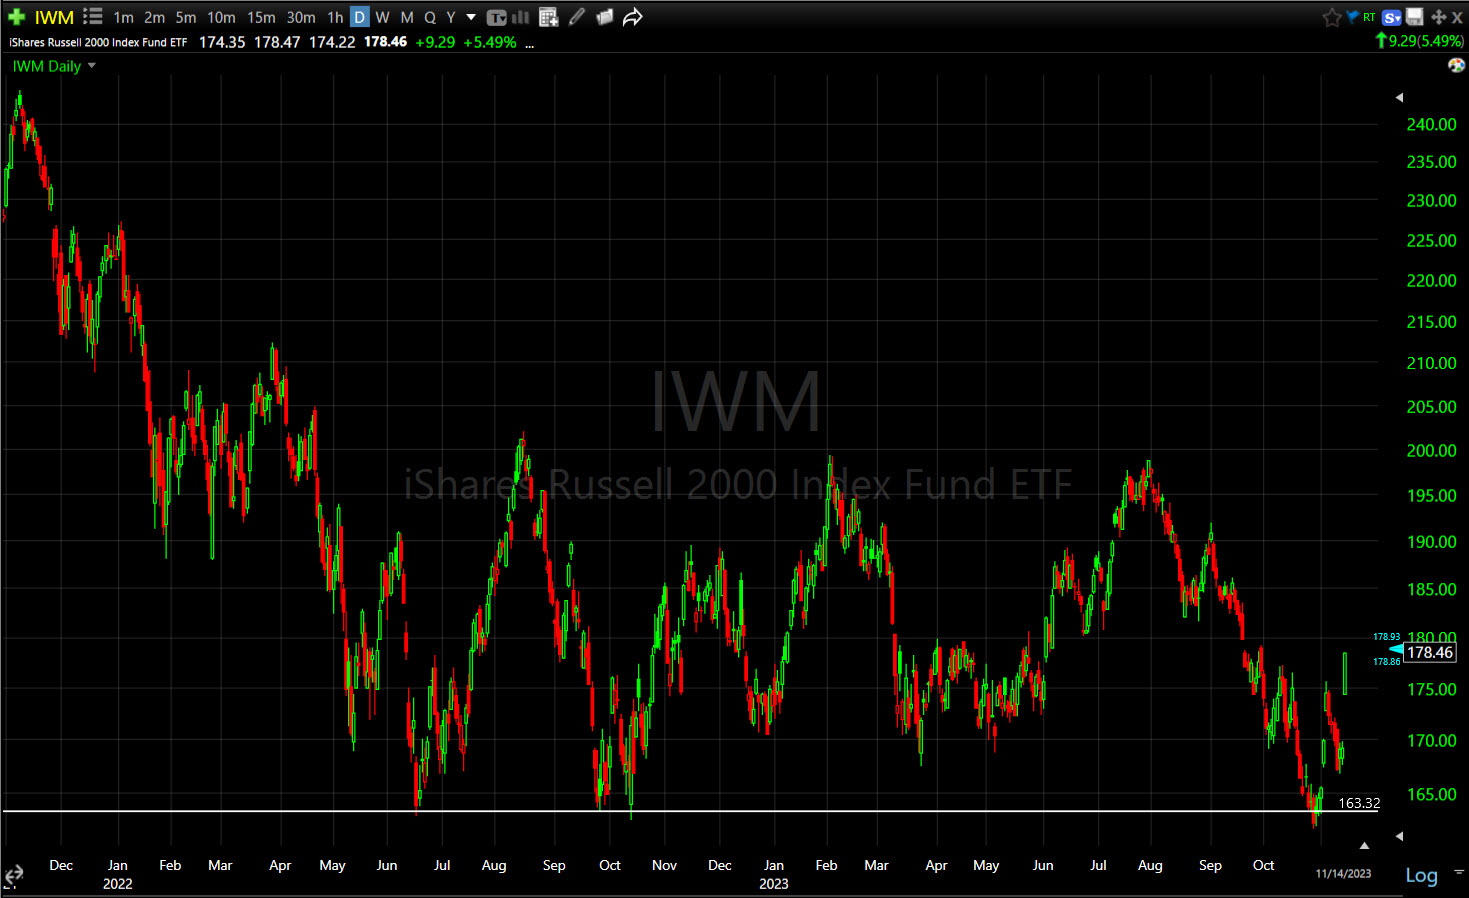 Small Cap IWM (daily) – remember that this entire rally kicked off as Small Caps met their H&S downside measured move and ran into this massive primary lateral trend support level that’s influential back to 2018. Still, with Small Caps benefitting most from November’s rallies, it’s still not even at the half-way mark of the lateral primary trend.
I’ll touch on what the 3C charts are saying below.
Late last week I noted that shorts (via my Most Shorted Index) piled back into short positions, erasing roughly half of the prior week’s massive short squeeze, easily the biggest short squeeze of the year. Here’s an excerpt,
“You can see the spectacular short squeeze from last week- just mind blowing in how strong it was, but look at what’s happening the last day and a half! Shorts are pressing their positions again.
Interestingly, none other than Goldman Sach’s Prime Desk confirms what we’re seeing above on the Most Shorted Index, also posted earlier today (Early Update).:
“US Single Stock short flows has increased for 14 straight weeks, the longest shorting streak ever on our record.”
The question is, “Are the shorts right? Or are they just setting themselves up for another short squeeze?”
We have the answer today, and this is why I’ve urged patience recently with regard to taking market positions any larger than speculative…
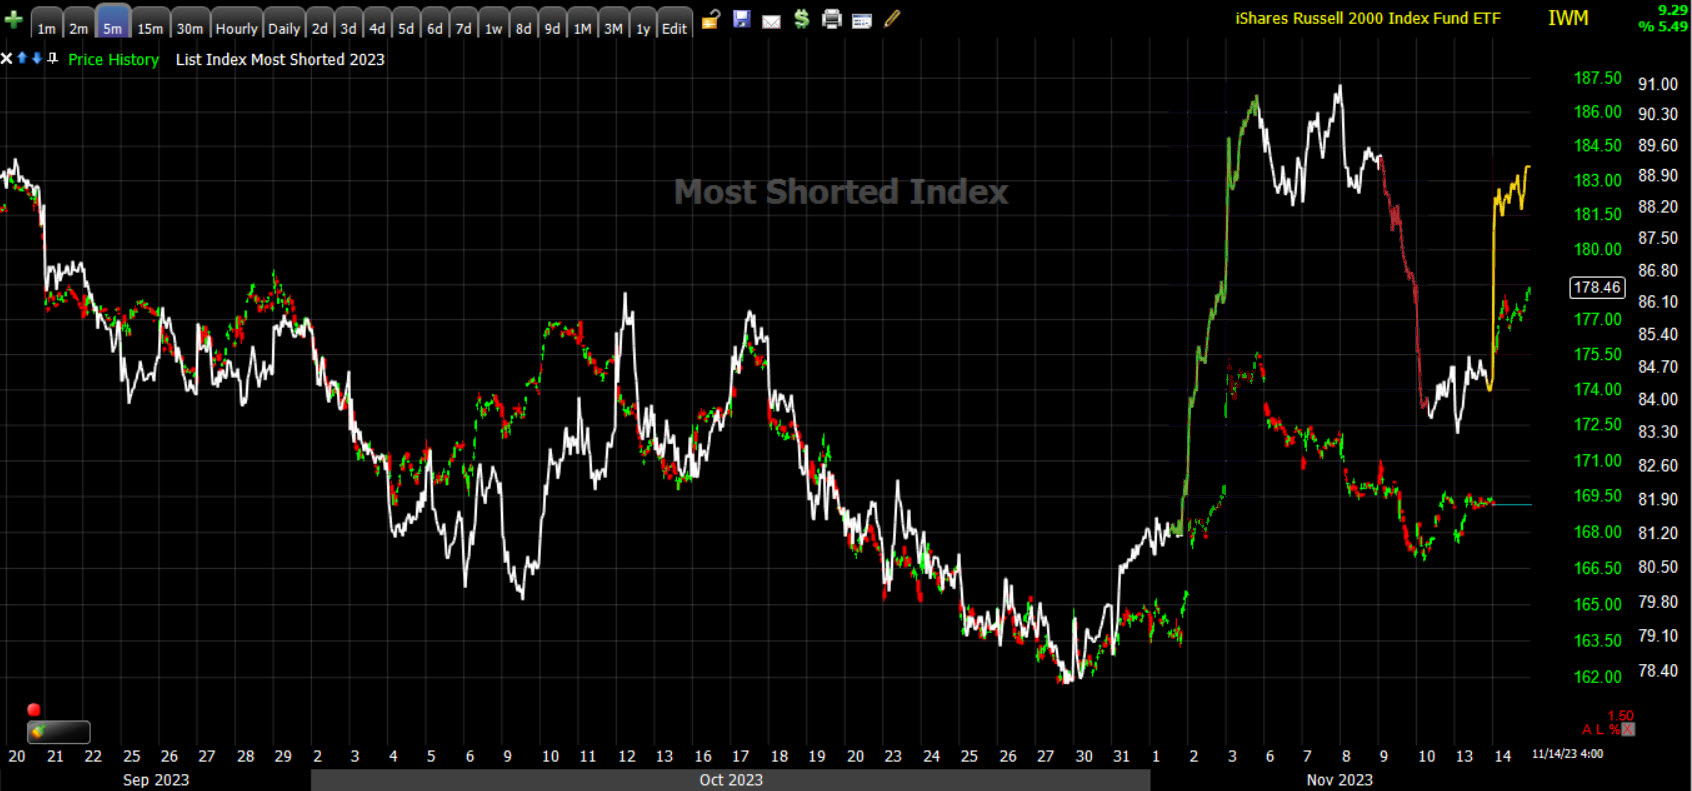 IWM (5m) and my Most Shorted Index – after last week’s short-selling spree toward the end of the week (red), those shorts were squeezed today, giving back all of last week’s short selling as the MSI jumped 6% today.
Moves in the MSI this big, this fast and concentrated wreak of hedge funds, which is exactly what Goldman confirmed last week. Hedge funds got caught on the wrong side of the trade and CPI… almost certainly due to recency bias. The last two CPI reports came in hotter than expected, hedge funds expected this one to do the same, but what of the outright weakness in oil we’ve seen every week that’s sent gasoline prices tumbling? That was one of the major factors behind today’s cooler CPI. They didn’t notice before piling in short days before the CPI?
S&P sectors
Buying activity was broad based with just about everything coming along for the rally. All 11 S&P sectors closed higher with only 2 closing up less than 1%. Three sectors, the bond proxy Real Estate and Utilities, and the mega-cap heavy Consumer Discretionary ended with gains of 3% or more. However, it wasn’t the mega-caps that lifted Consumer Discretionary, it’s the recently beaten up Retail Sector (+5%) that led the advance.
The mega-caps (MGK +1.9%) would normally have been the standout winner on any other day in which yields dropped by double digits in 2023, but just like the rally in early November, they were only along for the ride, not leading it. The mega-caps (MGK +1.9%) underperformed the broad S&P Equal Weight Index (+2.85%) by over 100 basis points! That serves, once again, to confirm my view (which was subsequently confirmed by Goldman Sachs Primer Brokerage) that there are some major CRACKS in the mega-caps leadership role, and that the November theme is best summarized (by me anyway) as the “Dash for Trash” – or the most beaten up, deeply discounted stocks of the year, either being short squeezed, or played as a mean reverting trade.
On a side note, in hyper-speculative markets that are nearing their end (such as the late stages of the Dot.Com bubble), we see the a similar theme – the cheapest, most speculative stocks rally the most at the very end. I’m not saying that this is such an environment, just making note of the long-held observation.
Other recently beaten up areas that oot performed included Home Builders (+5.9%), which broke down from their H&S top and fulfilled the downside measured move and then some. Retail (+5%) as well, as mentioned above, and Regional Banks +7.35%. I could go through a list of a hundred sub-industry groups like Savings and Loans (+7.3%), Home Furnishings and Fixtures (+7.3%), Sporting Goods Stores (+7%), Wholesale Building Materials (+6.85%), Lumber and Wood Products (+6.4%), Water Utilities (+6.2%), Recreational Vehicles (+6%), Home Improvement Stores (+55%) and on and on, but the theme is the same – either they belong to sectors that did well like Utilities, or are related to Real Estate, Home Building, Banks or Retail Sales... The Dash for what has recently been, Trash. It’s not the mega-caps that are leading these recent rallies in November.
Semiconductors (SOX +3.6%) well outperformed the Technology sector (+2%).
The laggards sectors with gains of around 1% or less include Health Care, Energy (Crude’s recent weak performance) and Consumer Staples.
Materials ⇧ 2.95 %
Energy ⇧ 0.89 %
Financials ⇧ 1.89 %
Industrial ⇧ 2.01 %
Technology ⇧ 2.00 %
Consumer Staples ⇧ 1.03 %
Utilities ⇧ 3.99 %
Health Care ⇧ 0.68 %
Consumer Discretionary ⇧ 3.37 %
Real Estate ⇧ 5.40 %
Communications ⇧ 1.62 %
The Communications sector (a mega-cap heavy sector) presents a mixed view. On one hand the sector closed at a new high for 2023…
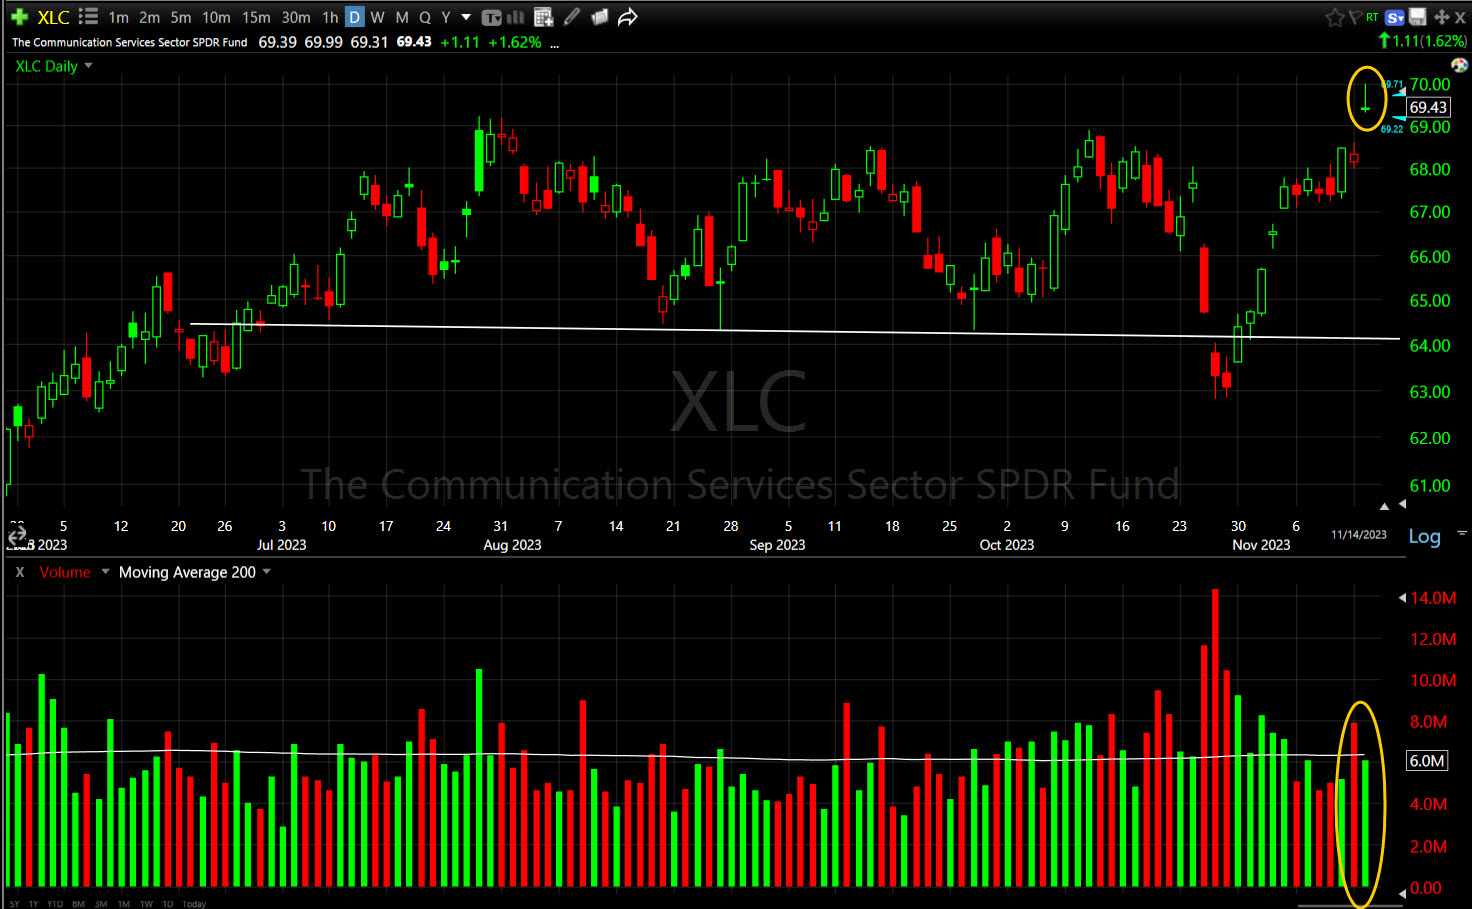 Communications sector (daily) -However, on the other side it posted a bearish Shooting Star (bearish reversal candle) and the advance was on lighter volume, however it’s recent break of the neckline was on heavy volume and it came within 1% of meeting the downside measured move before November’s rally.
In a somewhat similar manner, mega-caps (MGK) posted a new closing high for 2023…
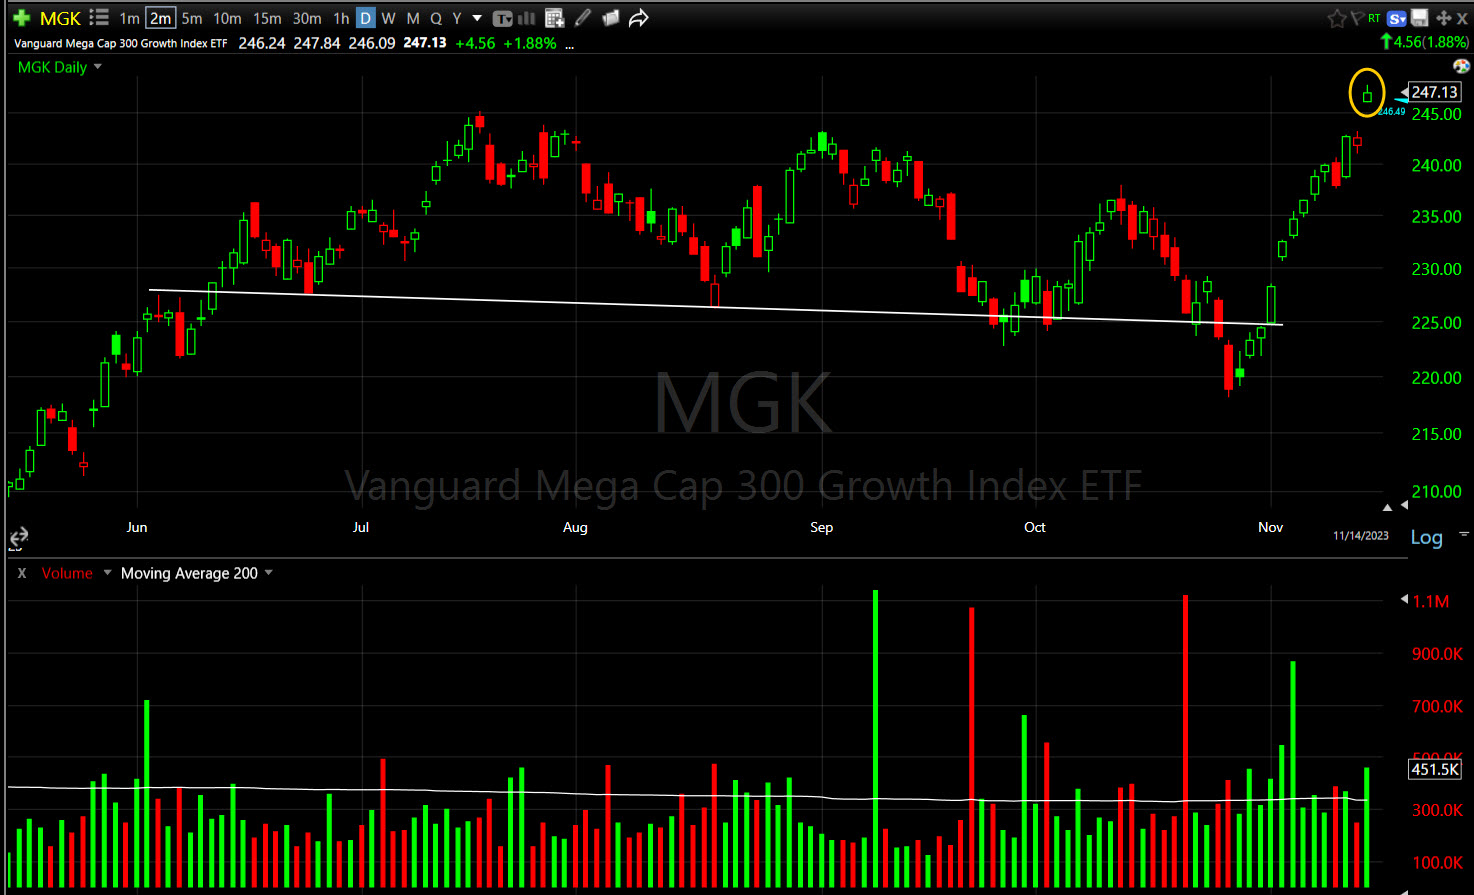 MGK (daily) but also posted a Shooting Star, albeit not as strong of an example as Communications, and while on heavier volume than yesterday’s low conviction, low volume day, it was rather light volume all things considered.
My take overall on the mega-caps is that October was another negative change in character and we’ve since seen a rotation to the “Dash for trash” stocks. Mega-caps are rallying on the drop in rates and broad bullish market risk sentiment in November, but they certainly are not dominating like we saw all of 2023. I think the long term 3C charts reflect this view as well.
Take the Communications sector above as an example. The long term 3 trend is VERY clear.
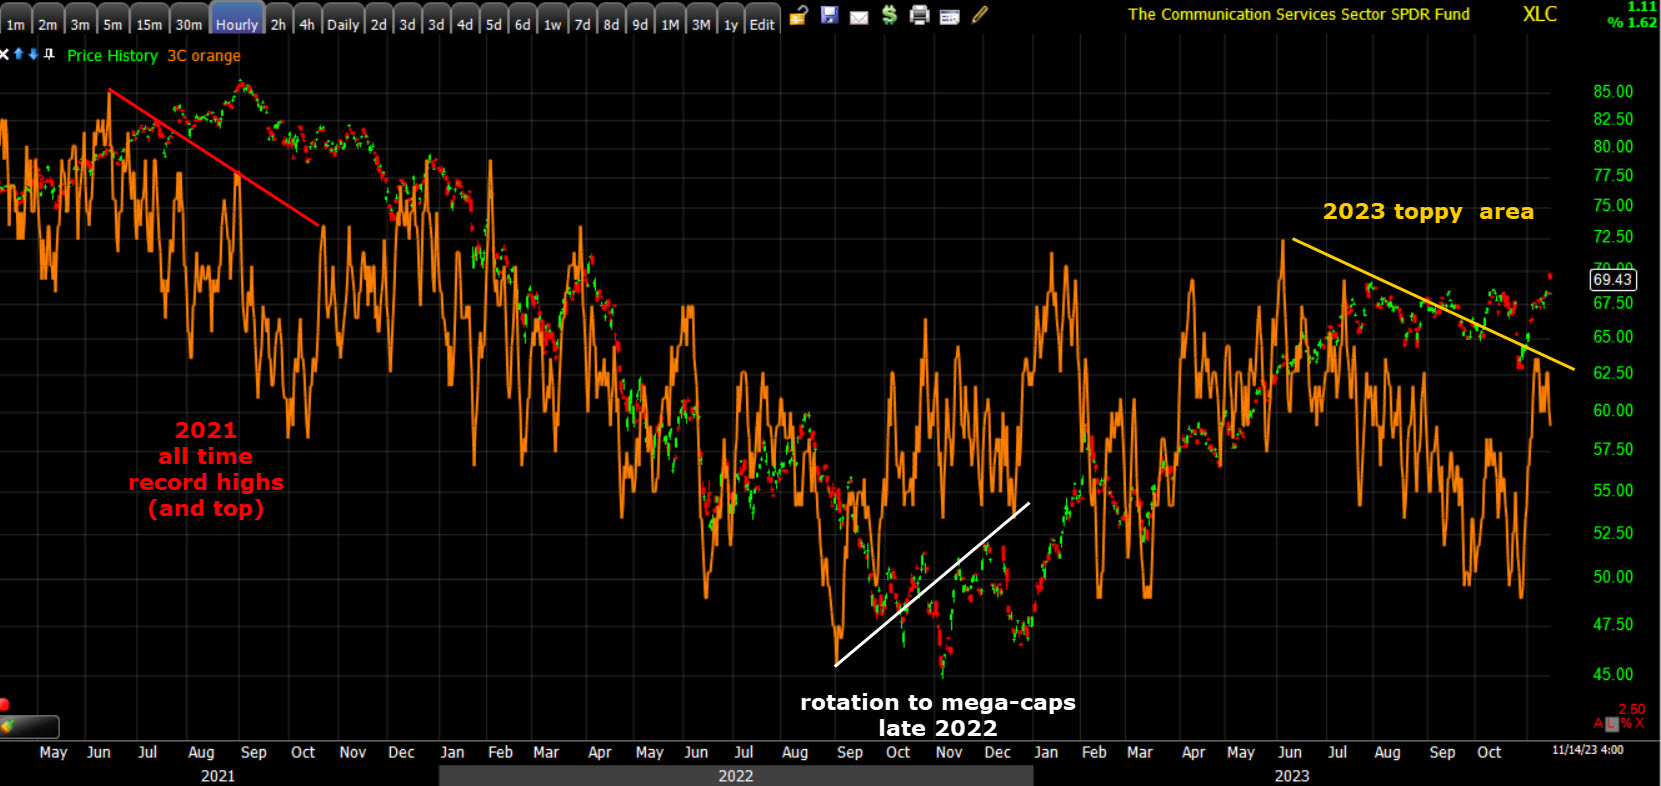 Communications sector (60m) shows the 2021 all time high/top that led to 2022’s bear market with 3C massively negatively divergent, then a big positive 3C divergence at the the rotation at the end of 2022 when mega-caps were the worst performing and most hated stocks of the year before rotating in to best performing of 2023, and now another negative divgernece in this toppy area from the summer.
Internals
Internals depict a very broad-based advance and great participation with NYSE Advancers (2559) outpacing Decliners (250) by a 10-to-1 margin and on heavy Volume of 1 bln. shares, reflecting short covering and FOMO.
The Dominant price/volume relationship was Close Up/Volume Up, the most bullish of the 4 possibilities.
Sector performance, internals and the dominant price/volume relationship depict a flawless, picture-perfect bullish day for the equity market and all it took was a marginal miss in CPI, which further confirmed what we’ve known for months… that the Fed is done hiking rates.
Treasuries
The 2-yr yield, at 5.02% just before 8:30 a.m. ET, settled 22 basis points lower than yesterday at 4.82%. The 10-yr yield, at 4.62% just before the data, declined 19 basis points from yesterday to 4.44%.
Two-year treasury yields recorded the largest one-day drop since the regional banking crisis in March as the market is now pricing in a much sooner Fed pivot to rate cuts. The Fed was just praising the market for tightening financial conditions just shy of 2 weeks ago. They can’t like how the market has turned that on them literally the day after Powell!
The market no longer is pricing in any more rate hikes, and instead, it is now giving roughly 32% odds to a rate cut in March (from 10.5% yesterday) and has fully priced in two rate cuts by July.
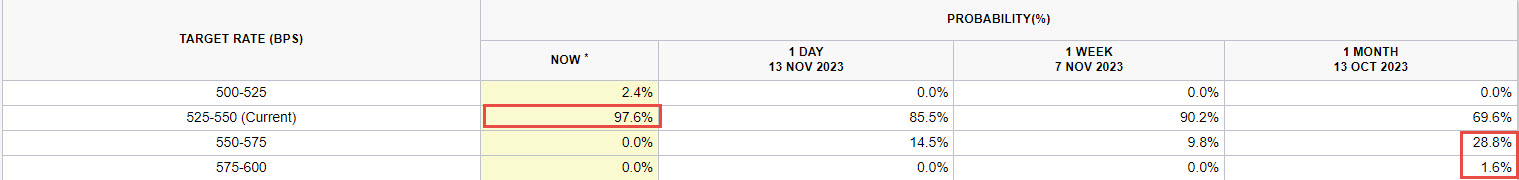
Just a month ago the Fed Funds Futures were pricing in a 30.4% chance at least a 25 basis point rate hike for December and just yesterday a 14.5% chance. Today it’s pricing in just a 2.4% chance.
HY Credit (HYG +1%) did alright on the face of things, but considering the extreme bullish risk sentiment and a 20 bp drop in yields, HYG wasn’t so impressive in context.
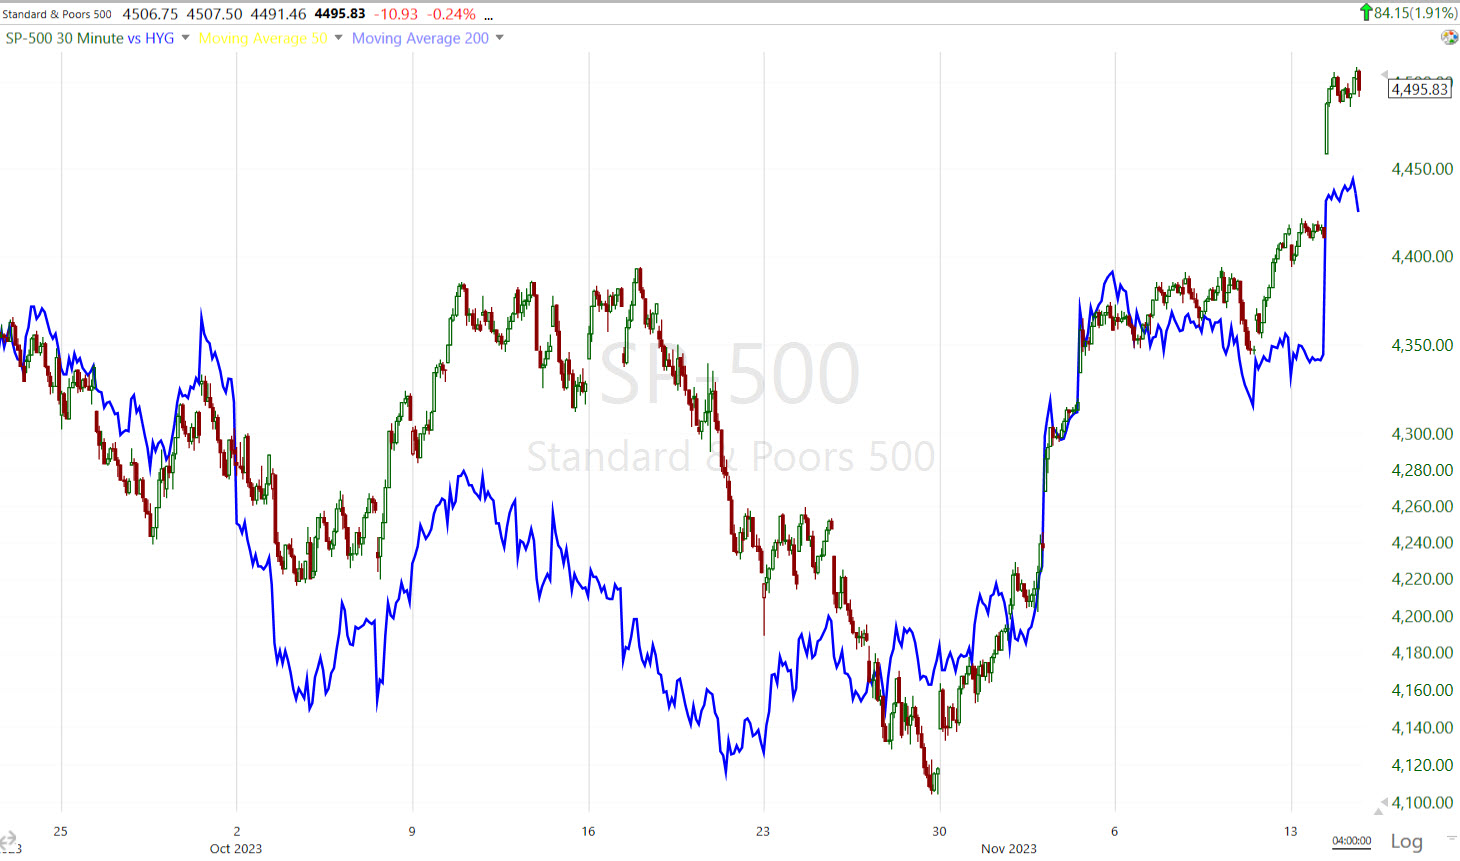 This chart is a little more art than science, but I’d estimate that HYG (which was modestly negatively diverging with the S&P as of yesterday), is confirming about where the S&P closed yesterday. It’s certainly not leading higher like we saw coming into November, but it’s also not giving a strong leading negative signal either. My interpretation is that institutional money is not as strongly behind the November gains as you might expect. I think that view is supported by 3C charts of the averages and HYG.
Currencies and Commodities
The U.S. Dollar Index sank after the CPI data, down -1.5% to 104.05 – the biggest daily drop since Nov. 11, 2022. From a shorter term view (tactical view, as in from October), the Dollar has been and is supportive of the gains in stocks.
 S&P futures (60m) and Dollar Index (inverted). The Dollar’s weakness (green) was one of the leading positive signals coming into November.
However, from a longer term strategic view (from the July H&S top formations and S&P key reversal day)…
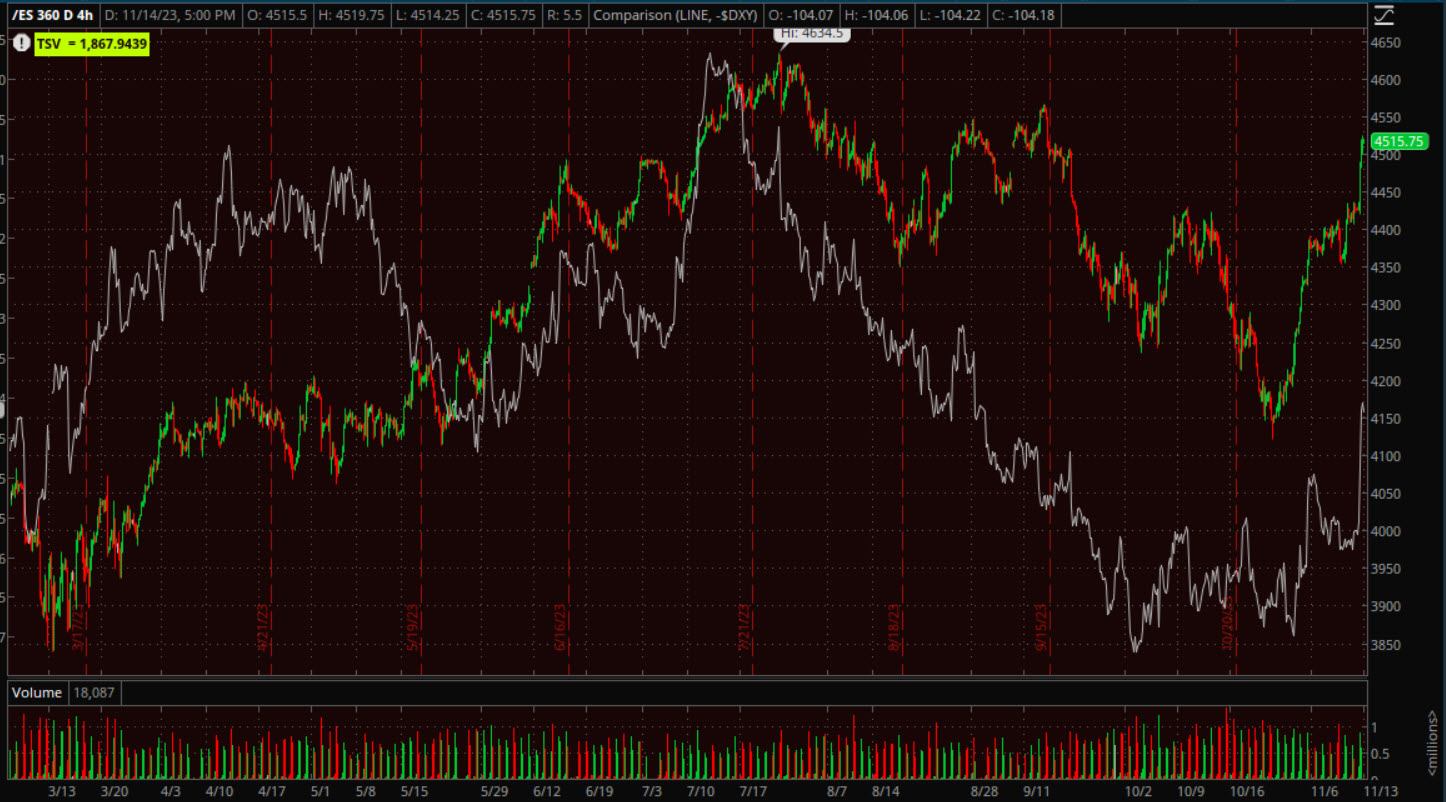
S&P futures (4H) and Dollar Index (inverted) – Not so supportive. The message is, short term tactical – the equity market gets the bullish nod, but longer term strategic, the course of action is to look for the sell signal to sell/short into higher prices.
WTI crude oil futures fell -0.2% to $78.15/bbl today and natural gas futures fell -2.8% to $3.31/mmbtu. Since oil’s move was so small I don’t see the need to update the price chart as it continues to trade in a week-long bear flag with an approximate -8% next leg down measured move as the flag’s lower trend line breaks (currently around $77).
UNG (-3.85%) came down with Nat Gas futures after a nice day up yesterday. Today’s decline was on slightly lower volume, but not low enough to make it a high probability consolidation of yesterday’s gains. UNG’s 3C charts still look very good since a sudden positive divergent transition early last week so we’ll have to give this some time, but 3C looks like things are turning for the better.
URA gained another +1.5%, but still seems like it’s trying to work through supply in the $27-$28 area. If URA can break above $28.50 we should see a nice run higher. I suspect though, that it may be forming a larger consolidation in the area to prepare for that eventual breakout. We’ll see. I don’t have strong objective evidence for that view yet.
Gold futures followed through and nearly perfectly hit yesterday’s expected measured move – settling higher by +0.8% to $1,966.50/oz. I got to say, I’m not impressed with gold’s performance today.
“Gold futures gained +0.6% to $1,950.10/oz. Price today has a bullish feel to it… my guess is we’ll see another +0.75% leg higher.”
Still, with yields down double digits and a huge -1.5% loss in the Dollar, this was not impressive price action from gold futures. If I take the safe-haven bid in gold out of the equation, this chart shows you just how much gold has underperformed as stocks have rallied as yields and the Dollar sank…
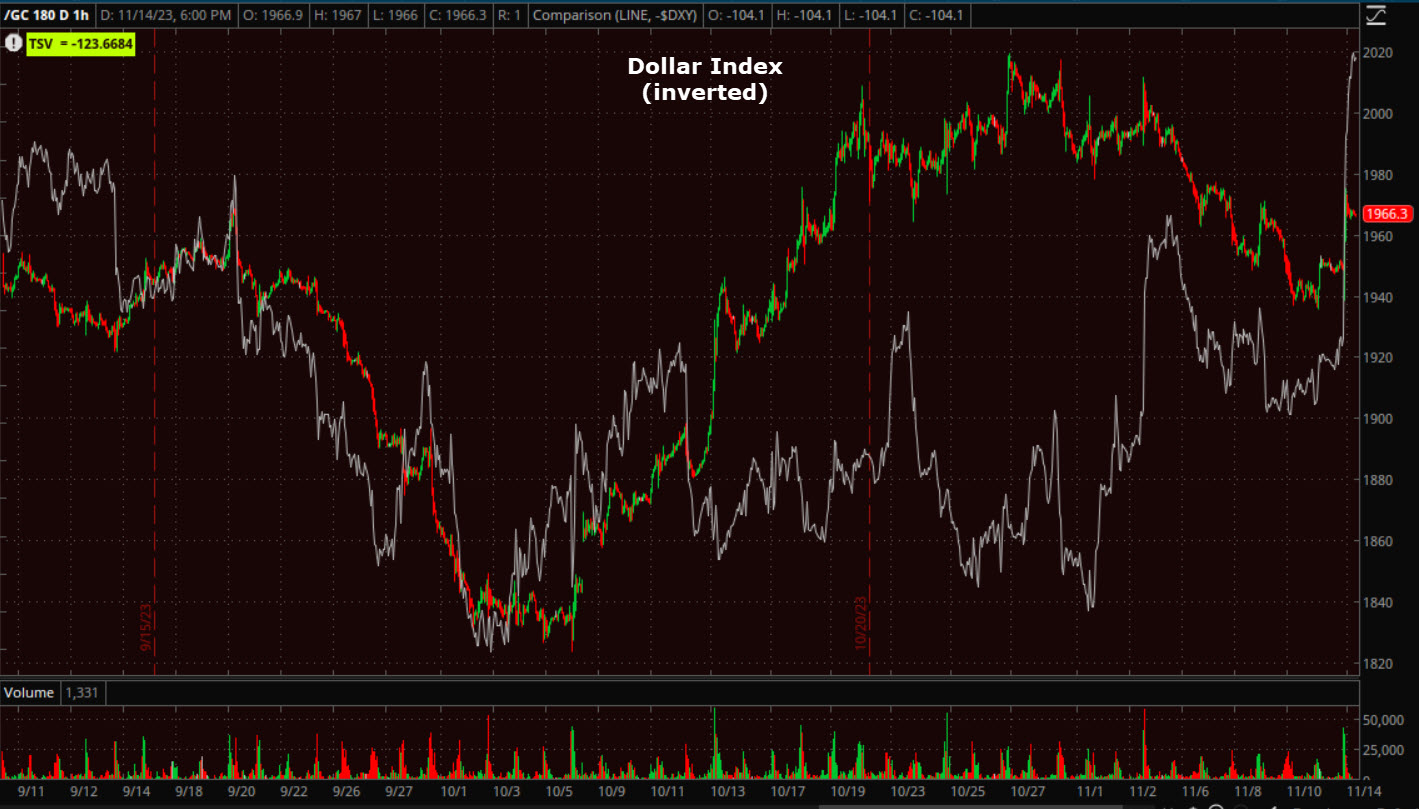 Gold futures (60m) – Taking the flight to safety trade and the weight of the longer term dollar/yield’s relative position out of the equation, the last few weeks of action should have propelled gold above $2,000. but we can’t take the downside pressure of longer term dollar and yields out of the equation as they’ve been weighing on gold’s price despite the flight to safety bid.
Speaking of not impressed, from last night’s Daily Wrap,
“Bitcoin has been mirroring gold in some ways, although it’s acted far better at $35k than gold did at $2,000. Both benefitted from a flight to safety bid. Bitcoin has even recently shown some correlation with fixed income. Today price slipped below $37k, and while it’s been acting better than gold, I don’t have high confidence in its breakout above $35k.
…the breakout [above $35,000] has not been all that impressive and it’s pulling back now. Look for support at former resistance ($35k), I wouldn’t be surprised to see the level tested. If support fails there, it’s going to be trouble.”
Bitcoin slid all the way down to test $35,00 today ($35,002)!
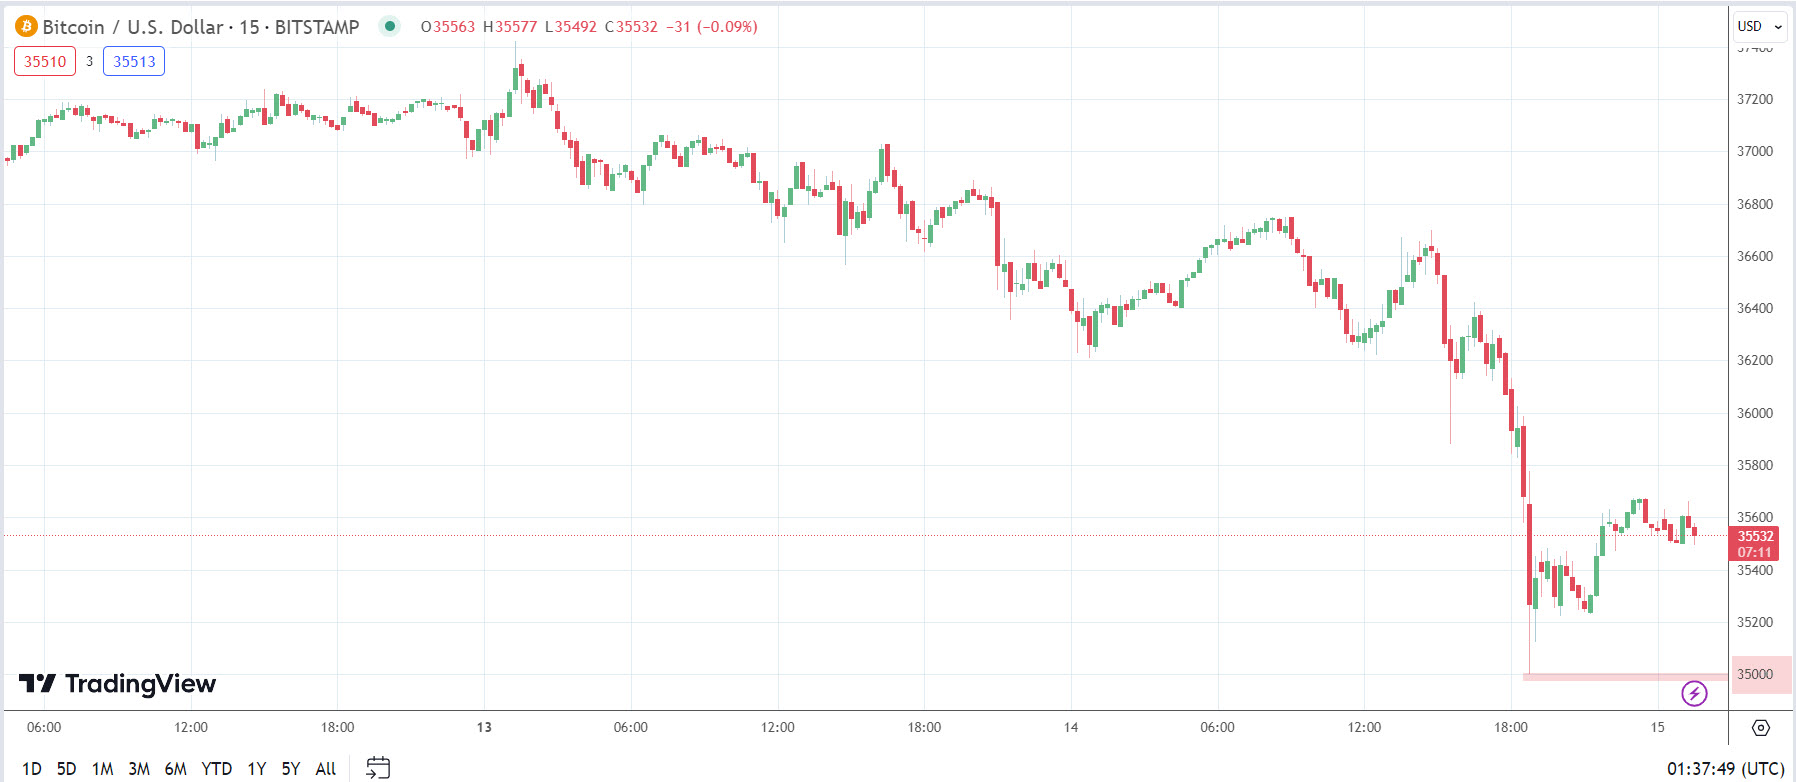 BTC/USD (15m) right down to $35k like a magnet!
Summary
Today was a textbook bullish day with great participation and heavy volume. All it took was a marginally weaker than expected CPI report, but that CPI report was in the market’s view, more confirmation that the Fed is done hiking rates. We knew this was a high probability months ago.
The 2-year yield crossing below the Fed Funds Rate during a rate hike cycle is an extremely high probability signal that the Fed will pause, and then next, cut rates. Notice that each time on the chart below, when the 2-year yield (red) crosses below the Fed Funds Rate (blue) in a Rate Hike cycle, the next thing that happens is the Fed pauses rate hikes and then cuts into a recession (gray shading). As you can see, it’s a high probability – The Dot.Com bubble, Great Financial Crisis, COVID Crash and the now the Everything Bubble.
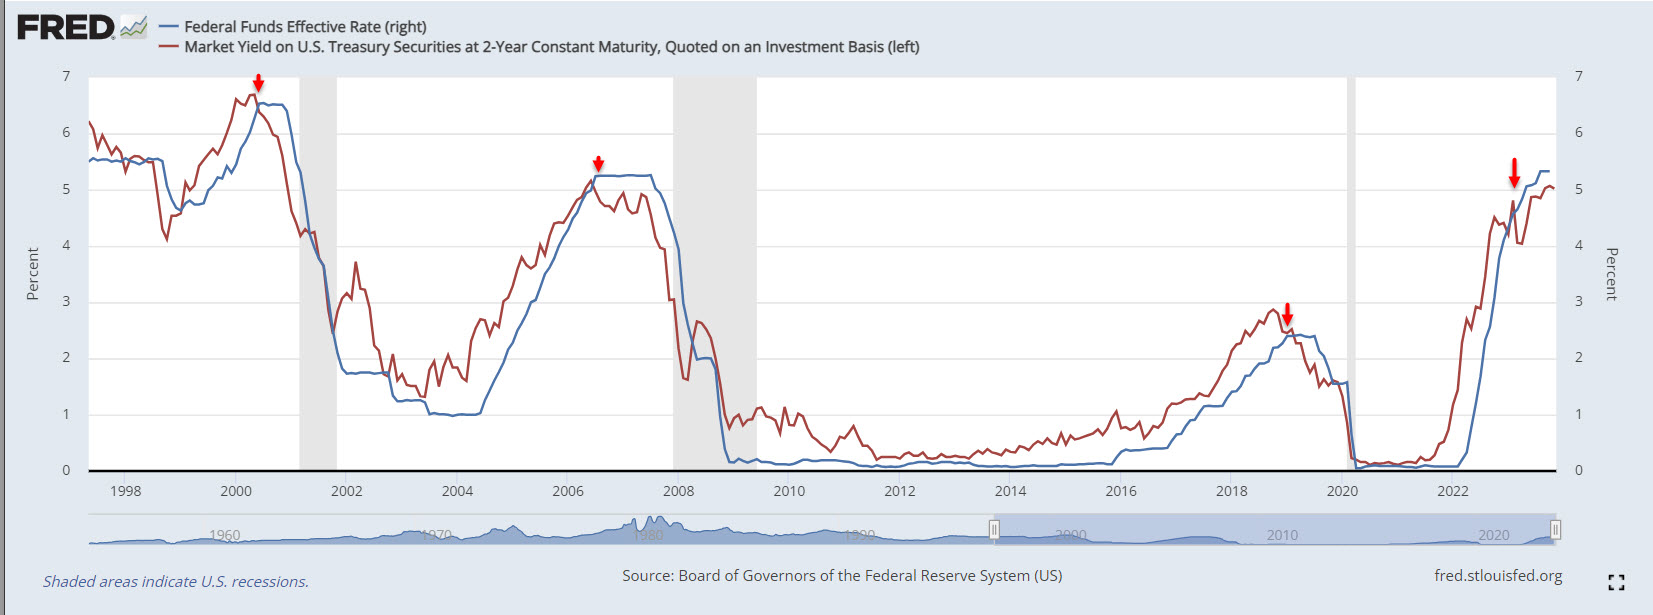 Source: St. Louis Federal Reserve Bank
The 2-year crossed definitively below the FFR April. The Fed hiked another 50 bp. We’ll see if they went too far when we get to the recession. The average time from the last Fed rate hike to the first rate cut is 8 months, so that puts us on track for roughly March, which the market is just now pricing in as the first rate cut. Soon after that (historically) the economy is in recession which fits with my Q4 2023 to H1 2024 call.
I’m not convinced that the Fed won’t push back and push back hard on the financial conditions easing that’s taken place since the FOMC meeting, and specifically Powell’s presser. Powell was saying (and in hindsight he must think it was a mistake) that the market is tightening financial conditions for the Fed (higher rates and lower stock prices) for the Fed, ergo – the Fed doesn’t need to do anything else. But, it’s estimated the market tightened financial conditions by the equivalent of (4) 25 basis point rate hikes, or 100 basis points. It’s estimated that the stock /bond rally in the wake of Powell, eased by 50 basis points, and today must have eased by at least another 25 bp – maybe more cumulatively. Everything the market did to tighten financial conditions for the Fed, it just undid in 2 weeks!
Powell’s nightmare scenario is having the legacy of, “Paul Volcker 2.0”. Volcker hiked the Fed Funds rate to near 20% by 1980 to defeat inflation. That, of course, caused a recession. Volcker came under political pressure to cut rates “before the job was done” – a common refrain we hear from the current Fed now. Inflation became resurgent because of the rate cuts to deal with the recession, and Volcker and the Fed had to hike again to 20% by June 1981, which of course, cause another recession, or “Double dip recession”.
Powell does NOT want to be Volcker. I’ve heard him allude to it numerous times. So… how and when does the Fed push back? I don’t know, but I think it’s coming. I doubt it’s another rate hike, but they’ll figure out something to push back – maybe more aggressive hawkish jawboning, maybe something else. They can get creative.
In the meantime, the stocks that are running now aren’t exactly “quality”. One of the more interesting things I clocked today was the 3C charts not confirming S&P above $4400, NASDAQ-100 above $15,500, and Dow above $34,000. The charts are here in this afternoon’s 3C Update. None of them say that we should be shorting the market into today’s price strength (especially without leading market signals), but the one that’s most suspicious is the NASDAQ-100 and this rings bells for me due to the things noticed at the end of October covered in the Oct. 29th video, “Cracks”. Here’s an excerpt from the video description:
“we saw this important change in character forecasting the tops and the turn lower, in mid-June with institutional distribution in mega-caps. This past week’s earnings have just helped seal the deal as the mega-caps have really been the only stocks in 2023 lifting and supporting the market.”
After I posted that video, Goldman Sachs Prime Brokerage confirmed the exact same about the mega-caps. From GS-
“Amid mixed Q3 results and price performance post print, mega cap tech stocks (“Mag 7”) collectively saw the largest notional net selling since early September, driven by short sales and to a lesser extent long sales (2.5 to 1).while SPX constituents excl. the Mag 7 collectively were net bought on the week – a notable reversal versus the trends seen in recent months.”
This describes perfectly, “The Dash For Trash” theme.
As for the “Short Covering Rally of November”, we’ve seen it on my MSI with non-stop shorting since the market’s July highs. Shorts were way too aggressive and way too exposed to a massive short squeeze. Goldman’s hedge fund flows confirmed the same.
From GS Prime:
“US Single Stock short flow increased for a 12th straight week, the longest shorting streak on our record.”
Adding,
“We’re seeing spec investors increasingly press short positions in UST futures, which hit and still remains near a record net short DV01 position.”
In short, they are describing exactly what I’ve been seeing. A breakdown in the support of mega-caps; speculative investors/hedge funds pressing short positions to the longest streak on record, and it seems that they are describing many of the “trash stocks, or Most Shorted” in “Single stock short flow” remarks.
Combined with a timely and huge drop in rates, the short squeeze has been spectacular. But even amid the spectacular gains, mega-caps aren’t performing half as well as they would have at any other time this year. When that short covering runs out, and it will, especially after shorts tried to press new positions again late last week and got their faces smashed, this market is going to have trouble without those mega-caps.
In the near term I’d still advise viewing the market as bullish until proven otherwise and keeping any short sale trades small or speculative. When we get leading 3C signals (and QQQ/NASDAQ may be the first), and we get leading market signals (bounce in rates, dollar, and weakness in HY credit) then is the time to move on shorts and back up the truck. Until then, I’d keep your powder dry and be patient – wait for the “fat pitch”.
Overnight
S&P futures are up +0.15% and trading like they are bulletproof tonight with bullish price tone. Watch out for tomorrow morning’s Retail Sales. It’s the second most important data point of the week, and then PPI.
The U.S. Dollar Index is up +0.1%, which is nothing vs. a -1.5% drop.
WTI Crude futures are up +0.25%, remaining well within the bearish flag of the last week – there’s -8% downside on a break of that flag.
Gold futures are unchanged and have a bullish tone like yesterday, so maybe one more leg of +0.75% to +0.9% and then we’ll take another look at the bigger picture related to $2,000.
Bitcoin futures are up +0.6%. Watch that $35k level. If that breaks, we’ll have a HUGE failed breakout/fast reversal scenario.
The 2-year yield is up +3 bp and 10-yr is unchanged.
Wednesday’s economic calendar features:
- 07:00 ET: MBA Mortgage Applications Index (Prior 2.5%)
- 08:30 ET: October Retail Sales (consensus -0.3%; Prior 0.7%) and Retail Sales, Ex-Auto (consensus -0.2%; Prior 0.6%)
- 08:30 ET: October PPI (consensus 0.1%; Prior 0.5%) and core PPI (consensus 0.3%; Prior 0.3%)
- 08:30 ET: November Empire State Manufacturing (consensus -5.0; Prior -4.6)
- 10:00 ET: September Business Inventories (consensus 0.4%; Prior 0.4%)
JD.com (JD), Target (TGT), and Advance Auto (AAP) headline the earnings news ahead of Wednesday’s open.