I’m feeling a little more casual than usual today, so I’m going to run with that.
The most important economic data of the week, the Consumer Price Index (CPI) came in at a massive miss, but not necessarily a surprise given some of the things we’ve been seeing recently on 3C charts.
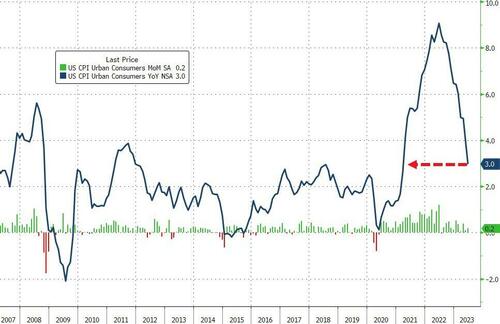
The Consumer Price Index came in much cooler than expected. Headline CPI rose just 0.2% MoM (below the 0.3% MoM expected) which dragged the headline down to +3.0% YoY (cooler than expected) which is the lowest since March 2021 and the 12th straight month of YoY declines in headline CPI – equaling the longest streak of declines in history (since 1921).
Source: Bloomberg
Core-CPI, which excludes food and energy, rose 0.2% month-over-month in June. Core CPI fell to 4.8% YoY , the lowest since Oct 2021. I’m not a fundamental guru by any stretch of the imagination, but what I do know is that the absolute level is much less informative than the YoY change. 3C has a similar dynamic, or if you prefer, it’s the same concept as “Changes in character precede changes in trends”.
Treasury yields and the U.S. Dollar Index took a sharp turn lower in response to the data, acting as major support factor for the stock market. The stock market acted fine if you are looking a it inside of a vacuum, but with some perspective, if inflation wasn’t already yesterday’s news, today would have been far, far stronger. The S&P was up +0.74% today on this hugely important CPI, vs. +0.67% yesterday on pretty much nothing but short covering.
Averages
The S&P 500 and NASDAQ hit new 52-week highs at their best levels of the day. Ultimately, the major indices pulled back from their intraday highs, but still closed with decent gains. Small Caps and the NASDAQ-100 were the best performers today, while the Dow noticeably lagged, as did recently outperforming Dow Transports (-0.15%).
S&P-500 ⇧ 0.74 %
NASDAQ ⇧ 1.24 %
DOW JONES ⇧ 0.25 %
RUSSELL 2000 ⇧ 1.05 %
The Most Shorted Index is up +15% over the last 11 days, which includes a big short squeeze into the end of Q2 in late June, and a more recent and more intense short squeeze from July 7th that has largely been responsible for Small Caps’ recent outperformance and the cyclical/value bias we have seen recently- especially this week.
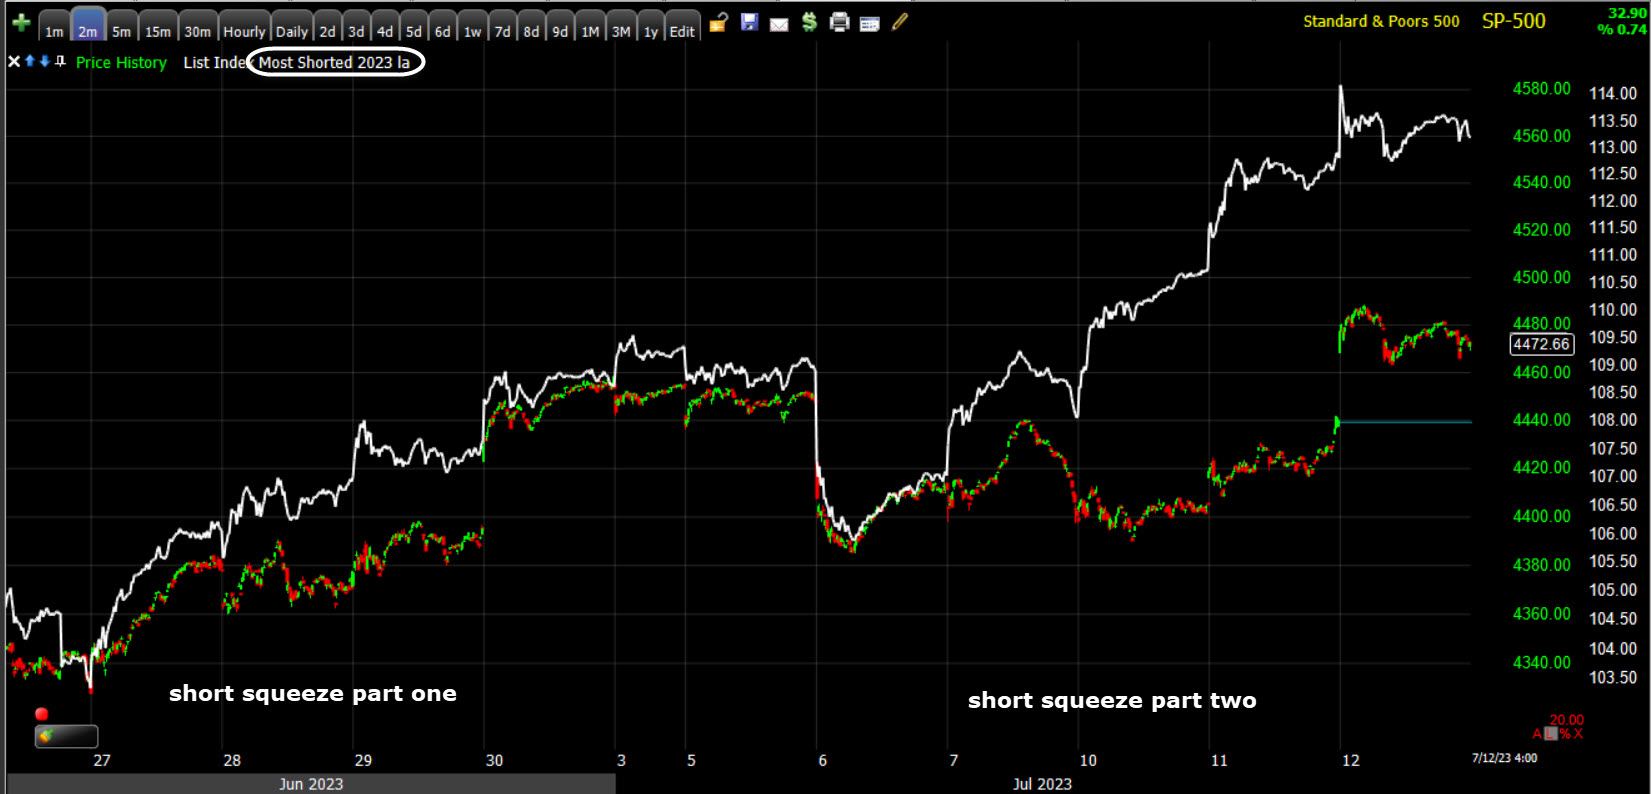 SP-500 (2m) and the MSI shows the intense short covering since the ADP Payrolls report (Thursday) was massively contradicted by the BLS’s Non-Farm Payrolls (Friday).
However, as noted in last night’s Daily Wrap,
” Small Caps are being lifted by short covering so I don’t see that as anything sustainable, and certainly not leading for the 3rd quarter.”
The short squeeze momentum in my MSI started giving out today.
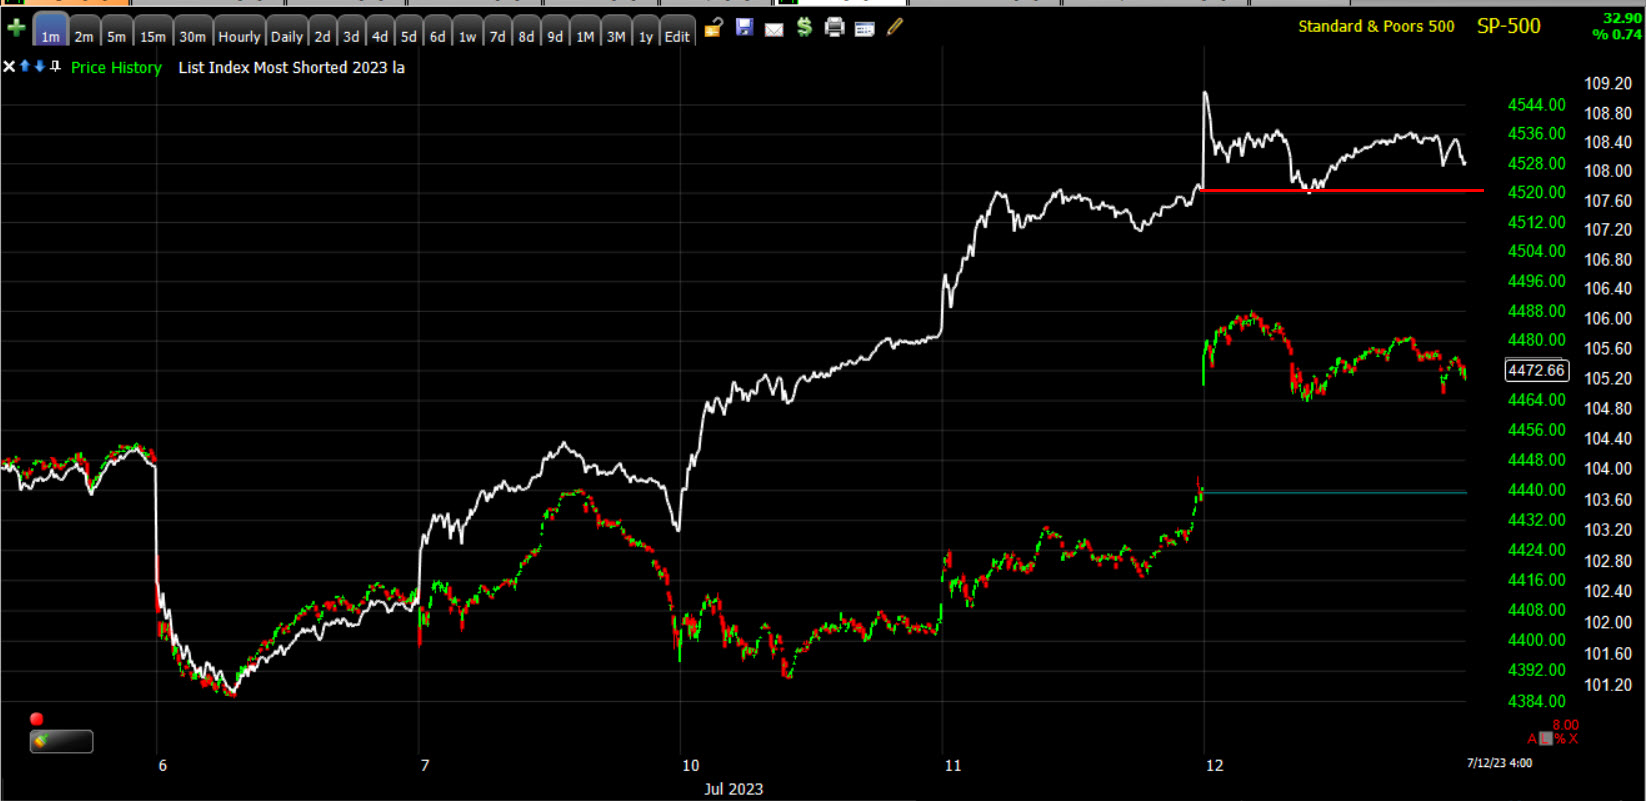 SP-500 (1m) and the MSI with yesterday’s close in red.
As an aside, because I’m not sure that I posted this since the data was updated Friday…
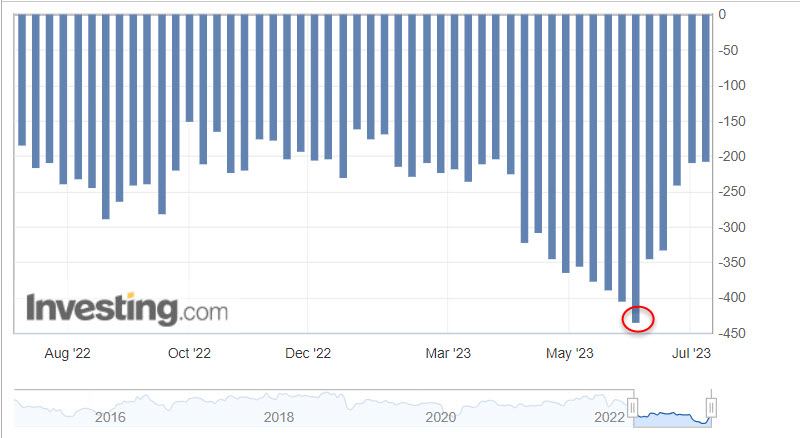 Recall that record net-spec short in S&P futures (red)? Shorts were burned and covered for for weeks straight. Last week saw a very small shift in short covering of S&P futures as we’re now back to more normal levels, from what was an all time record short position. That S&P-500 close above $4200 and subsequent gains sparked the entire episode of massive short covering in S&P futures.
Even with VIX’s -8,75% decline today (holding just above $13.50 support at $13.58), VIX’s relative strength trend remains intact, as does its positive correlation trend with the SPX that moved to 26 days today. Interestingly, because VVIX tends to lead VIX’s relative performance, it closed higher by +0.7%.
Volatility’s term structure is off the most extreme complacent levels of late June, but it’s still exceptionally complacent.
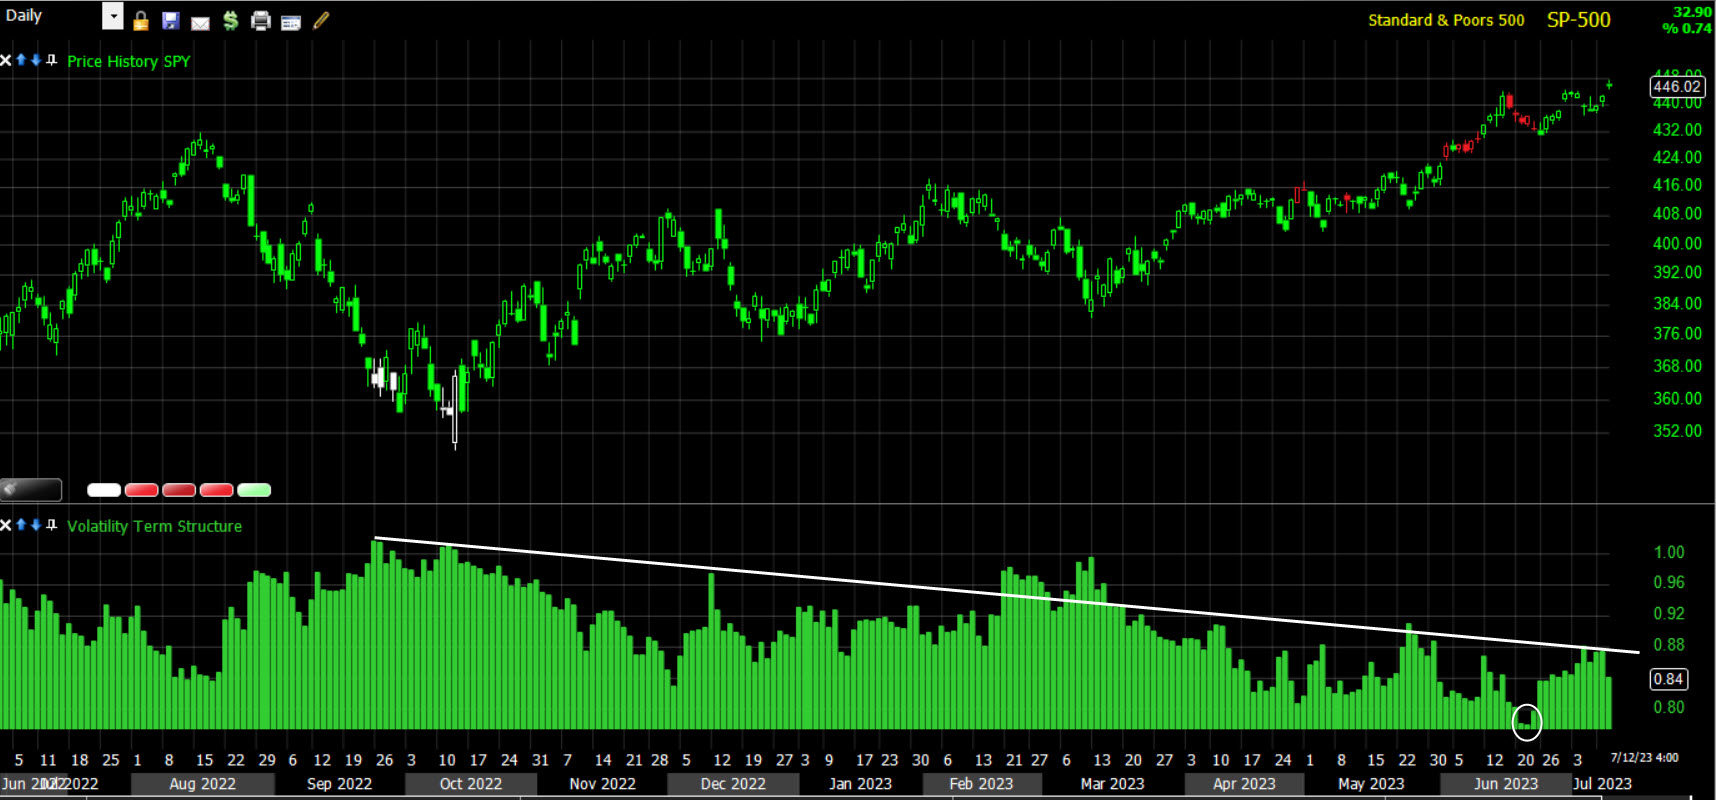 SP-500 (daily) and Vol’s term structure (bottom window) with extreme complacency in late June (white circle) and a trend of increasing complacency over the last 8.5 months.
I can’t say I’m surprised when I look at investor sentiment indicators like the Fear and Greed Index…
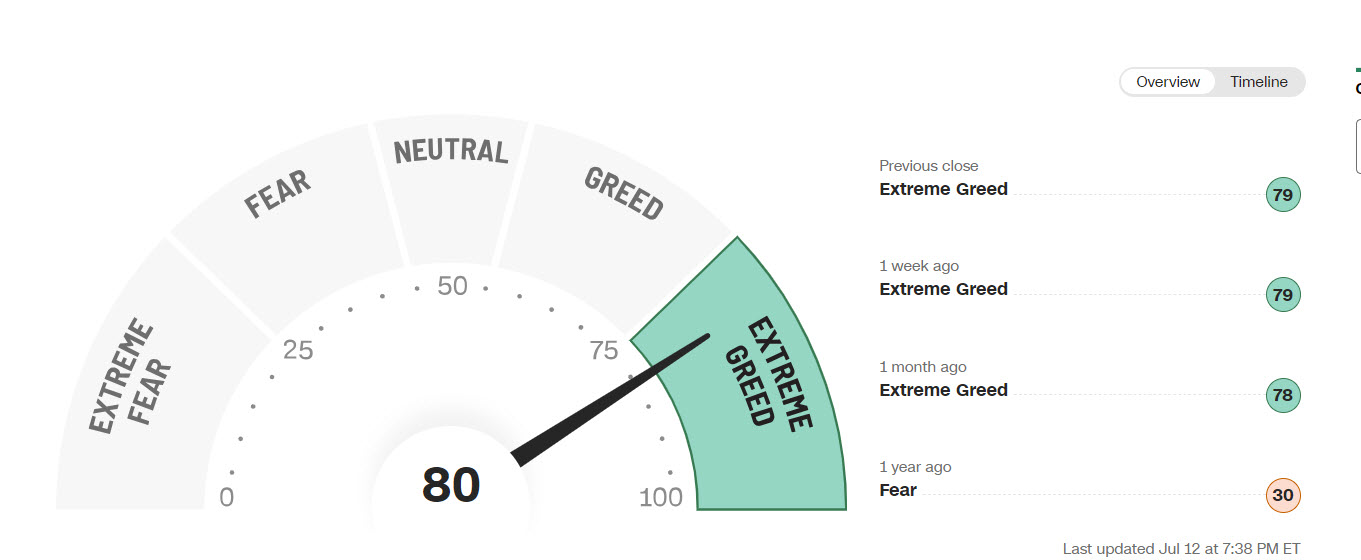 Extreme Greed! There are no hard and fast rules that are 100% in the market, but there’s a general concept that extremes are contrarian signals. Just look at the extreme record S&P futures net spec short. It triggered a massive wave of short covering that’s helped to lift the S&P. This is a bullish extreme in sentiment.
The absolute breadth index ended higher on the day, just below 25.
S&P sectors
9 of 11 S&P sectors closed higher. Today’s rally was fairly broad and the sharp drop in yields sparked outperformance of mega cap stocks, which had been lagging over the last few sessions. However, as the day wore on the mega-cap heavy sectors went from the 3 best performing, to sliding down the leaderboard, although still toward the upper half. If we didn’t know what we know about 3C charts in mega-caps in June, I’d be surprised the mega-caps didn’t put in stronger performance given the sharp drop in yields was the most favorable environment you could ask for. The mega-cap index (MGK +1.3%) outperformed the S&P Equal Weight index by 85 basis points, which is nowhere near the margin we would have seen on a day like this at any point in the first half of the year. We would have likely seen 150 to 200 basis points of outperformance, especially after underperformance most of July.
Oddly, the very lightly weighted cyclical Materials sector, and the defensive Utilities were the two best performing sectors.
Regional Banks (+2%) outperformed amid yield curve steepening. However, other recent cyclical outperformers like the Retail sector (-0.15%) closed lower. I suspect this is a reflection of short squeeze momentum fading. Semiconductors (SOX +1.85%) outperformed the Tech sector, but were not able to break out.
Materials ⇧ 1.32 %
Energy ⇧ 0.93 %
Financials ⇧ 0.64 %
Industrial ⇩ -0.17 %
Technology ⇧ 1.13 %
Consumer Staples ⇧ 0.23 %
Utilities ⇧ 1.46 %
Health Care ⇩ -0.27 %
Consumer Discretionary ⇧ 0.90 %
Real Estate ⇧ 0.47 %
Communications ⇧ 1.21 %
Internals
Advancers led decliners by a 5-to-2 margin at the NYSE and a better than 3-to-2 margin at the NASDAQ. Volume was heavier than what was seen in Tuesday’s trading, but was still below average at the NYSE.
The Dominant price/volume relationship came in at the strongest relationship today of Close U/Volume Up, which rules out 1-day overbought internals.
Breadth oscillators at 97 remain in overbought territory.
Treasuries
The Fed-sensitive 2-year yield plunged 16 basis points to 4.73%, although the odds of a 25 basis point July hike were little changed, from 93% yesterday to 92.4% today. However, odds of a second rate hike this year fell dramatically. According to the CME FedWatch Tool, the probability of another 25 basis points rate hike is just 12.9% for the September meeting, 30.3% for the November meeting, and 24.2% for the December meeting.
The economically sensitive 10-year yield dropped 12 basis points to 3.86%.
Separately, today’s $32 billion 10-year note reopening met lukewarm demand.
The 5s-30s yield curve is less than 12 basis points from un-inverting. That’s not good news. Yield curve inversion is the warning of a recession, sharp steepening comes just before a recession.
High Yield Credit caught a huge tailwind bid on the double digit decline in yields and is now back to “close” to confirming the S&P-500 short term…
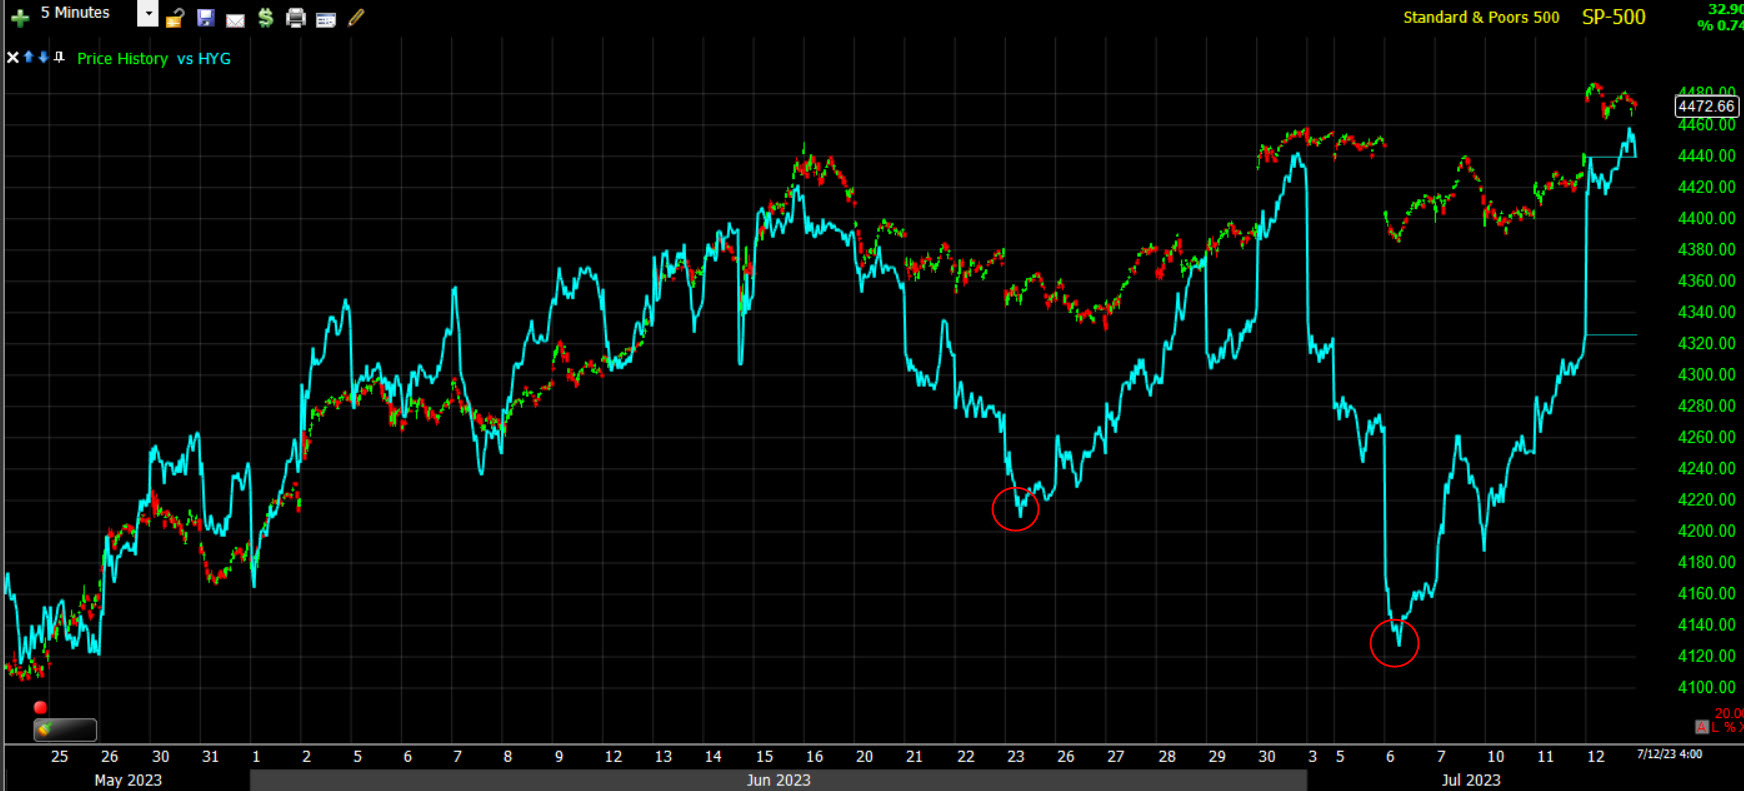 SPX (5m) and HYG (blue) – however, as we have seen with other assets like the Small Cap Index, credit has gone from a steady trend with the S&P to increasingly wild and volatile swings, making a lower low (red circles) as the S&P made a higher low. Bullish markets tend to be dull affairs. The bullish price consolidations are tight and low volatility. This increasingly volatile and chaotic trade is not the hallmark of a bullish market.
And that’s just the near term signal or trigger. We have had and still have a larger, more worrisome divergence in place for nearly 2.5 months.
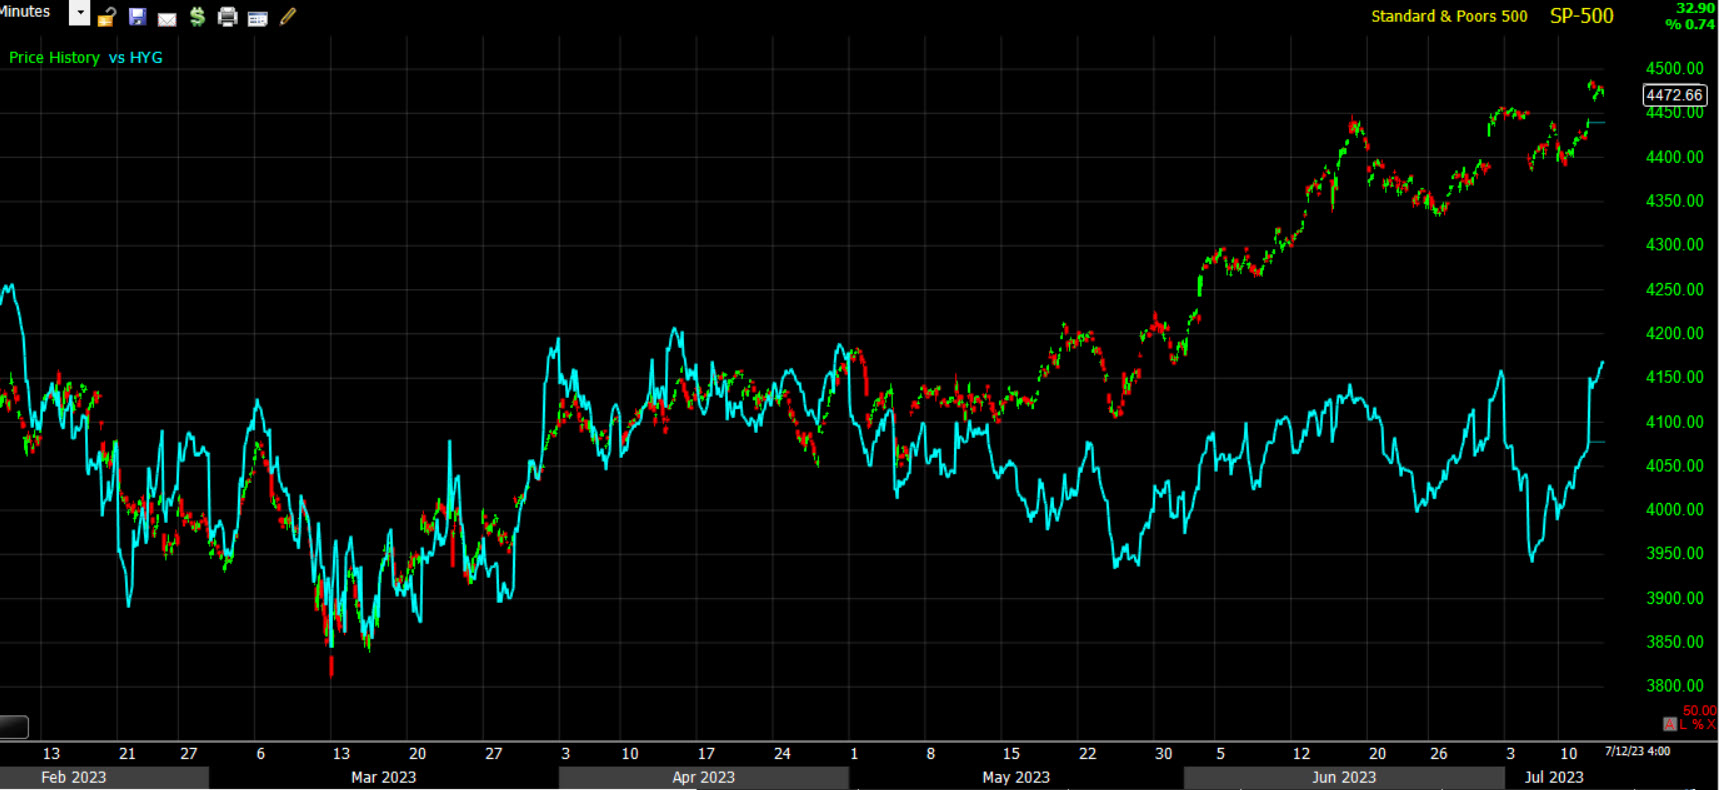
SP-500 (15m) and HYG
Currencies and Commodities
The U.S. Dollar Index declined for the fifth consecutive day, falling -1.2% to 100.54, its biggest daily drop since January 2023. The U.S. Dollar Index is now at its lowest since April 2022, which validates my suspicion that the Dollar Index was forming a large bearish descending triangle – noted as recently as yesterday’s Daily Wrap…
“If I had to make an educated guess, it would be that the Dollar is trading in a large bearish consolidation/continuation pattern called a bearish descending triangle (one of the most bearish consolidation patterns)…
… there are at least 3 different dollar correlations with stocks and as representations of different economic environments, but given what the Dollar has represented since the end of the 2020 COVID crash, another leg down here would suggest U.S. economic weakness on the way, and an increasing probability of Fed rate cuts to deal with that weakness (i.e.- recession).”
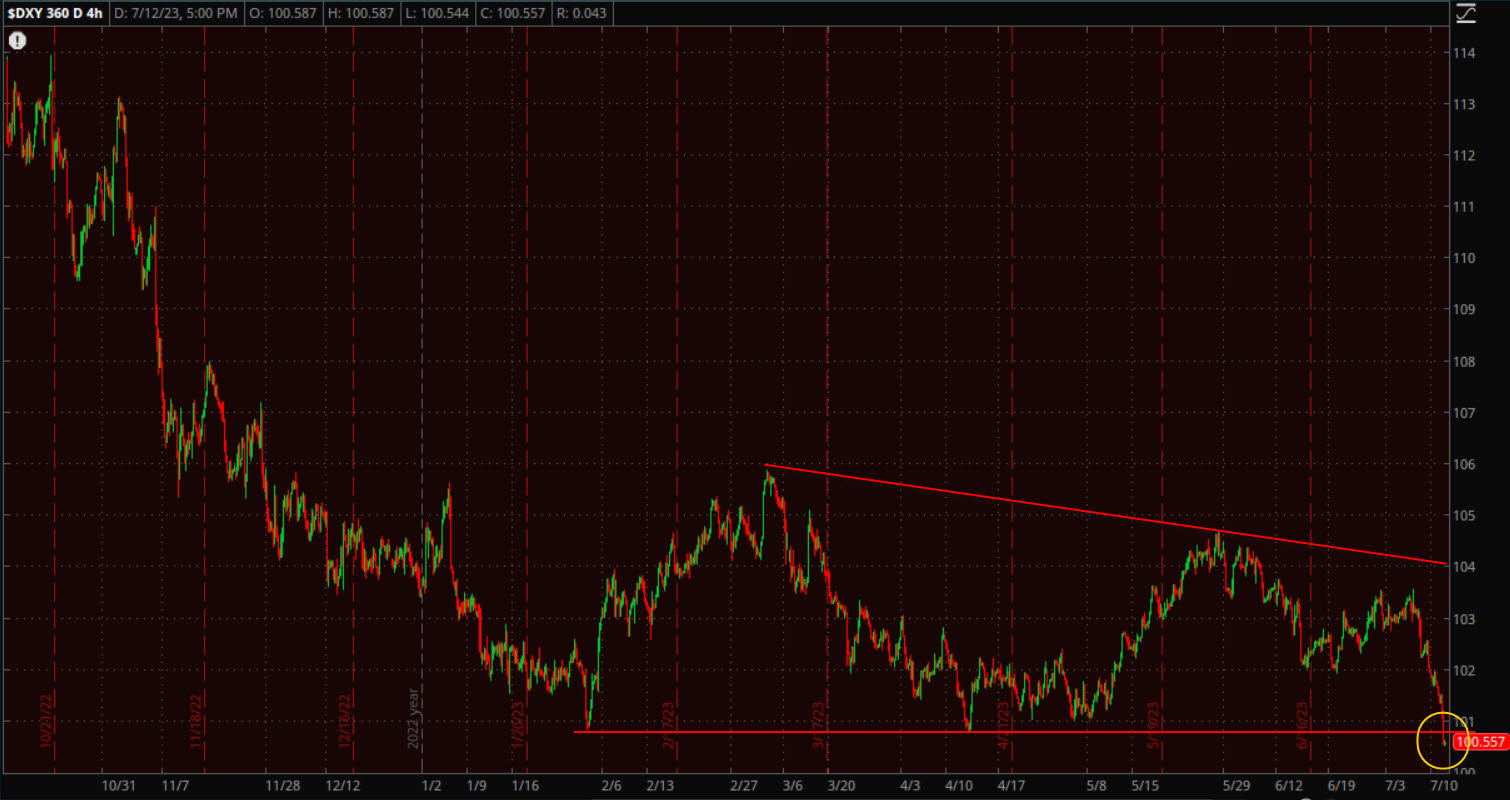 U.S. Dollar Index (4H) starting to break below support of the descending triangle. The dollar has been a proxy for inflation and Fed hawkishness, so today’s sharp decline is a reflection of how meaningful and big the CPI miss was.
WTI crude oil futures rose +1.2% to $75.76/bbl.
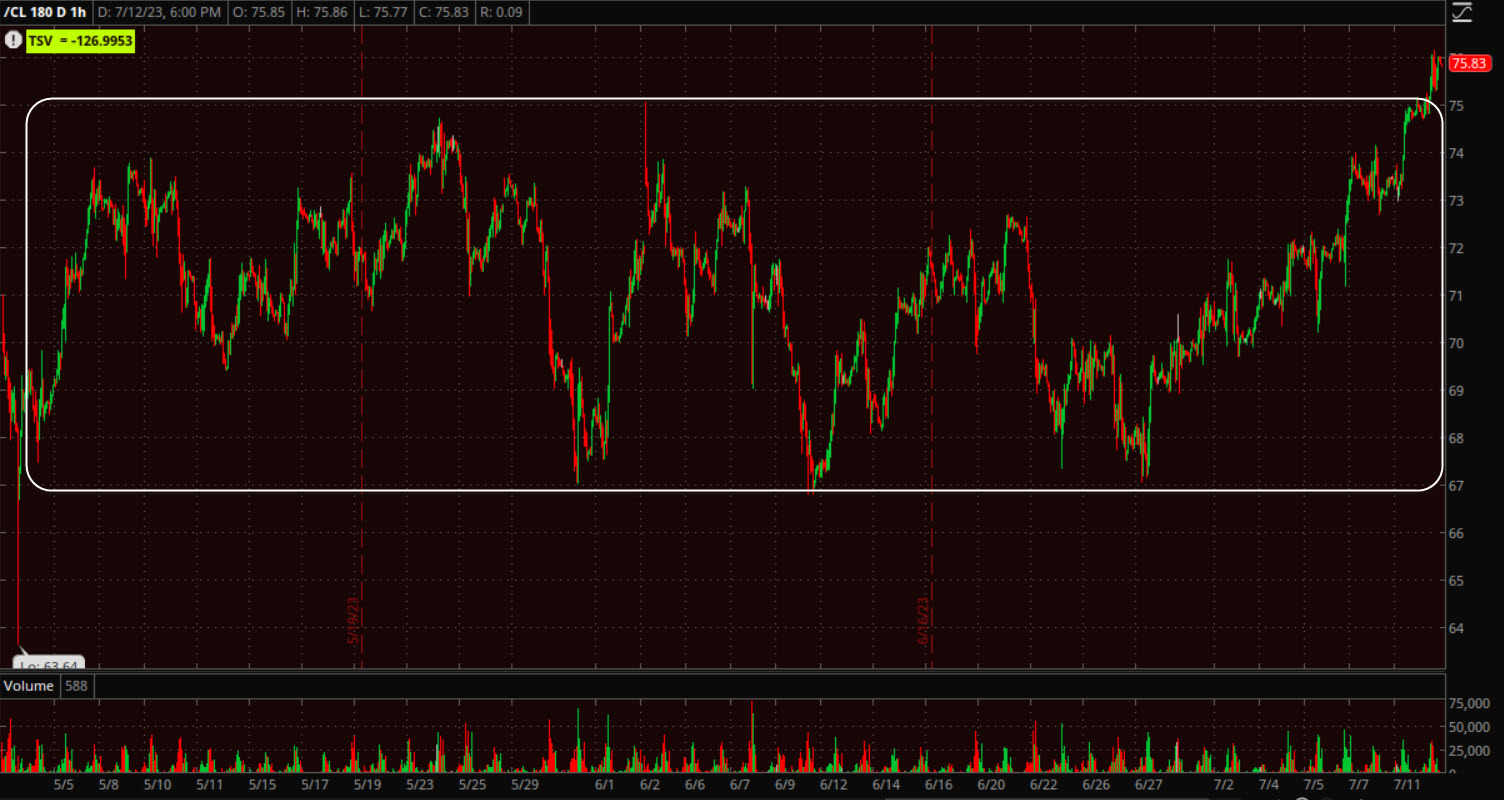 WTI Crude Oil Futures (60m) trading just above the $67-$74 range.
While gold still has a lot of work to do to turn around it’s sub-intermediate price trend, we have seen some unusual bouts of strength, including support above $1900 twice in a week when it should have easily traded below. Today lifted gold to a 3 week high and on pretty heavy buy-side volume. Gold futures settled higher by +1.3% to $1,961.70/oz,
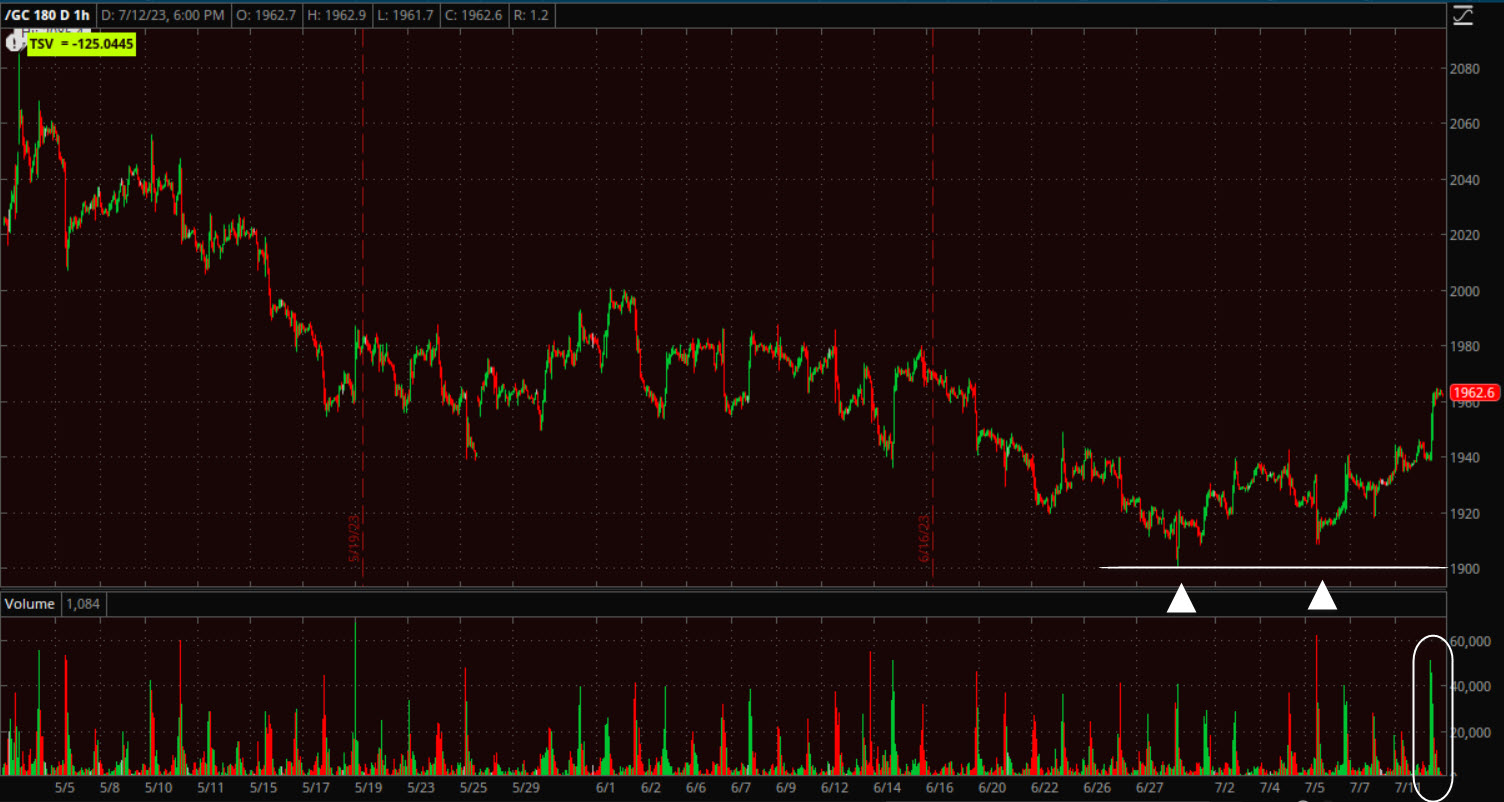 Gold futures (60m)
As for Bitcoin, you probably won’t be surprised to hear that once again it ran up toward $31k and faded back again.
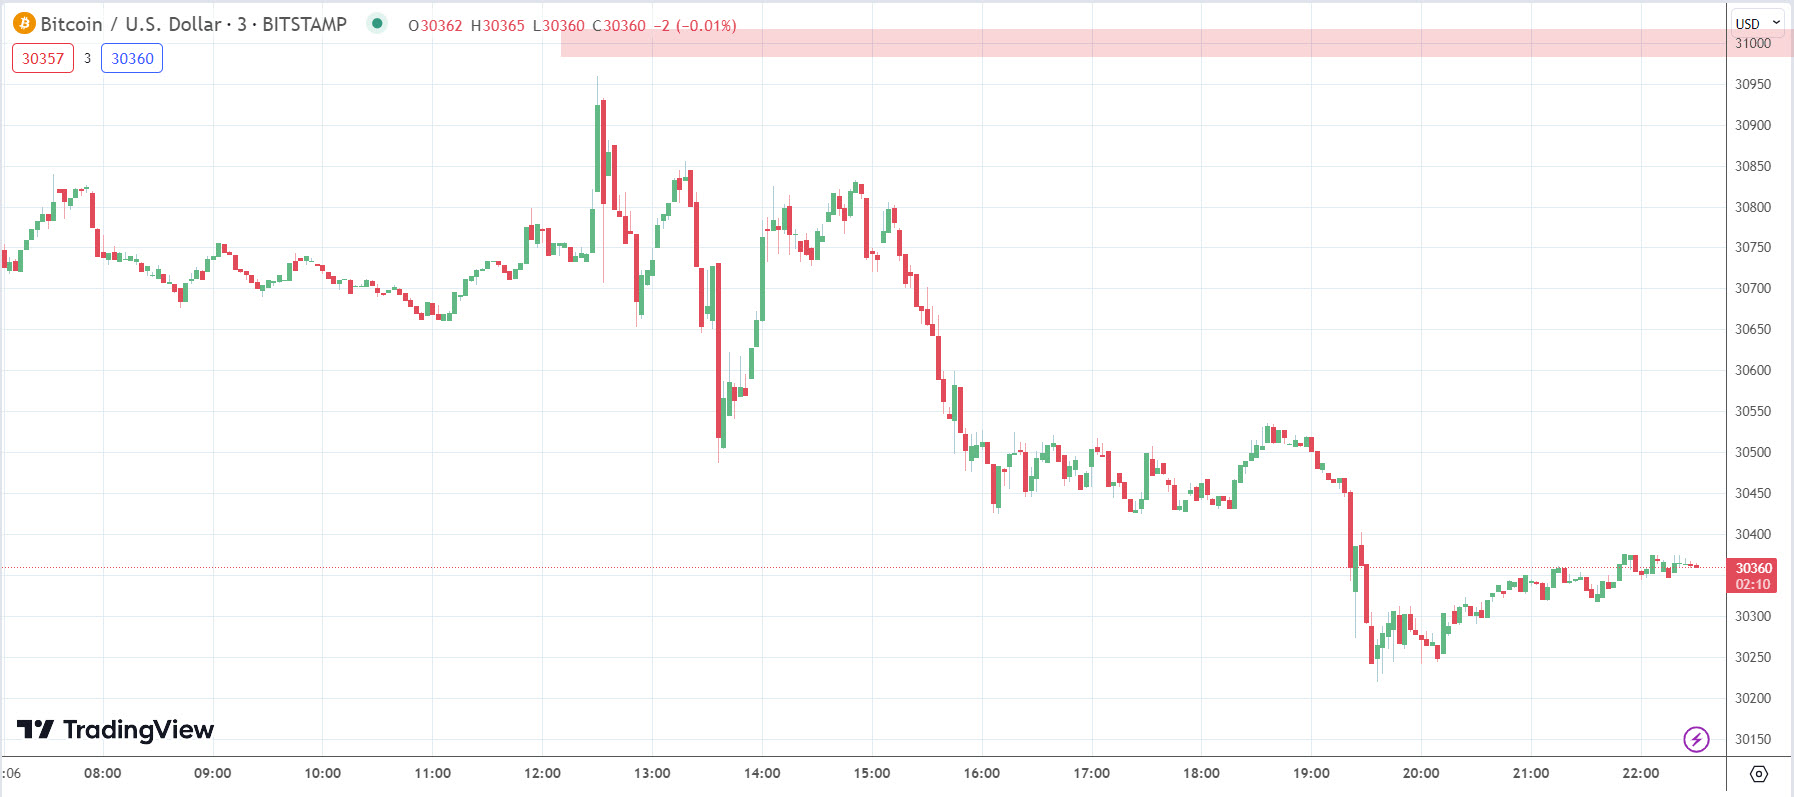 BTC/USD (3m)
Summary
I don’t recall the first time I said it, but I know I said that “Inflation is yesterday’s news” at least 3 times in early June, in the June 5th Daily Wrap. In fact one excerpt from that post summarizes my view on today’s economic data and market action,
“inflation is yesterday’s story. If you caught the section of my weekend video about how much monetary policy lags, and how long it takes to filter into the broader economy, then you’ll understand that the next several months will see much tighter conditions which will hit economic growth much harder than I believe the market is forecasting. That will also take care of the inflation problem as demand will drop through the floor with a recession, and one that I think will be particularly nasty. “
The 3 mega-cap heavy sectors opened at the top of the leaderboard as you’d expect if this news wasn’t already priced in, or was simply knee-jerk reacting. I thought it was very telling that the 3 mega-cap heavy sectors knee-jerked higher (as mass sentiment would expect on the CPI report), but then slid down the leaderboard. With Treasury yields down double digits and the dollar down more than -1% (massive tailwinds for stocks, and mega-caps in particular) you couldn’t ask for a more supportive environment for the mega-caps, yet they couldn’t even outperform the S&P Equal Weight Index by 100 basis points, which would have been run-of the mill with these conditions 2 months ago.
Add to that we heard one of the most dovish things I think a Fed official has said in 16 months. Granted, just like 1 day in the market is not a trend, 1 Fed official’s comments shouldn’t be blown out of proportion. Still, the Fed’s Lael Brainard said today that new evidence today (CPI report) shows that the U.S. is on the path to moderate inflation, AND, U.S. Inflation is now close to more normal levels!
Braindard’s comments are pretty much the closes thing to a Fed official declaring, “MISSION ACCOMPLISHED” that we’ve heard in a year and a half. Still, we don’t see massive outperformance in the mega-caps despite a very favorable environment in yields and the U.S. Dollar?
Looking at the daily charts of the major averages, you’d scarcely know anything of notable import happened on the inflation front, or anything else for that matter. I’m not surprised by any of this, I’m just trying to present the information as if we weren’t aware of what’s been happening the last month on 3C charts in the mega-cap space, and as if we weren’t aware of what’s coming as most of the retail market is not. If we were not aware, I think there would be some major questions tonight as to why we didn’t see huge, bullish breakout price candles on daily charts, on heavy volume, rather than below average volume….
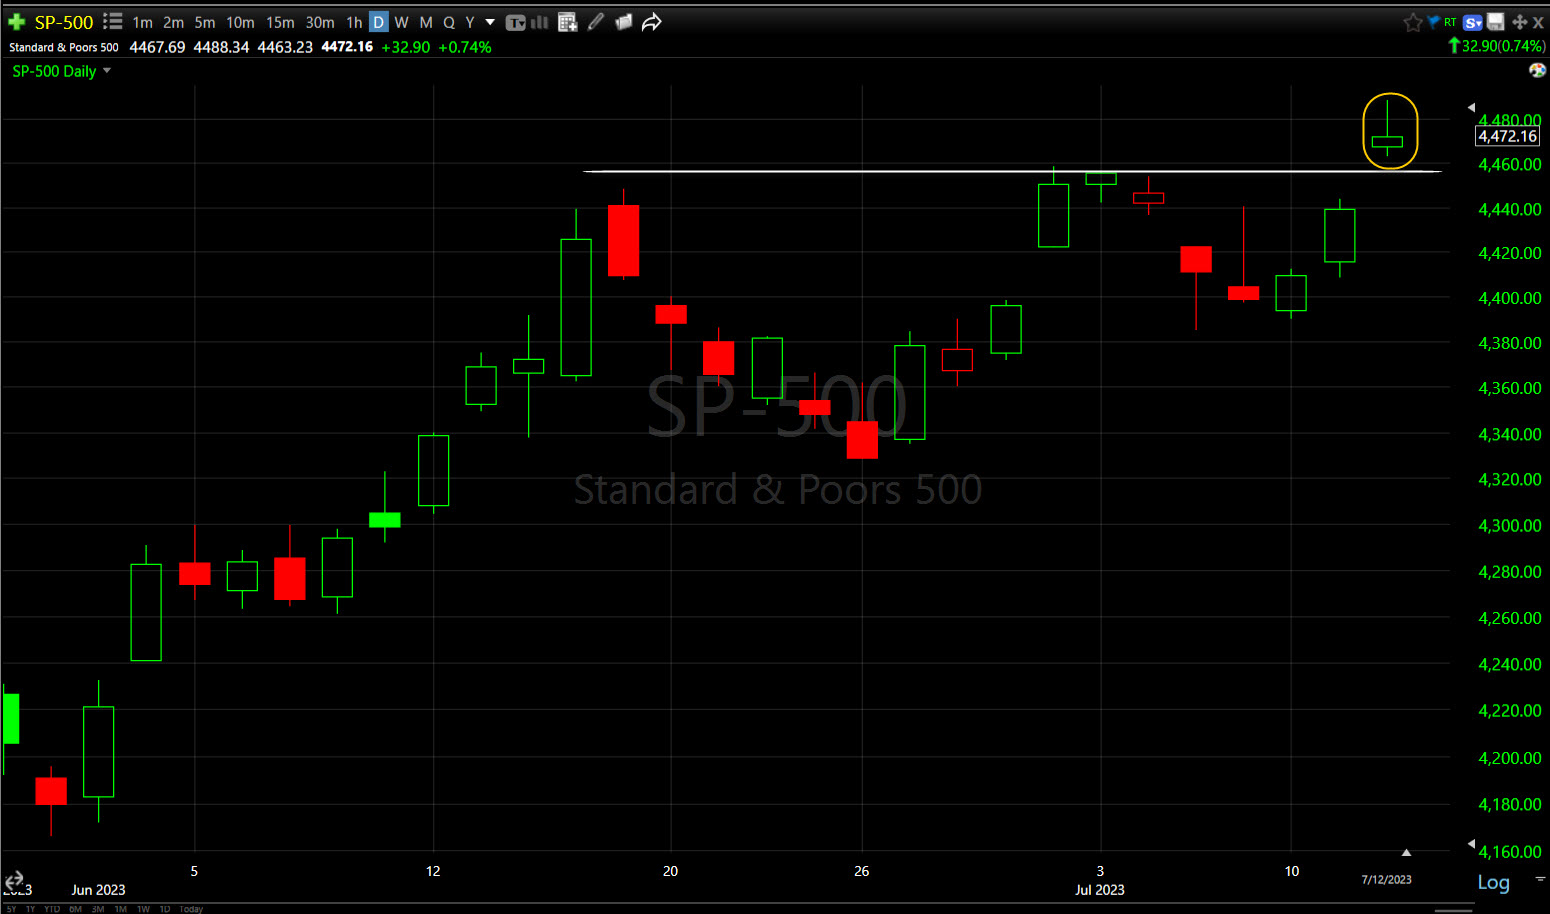 SP-500 (daily) just above the range/resistance with most of the gains on the opening gap up, leaving a small bodied price candle similar to a bearish Shooting Star, or at least a loss of momentum Star candle (yellow).
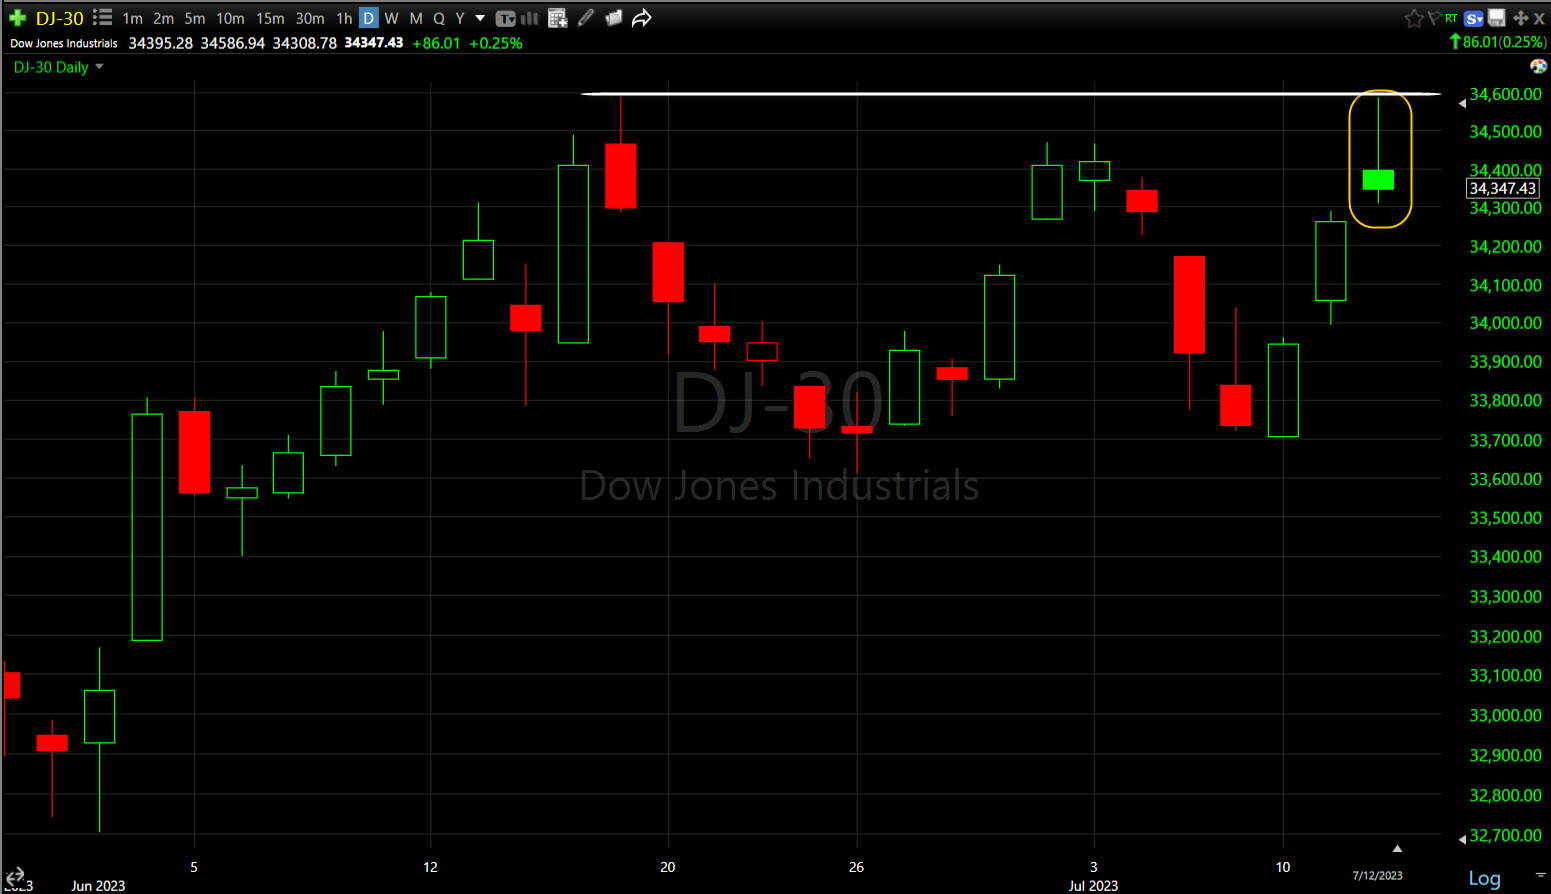 Dow (daily) not even able to break out and a pretty textbook bearish shooting star candle (yellow).
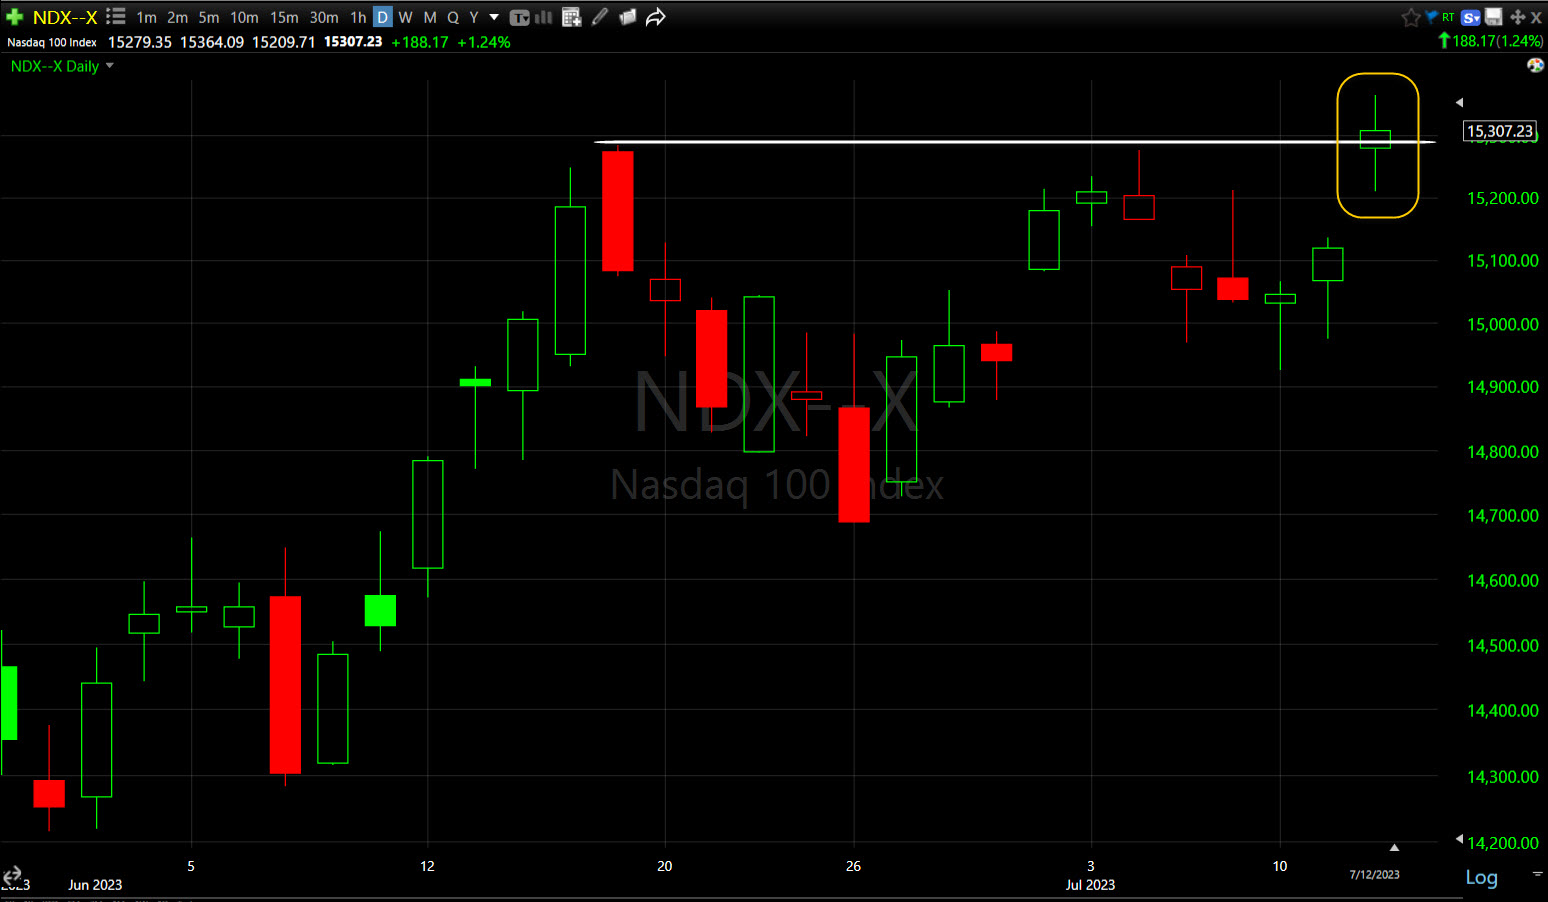 NASDAQ-100 (daily) – if we didn’t know better, I’d expect a huge bullish candle opening at the low and closing at the high, but instead we get another Star (loss of momentum) candle right at the resistance trend line.
The day was not horrible, but in context of the CPI, plunge in yields and the dollar, and Braindard’s comments, the day should have looked spectacular – if the market had not already discounted the fact that inflation (as of now) is yesterday’s news. And as I said in the Afternoon Update,
“the key moving forward is not the fight against inflation, it’s what’s coming next (hint – the lagged effect of monetary policy is about to hit the real economy with exponential tightening). As Wayne Gretzky — who has been called the greatest ice hockey player ever — once said, “I skate to where the puck is going to be, not where it has been”
My contention is that if the above was not true (smart money has already discounted the idea that inflation is yesterday’s news and what’s coming next is the bill, or cost of that fight), today would have been a LOT stronger than it was.
As I also said in the Afternoon Update,
“I still don’t think now is the time to jump in and short the market with both hands and feet. I do think it’s a time to back off on chasing risk, it’s a time to take profits on long position gains if you have them, or perhaps tighten trailing stops. I think it’s a time to pay attention to where money — which is like water, it will find some place to go — is headed next. I think it’s a time to take everything in and start making action plans. One of my own personal difficult lessons I’ve had to learn over and over again over many years is you can’t force anything. The market calls the shots, no matter how much conviction you might have, no matter how right you may eventually be, timing is essential. For me, patience has always been my biggest struggle when I see things aligning as I expected. I’ve been right so many times on what comes next, but wrong in my execution, and usually because I didn’t have enough discipline or show enough patience.”
In the near term, keep a close eye on today’s half-hearted breakout attempts on what are pretty much the most favorable market conditions you could ask for (and the Dow couldn’t even manage that) -and as short squeeze momo that’s been powering Small Caps all week seems to be running out, as does S&P futures short covering. While I don’t lean toward any major price volatility heading into the early part of earnings season starting tomorrow and during the summer doldrums, it’s a possibility.
My guess is that earnings season and more specifically forward guidance, shapes the flow of funds (where money heads). I’m guessing that it’s more defensive given a few hints we’ve already seen, not the least of which is the Utilities sector as the best performing sector in the market today! Also, while gold is not jumping off the charts in terms of price and price gains, it’s shown some very unusual strength recently, and I’m not talking about days when yields are down double digits and the Dollar is down more than 1% like today, I’m talking about days recently where the exact opposite was true.
Overnight
S&P futures are +0.15%. 3C is not confirming tonight, and hasn’t been since the cash open.
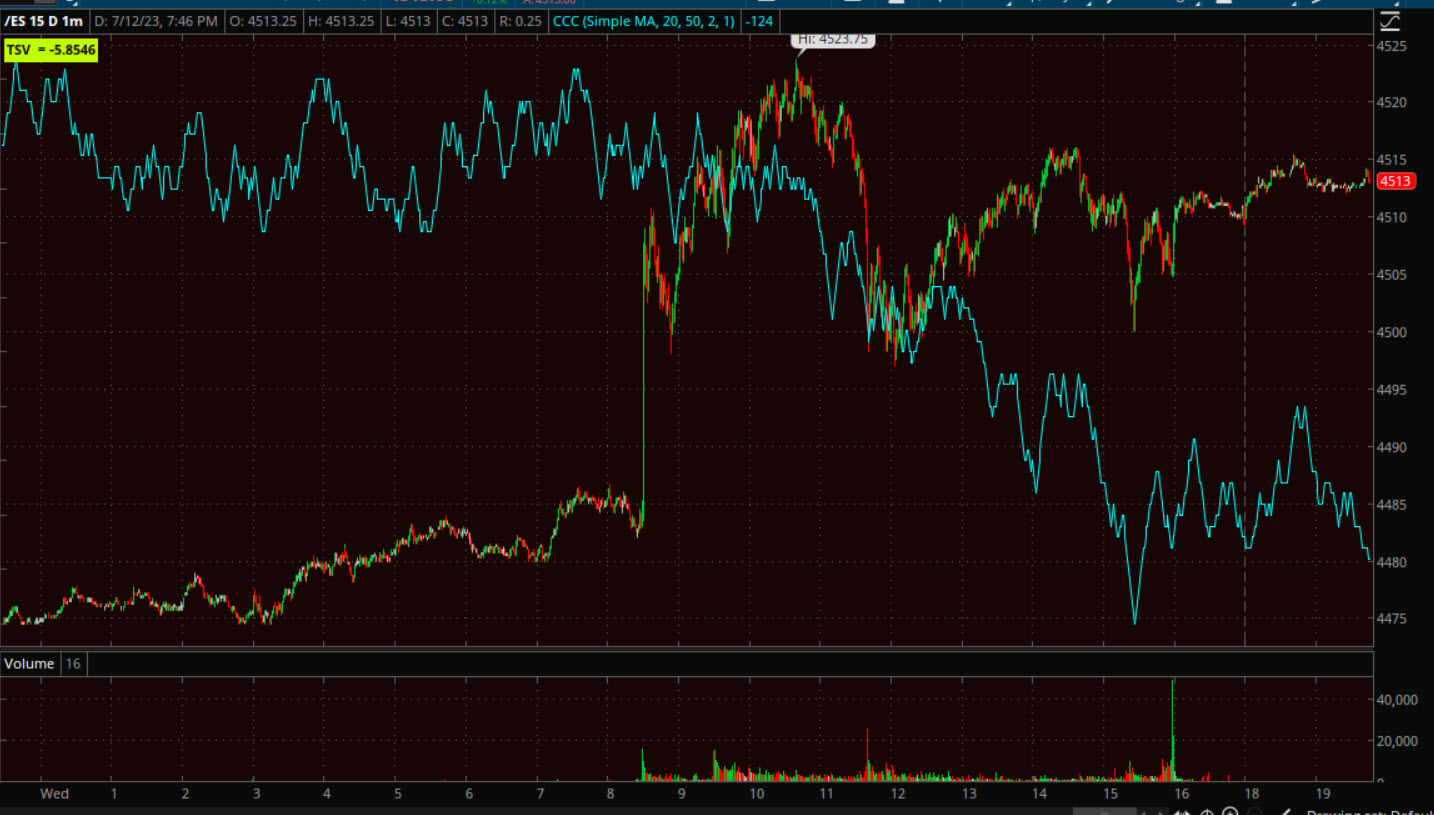 ES (1m)
NASDAQ-100 futures are similar to ES, up +0.25%, also with no 3C confirmation since the cash open. I don’t think these are signs of heavy underlying selling, but rather more lack of conviction and if you buy the mainstream media’s narratives, then today should have seen massive conviction, but smart money is months ahead of those narratives fed to the masses.
WTI Crude oil is up +0.05%. This is another asset to watch as it’s breaking out of a lateral range. I don’t have a strong opinion about this one. If China comes in with more stimulus than what we saw earlier this week to support real estate, then commodities like Crude could reasonably gain. Otherwise, as I’ve been saying a lot recently, this is the most dangerous part of a breakout.
Gold futures are little changed (+0.05%), but I do like he heavier volume on today’s advance (under favorable conditions, which we didn’t see in the broader market), and given recent hints of unusual strength. In addition, we have this…
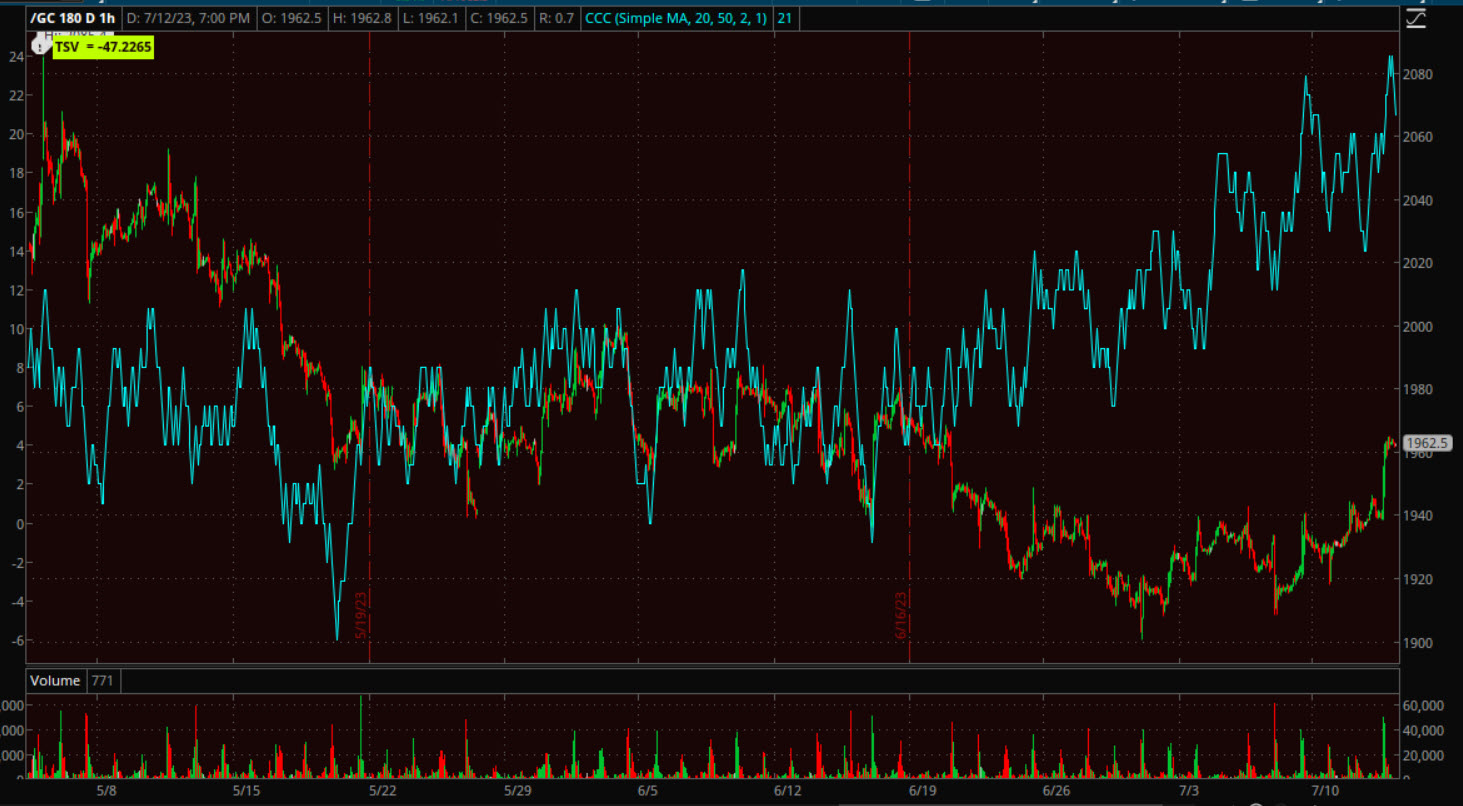
Gold futures (60m) with 3C positively diverging into the $1900 area where we saw unusual strength.
Bitcoin futures are up +0.3% to $30,490- so status quo here ($30k to $31k range).
Looking ahead to Thursday, market participants will receive the following economic data:
- 8:30 ET: Weekly Initial Claims (prior 248,000), Continuing Claims (prior 1.720 mln), June PPI (prior -0.3%), and Core PPI (prior 0.2%)
- 10:30 ET: Weekly natural gas inventories (prior +72 bcf)
- 14:00 ET: June Treasury Budget (prior -$240.30 bln)