1:47 p.m. ET
The S&P trades back above $4200 and all of the averages trade near the best levels of the day, but are coming up on or are at recent highs which could prove to be local resistance. For example..
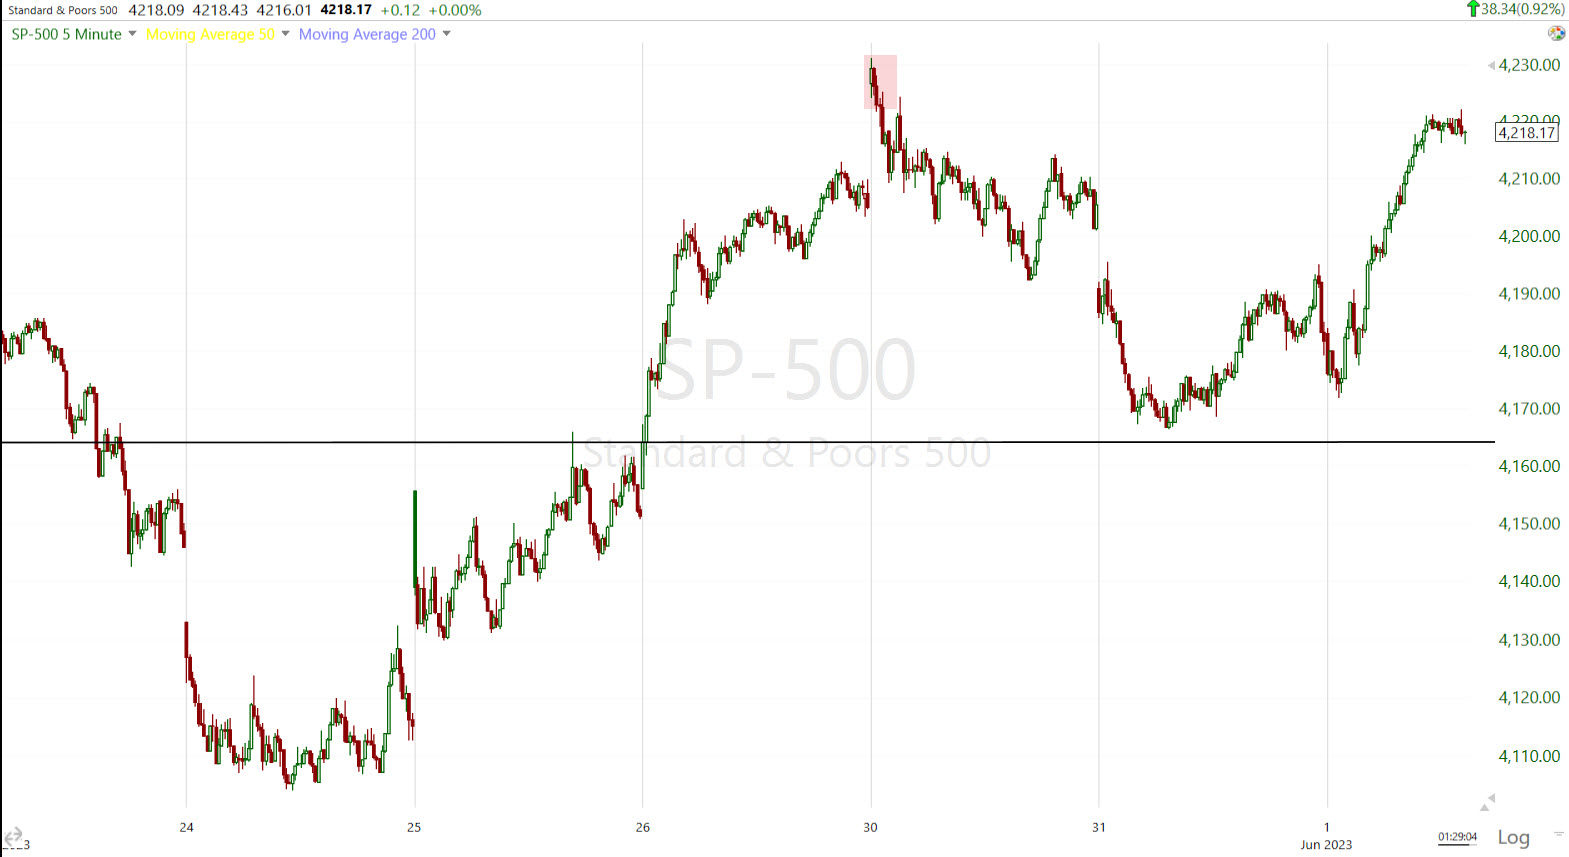 SP-500 (5m) just under Tuesday morning’s opening highs.
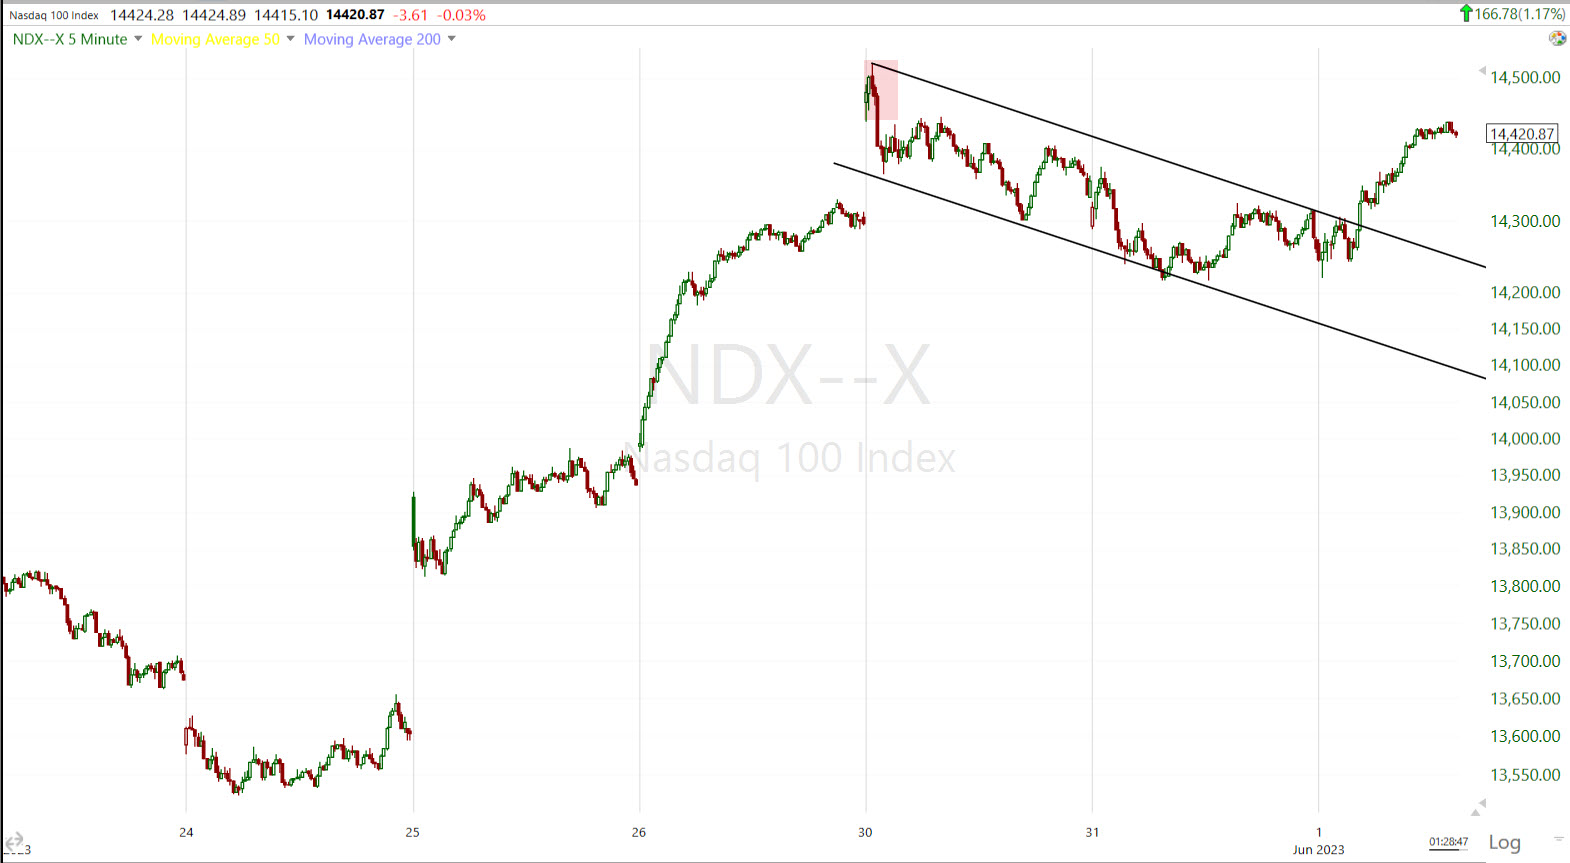 NASDAQ-100 (5m) breaking out of a bull flag this morning, but also just under Tuesday’s opening highs where we did see some selling into that price strength.
On that note, there may be some very early signs of selling into price strength taking shape, specifically in the NASDAQ-100/QQQ.
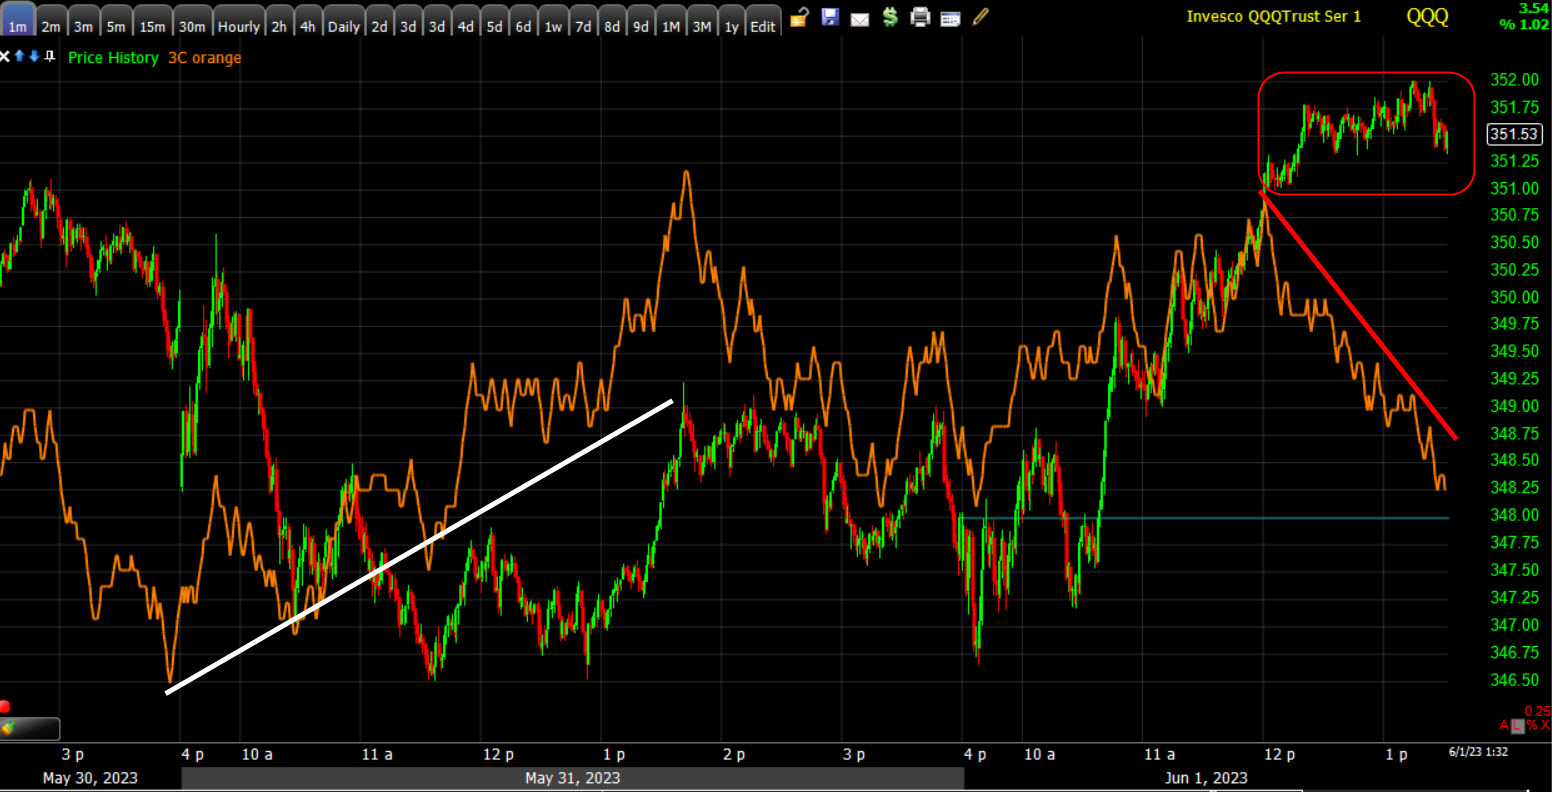 QQQ(1m) 3Cpositively diverging into the 2-day consolidation, but as prices move higher, 3C is starting to negatively diverge.
This happens to be in virtually the same area as Tuesday morning when 3C showed heavier signs of selling into early price strength…
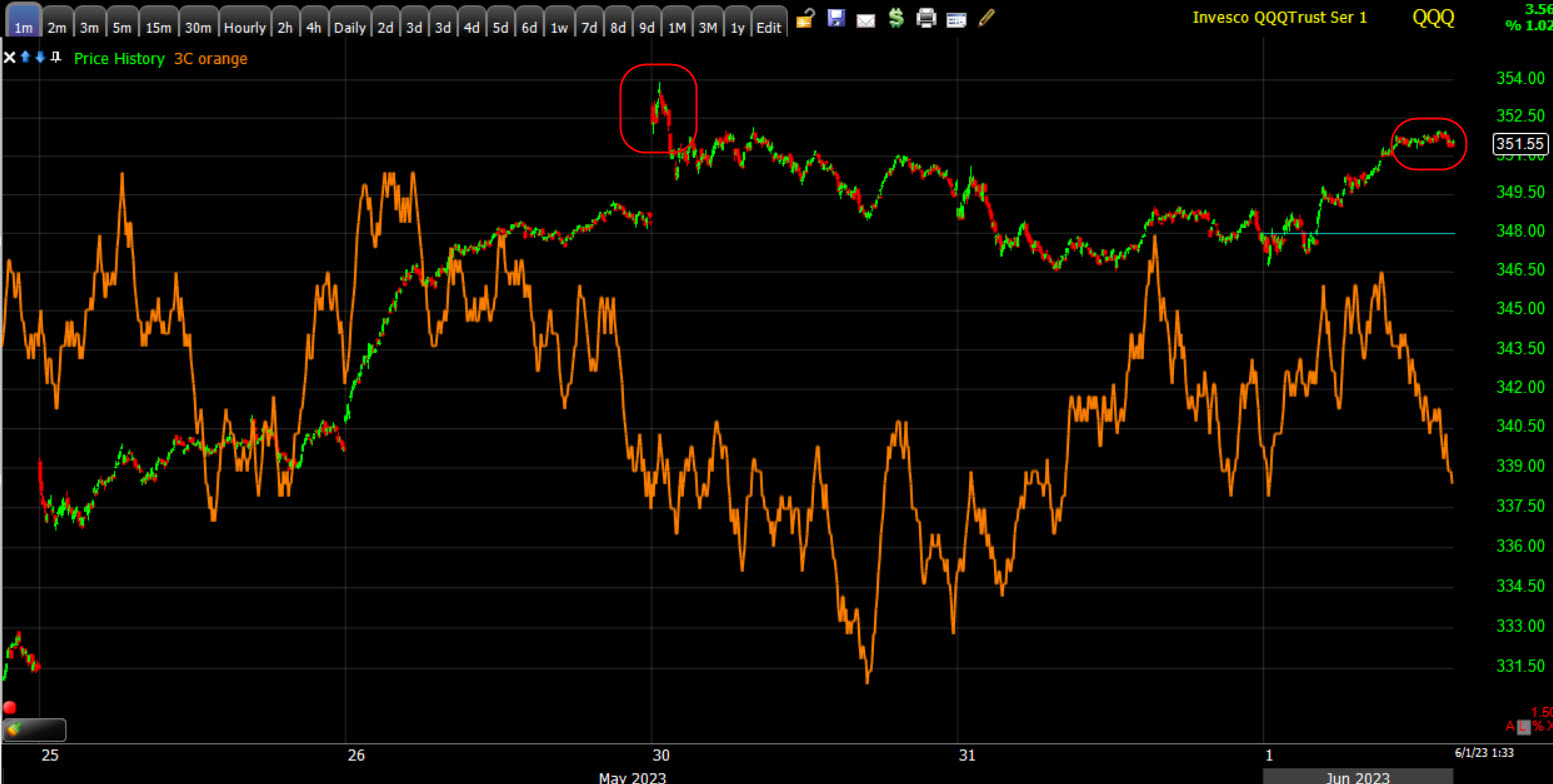
QQQ (1m)
I’m not going to assume too much based on this limited data, but it does fall in line with what I’ve expected once the S&P closed above $4200, which was just Friday.
SPY’s 3C chart is closer to in line with the upside gains, but has some modest diverging activity. Remember that the S&P has exposure to Tech and the mega-caps, just not to the same extent as the NASDAQ-100.
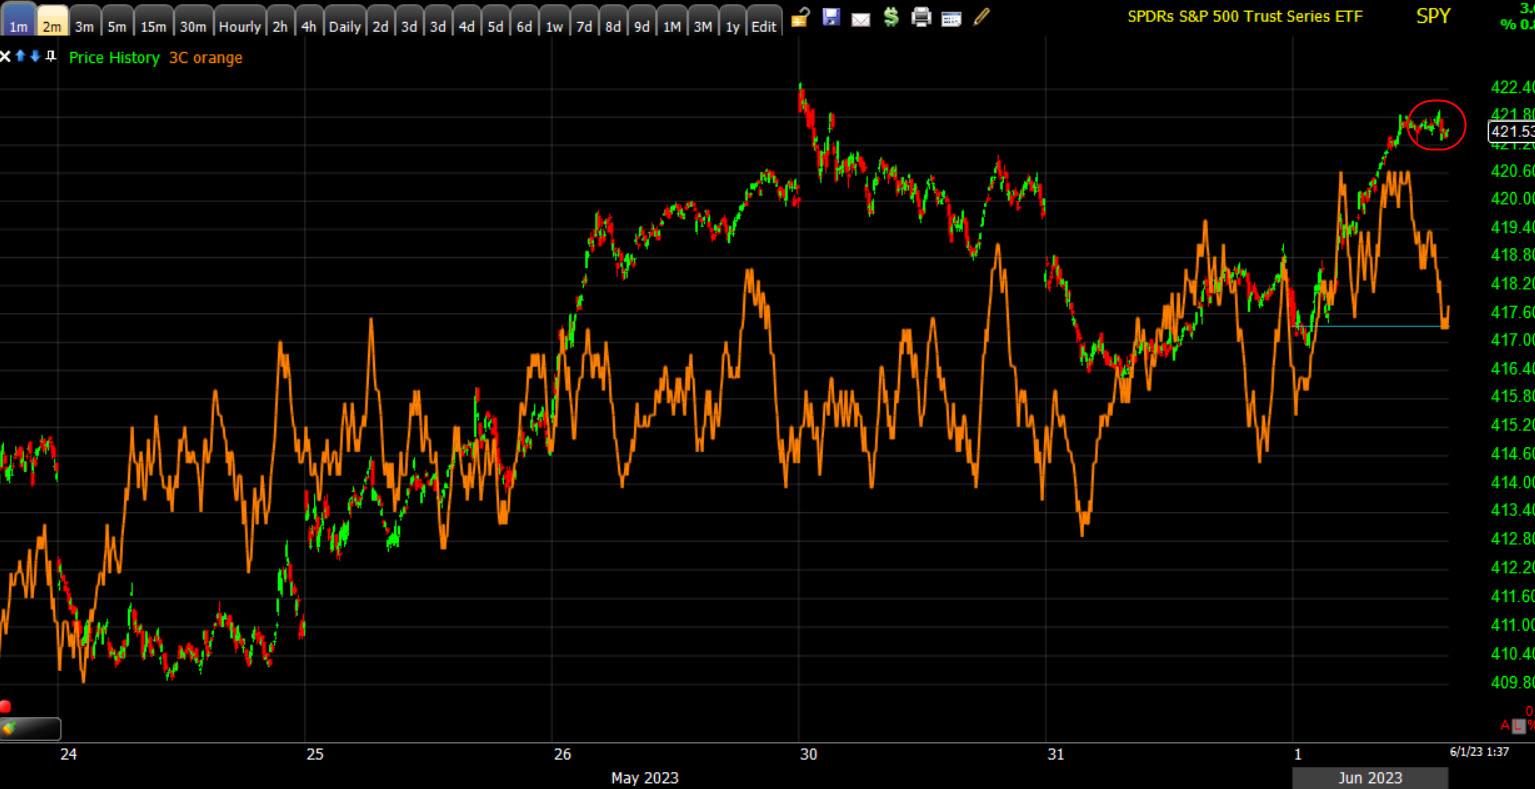 SPY (1m)
Interestingly, IWM’s 3C chart looks pretty good.
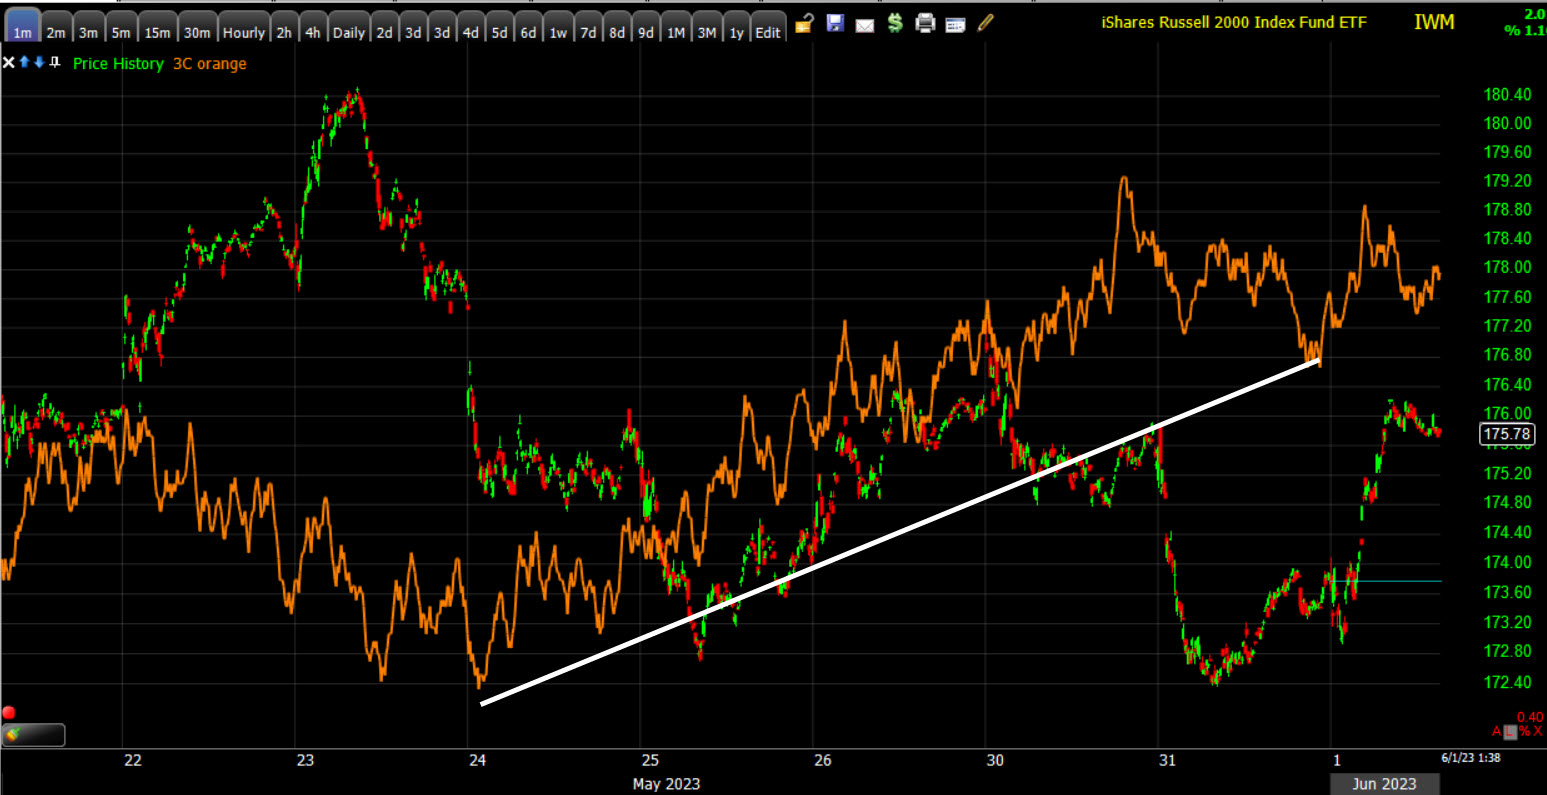 IWM (1m) notice the change in tone the last few days of May to a more positive 3C chart. We saw this kind of dynamic when mega-caps were being sold hard in December 2022, at the end of the year amid tax loss selling, window dressing, etc, but 3C was positively diverging the second half of December in the mega-caps (accumulation – buying weakness). Perhaps tat’s what we are seeing here, a rotation to Small Caps, but perhaps rather than a full quarter (or in NASDAQ/mega-caps case, two full quarters, maybe it’s just the month of June, related to bargain hunting. We’ll have to keep watching, but it does not change my Phase I transition to Phase II outlook in the least.
9 of 11 sectors are up. Generally speaking the cyclicals are performing better, but the mega-caps aren’t bad either (MGK +1.1%) vs. the Equal Weight S&P (+0.7%).
the Defensive sectors are at the bottom of the leaderboard and are the only two red sectors as risk sentiment has improved since yesterday since the House of Representatives passed the debt ceiling bill after the close yesterday.
Regional Banks (+2.3%) are outperforming, but they are right at that area of resistance where price has been rejected a half dozen times. This group will be important to watch relative to this resistance zone as it relates to whether or not small caps can do anything more impressive moving forward because they’re not doing it without the Regional Banks acting better than they have been.
Advancers are far better than 2-to-1 over decliners, so we have pretty good participation today.
I’m going to keep watching to see if there’s 1) stronger signs of distribution which appears would be hitting the leaders of 2023 thus far, Tech, mega-caps, NASDAQ-100 and 2) whether Small Caps really have a chance to do something more than they have, which has been virtually nothing.